Create and edit complex custom shapes
draw.io has a large library of pre-built shapes, but it also lets you embed your own raster and SVG images in your diagrams. While this provides you with a lot of flexibility, it doesn't let you style raster or SVG images, except to change the colours in embedded SVG images. Because SVGs and raster images aren't native shapes, they don't contain the necessary information about which shapes on which to draw shadows, apply line widths, and so on.
Basic custom shapes
You can create your own custom shapes in draw.io by describing their geometry, connection points and styles in an XML format. The basic draw.io shapes use XML. Select Arrange > Insert > Shape from the draw.io menu to open the Edit Shape dialog where you can see the XML structure of the shape.
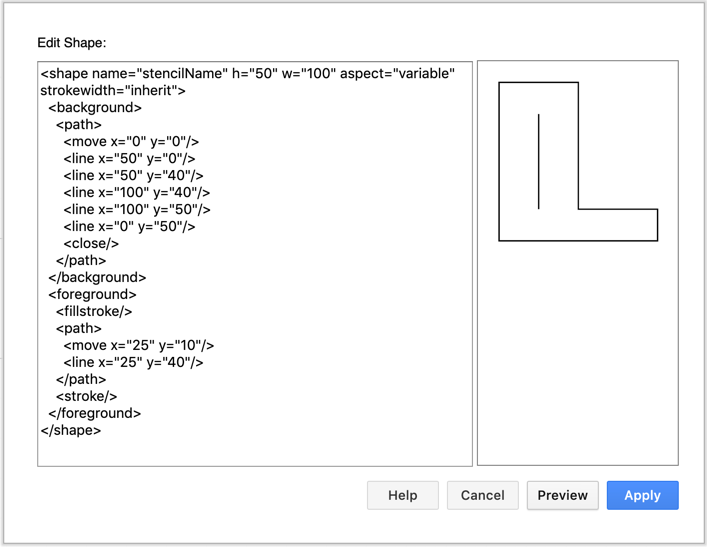
Follow this tutorial to create a custom shape
Tips
- Once you have added custom shapes to the drawing canvas, you can drag and drop them onto the scratchpad or a custom shape library.
- Edit a shape by selecting it, then click Edit Shape on the Style tab of the format panel. Note that you cannot edit all shapes, only those that are in XML format.
Create advanced custom shapes
At the end of this page you'll find the XML to create the example used below. Copy and paste this XML into the Edit Shape dialog via Arrange > Insert > Shape in draw.io online, and click Preview to see how more complex shapes are constructed in XSD.
Use the reference below to see how each custom shape element is defined and the order in which you need to nest these elements.
<shape>
The outer element is <shape>, which has the following attributes:
name- string, required. This name uniquely identifies the shape. Not currently used in draw.io.w,h- optional decimal view bounds. This defines your co-ordinate system for the graphics operations in the shape. The default is100,100.aspect- optional string with the value of either"variable", the default, or"fixed". Fixed always renders the shape with the aspect ratio defined by the ratiow/h. Variable causes the ratio to match that of the geometry of the current vertex.strokewidth- optional string containing either an integer or the string"inherit". Inherit indicates that the strokewidth of the cell is only changed when you scale it, and not when you resize it. If you use a numeric value, the strokewidth of the cell will change both when you scale and when you resize the shape. This numeric value defines the multiplier that is applied to the width. The default is"1".
<connections>
If you want to [define specific fixed connection points] on your custom shape, use the <connections> element. Each <constraint> element within the <connections> element defines a fixed connection point on the shape.
Constraints have the following attributes:
perimeter- required, either1or0. A value of0sets the connection point where specified byx,y. A value of1extrapolates the position of the connection point from the center of the shape, throughx,y, to the point of intersection with the perimeter of the shape.x,y- the position of the fixed point relative to the bounds of the shape. These are automatically adjusted ifperimeter=1.(0,0)is the top left of the shape,(0.5,0.5)is the center,(1,0.5)is the center of the right hand edge of the bounds, etc. Use values less than0or greater than1to position the fixed point outside of the shape.name- optional string. A unique identifier for the port on the shape.
Tip: You can also edit your custom shape's fixed connection points when you have placed it on the drawing canvas.
<background> and <foreground>
The paths used to draw the shape are split into two elements, <foreground> and <background>. If a shadow is defined, this is derived from the <background> element. Generally, the background of the shape is the line that traces the outside of the shape, but this may not always be the case.
Any stroke, fill or fillstroke of a background must be defined as the first stroke of the <foreground> element, and never in the <background> element. If the background of your shape is empty, this is not required.
The <background> element can only contain one <path>, <rect>, <roundrect> or <ellipse> element (or none). It can not contain any fill, stroke, image, text or include-shape.
Note that the state, styling and drawing in the mxGraph shapes used in draw.io is very close in design to that of HTML 5 canvas. Use these suggested HTML 5 tutorials for a high-level introduction to the concepts used.
State
Foreground and background elements are rendered following the concept of state. In addition to the state save/load operation, there are two other types of operations: style and draw. An applied style changes the current state.
<save/>- saves the current state (current style).<restore/>- retrieves (loads) the last saved state from the state stack.
Style
Elements that change the colours within the current state (style) require a hash-prefixed hex color code ("#FFEA80") or fill, stroke, font or default to reference the current state.
<strokecolor>- defines the path colour when a stroke or fillstroke command is issued.<fillcolor>- defines the colour inside a closed path when a fill or fillstroke command is issued.<fontcolor>- defines the colour of the fonts when text is drawn.
The other style elements are as follows:
<alpha>- defines the alpha level, the opposite of transparency, with a range of0.0-1.0, decimal. Use0.0for fully transparent and1.0for solid (opaque).<fillalpha>- defines the fill transparency, with a range of0.0-1.0, decimal. Use0.0for fully transparent and1.0for solid (opaque).<strokealpha>- defines the stroke transparency, with a range of0.0-1.0, decimal. Use0.0for fully transparent and1.0for solid (opaque).<strokewidth>- defines the integer thickness elements drawn by stroke or fillstroke. Usefixed="1"to apply the value as-is, with no scaling.<dashed>- defines the stroke style. Use"1"to enable dashes and"0"for a solid line.<dashpattern>- defines the pattern of dashes and spaces on dashed strokes (when these are enabled). Use a sequence of space-separated "on, off" lengths to define the number of points used to draw a line or a space. The pattern repeats, and the default is"3 3". You can define a more complex pattern with"5 3 2 6", for example. An even number of elements in the dashpattern looks more balanced, but is not required.<linejoin>,<linecap>and<miterlimit>- determine how two connecting segments of a line are joined together, how the end points of every line are drawn, and the maximum distance between the outer and inner connection points of two lines respectively. For a visual example, refer to the Mozilla page on Canvas styling. draw.io uses the same definitions, except that linecap is"flat"instead of Canvas'"butt".
For font styling, the following elements are used:
<fontsize>- an integer.<fontstyle>- an ORed bit pattern that indicates bold (1), italic (2) and underline (4). For example, bold underline is defined by the value"5".<fontfamily>- a string that defines the typeface to be used.
Custom Colors
User-defined custom colors can be defined in the cell style and used in stencils. The fillColorStyles and strokeColorStyles contain a comma-separated list of style names, eg. fillColorStyles=ellipseFill,rectangleFill;. The user can select colors for these styles using the color picker in the style panel:
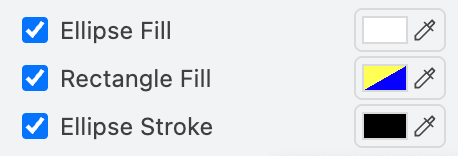
These colors are then referenced in stencil XML by using the respective style name in the color attribute, eg. <fillcolor color="ellipseFill" />.
Any color can be referenced in any color directive, with the default keyword for fillcolor resolving to shapeBackgroundColor and shapeForegroundColor for all other colors.
Drawing
Most of the drawing (the lines inside the shape) is contained within a <path> element. The graphic primitives used by mxGraph in draw.io are very similar to that of HTML 5 Canvas.
<move>- to attributes, required decimals(x,y).<line>- to attributes, required decimals(x,y).<quad>- to required decimals(x2,y2)via the control point, required decimals(x1,y1).<curve>- to required decimals(x3,y3), via control points, required decimals(x1,y1)and(x2,y2).<arc>- a copy of the SVG arc command and doesn't follow the HTML Canvas signatures. The SVG specification documentation gives the best description of its behaviour. The attributes are named identically, all decimals, and all required.<close>- ends the current subpath and causes an automatic straight line to be drawn from the current point to the initial point of the current subpath.
Complex drawing
In addition to the graphics primitive operations described above, there are non-primitive operations. Use these to more easily draw some of the basic shapes:
<rect>- attributes"x","y","w","h", all required decimals.<roundrect>- attributes"x","y","w","h", all required decimals. Also"arcsize"an optional decimal attribute defining how large the corner curves are.<ellipse>- attributes"x","y","w","h", all required decimals.
Note: these three shapes and all of their paths must be followed by either a fill, stroke, or fillstroke to render them.
<text>
Text elements have the following attributes:
str- the text string to display, required.xandy- the decimal location(x,y)of the text element, required.align- the horizontal alignment of the text element, either"left","center"or"right". Optional, default is"left".valign- the vertical alignment of the text element, either"top","middle"or"bottom". Optional, default is"top".localized-0or1. If1then the"str"actually contains a key used to fetch the value out ofmxResources. Optional, default is0, currently unused in draw.io.vertical-0or1. If1then the label is rendered vertically (rotated by 90 degrees). Optional, default is0.rotation- angle in degrees (0to360). The angle to rotate the text by. Optional, default is0.align-shape-0or1. If0then the rotation of the shape is ignored when setting the text rotation. Optional, default is1.placeholders-0or1. If1then placeholders of the form%name%will be replaced with their values. Optional, default is0.
<image>
Image elements can either be external URLs, or data URIs, where supported (not supported in IE 7 or earlier versions).
Attributes are:
src- required string. Either a data URI or URL.x,y- required decimals. The(x,y)position of the image.w,h- required decimals. The width and height of the image.flipH,flipV= optional0or1. Used to flip the image along the horizontal/vertical axis. Default is0for both.
Sub-shapes
Note: This is only supported with the built-in draw.io shapes.
<include-shape> allows sub-shapes to be rendered within the current shape by referencing the sub-shape by name.
Attributes are:
name- required string. The unique shape name.x,y, andw,h-required decimals. The(x,y)position of the sub-shape and its width and height.
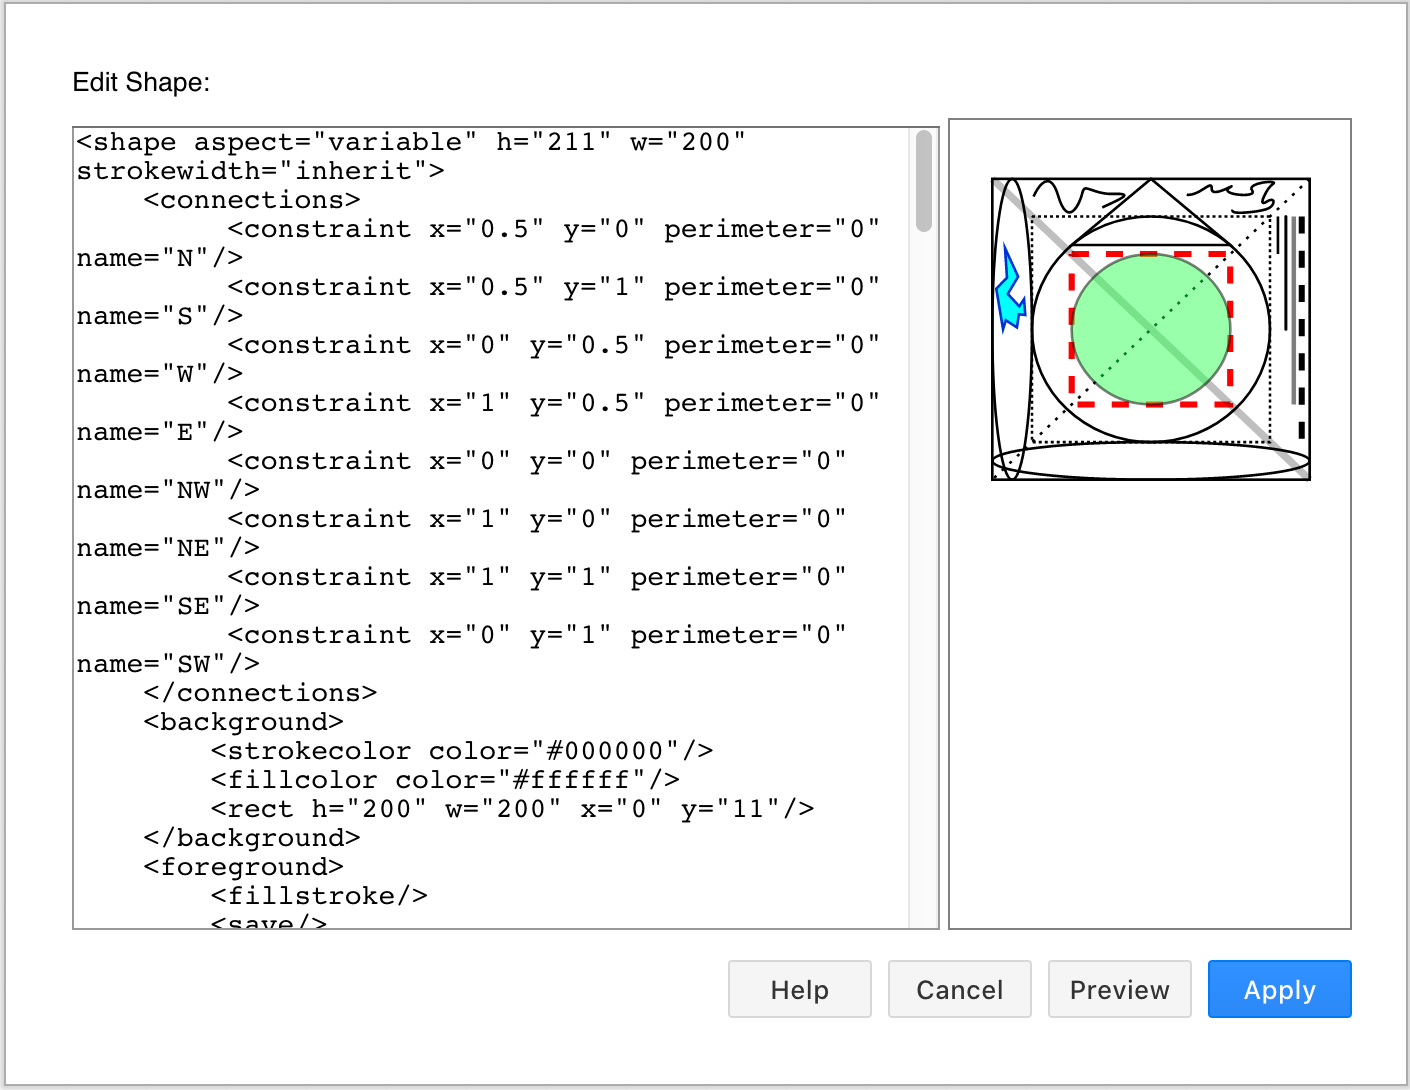
Example complex custom shape
This complex custom shape is represented by the following XML code. Copy and paste this XML into the Edit Shape dialog via Arrange > Insert > Shape in our online editor, then click Preview.
<shape aspect="variable" h="211" w="200" strokewidth="inherit">
    <connections>
         <constraint x="0.5" y="0" perimeter="0" name="N"/>
         <constraint x="0.5" y="1" perimeter="0" name="S"/>
         <constraint x="0" y="0.5" perimeter="0" name="W"/>
         <constraint x="1" y="0.5" perimeter="0" name="E"/>
         <constraint x="0" y="0" perimeter="0" name="NW"/>
         <constraint x="1" y="0" perimeter="0" name="NE"/>
         <constraint x="1" y="1" perimeter="0" name="SE"/>
         <constraint x="0" y="1" perimeter="0" name="SW"/>
    </connections>
    <background>
        <strokecolor color="#000000"/>
        <fillcolor color="#ffffff"/>
        <rect h="200" w="200" x="0" y="11"/>
    </background>
    <foreground>
        <fillstroke/>
        <save/>
        <save/>
        <save/>
        <save/>
        <save/>
        <save/>
        <save/>
        <dashpattern pattern="2 2"/>
        <dashed dashed="1"/>
        <rect h="150" w="150" x="25" y="36"/>
        <stroke/>
        <strokecolor color="#ff0000"/>
        <strokewidth width="4"/>
        <linejoin join="round"/>
        <linecap cap="round"/>
        <dashpattern pattern="5 5"/>
        <rect h="100" w="100" x="50" y="61"/>
        <stroke/>
        <restore/>
        <rect/>
        <stroke/>
        <strokecolor color="#000000"/>
        <fillcolor color="none"/>
        <strokewidth width="5"/>
        <alpha alpha="0.25"/>
        <path>
            <move x="0" y="11"/>
            <line x="200" y="211"/>
        </path>
        <stroke/>
        <restore/>
        <rect/>
        <stroke/>
        <strokecolor color="#000000"/>
        <fillcolor color="none"/>
        <dashpattern pattern="2 5"/>
        <dashed dashed="1"/>
        <path>
            <move x="200" y="11"/>
            <line x="0" y="211"/>
        </path>
        <stroke/>
        <restore/>
        <rect/>
        <stroke/>
        <strokecolor color="#000000"/>
        <fillcolor color="none"/>
        <ellipse h="150" w="150" x="25" y="36"/>
        <stroke/>
        <fillcolor color="#66ff66"/>
        <alpha alpha="0.5"/>
        <ellipse h="100" w="100" x="50" y="61"/>
        <fillstroke/>
        <restore/>
        <rect/>
        <stroke/>
        <strokecolor color="#000000"/>
        <fillcolor color="none"/>
        <ellipse h="25" w="200" x="0" y="186"/>
        <stroke/>
        <ellipse h="200" w="25" x="0" y="11"/>
        <stroke/>
        <path>
            <move x="150" y="55"/>
            <line x="50" y="55"/>
            <line x="100" y="11"/>
            <close/>
        </path>
        <stroke/>
        <path>
            <move x="180" y="36"/>
            <line x="180" y="61"/>
        </path>
        <stroke/>
        <strokewidth width="2"/>
        <linecap cap="round"/>
        <path>
            <move x="185" y="36"/>
            <line x="185" y="111"/>
        </path>
        <stroke/>
        <restore/>
        <rect/>
        <stroke/>
        <strokecolor color="#000000"/>
        <fillcolor color="none"/>
        <strokewidth width="3"/>
        <alpha alpha="0.5"/>
        <path>
            <move x="190" y="36"/>
            <line x="190" y="161"/>
        </path>
        <stroke/>
        <restore/>
        <rect/>
        <stroke/>
        <strokecolor color="#000000"/>
        <fillcolor color="none"/>
        <strokewidth width="4"/>
        <dashpattern pattern="5 5"/>
        <dashed dashed="1"/>
        <path>
            <move x="195" y="36"/>
            <line x="195" y="186"/>
        </path>
        <stroke/>
        <restore/>
        <rect/>
        <stroke/>
        <strokecolor color="#000000"/>
        <fillcolor color="none"/>
        <path>
            <move x="26" y="22.75"/>
            <curve x1="26" x2="35.25" x3="41.5" y1="22.75" y2="0" y3="22.25"/>
            <curve x1="47.75" x2="55.25" x3="56.75" y1="44.5" y2="27.5" y3="20.25"/>
            <curve x1="58.25" x2="62.75" x3="75.75" y1="13" y2="21.5" y3="21"/>
            <curve x1="88.75" x2="83.5" x3="69.25" y1="20.5" y2="23.25" y3="30"/>
        </path>
        <stroke/>
        <path>
            <move x="122.5" y="21.5"/>
            <curve x1="130.25" x2="138.5" x3="138.25" y1="23.25" y2="10.5" y3="17.5"/>
            <curve x1="138" x2="156" x3="149.25" y1="24.5" y2="12.5" y3="17"/>
            <curve x1="142.5" x2="167.75" x3="163.75" y1="21.5" y2="24" y3="18.75"/>
            <curve x1="159.75" x2="180.75" x3="177" y1="13.5" y2="11.5" y3="14.25"/>
            <curve x1="173.25" x2="166.5" x3="172.75" y1="17" y2="30.5" y3="26.25"/>
            <curve x1="179" x2="178.5" x3="172.5" y1="22" y2="29.5" y3="31.25"/>
            <curve x1="166.5" x2="149.25" x3="151.5" y1="33" y2="35.25" y3="31.5"/>
        </path>
        <stroke/>
        <strokecolor color="#0033cc"/>
        <fillcolor color="#00ffff"/>
        <path>
            <move x="8" y="57"/>
            <line x="16.25" y="76"/>
            <line x="9.75" y="87.5"/>
            <line x="17" y="95.75"/>
            <line x="20" y="91"/>
            <line x="20.75" y="101.5"/>
            <line x="16.75" y="101"/>
            <line x="15.5" y="109.75"/>
            <line x="8.5" y="105"/>
            <line x="6.75" y="111"/>
            <line x="2.5" y="84"/>
            <line x="9.25" y="76.75"/>
            <close/>
        </path>
        <fillstroke/>
    </foreground>
</shape>
Tip: You can also edit the XML source code of each page in your diagram manually in a similar way via Extras > Edit Diagram.