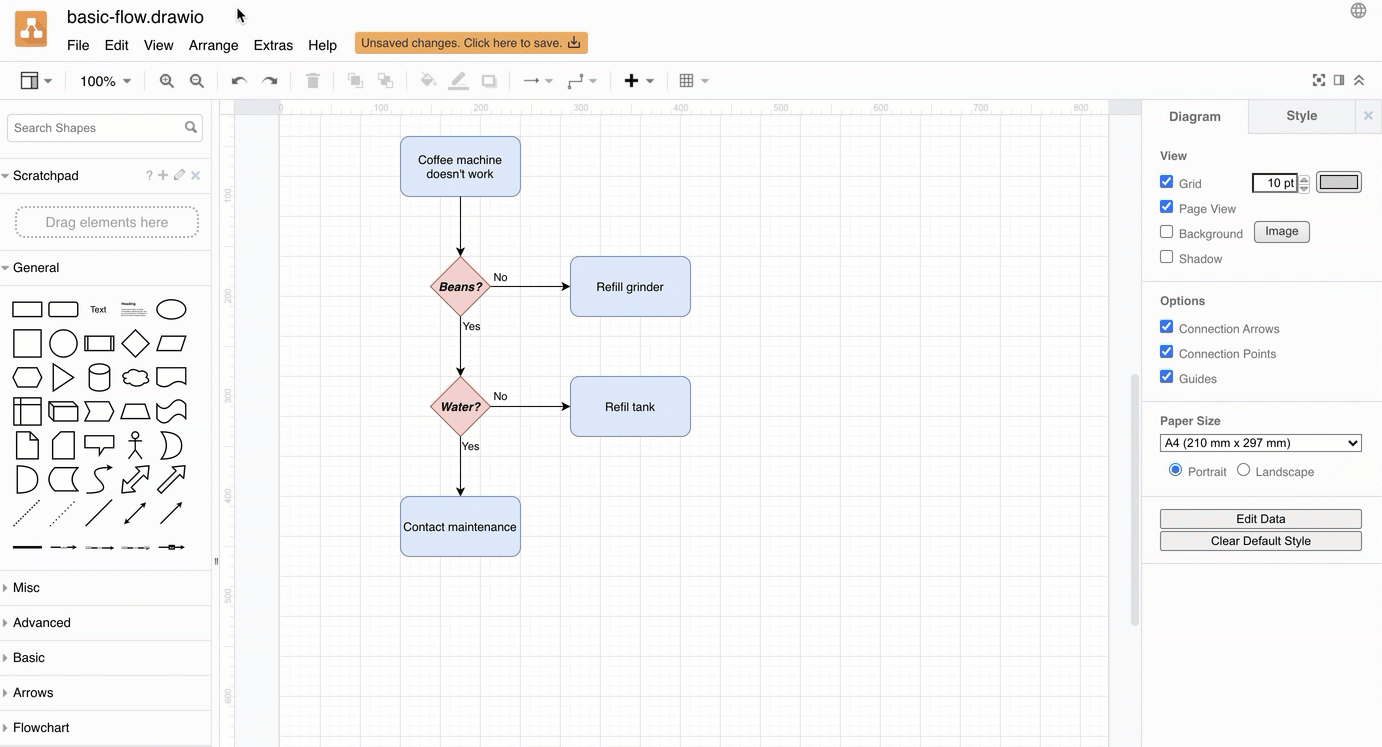
Draw a basic flow chart in draw.io
You can create many different types of diagrams with draw.io and our online diagram editor. To learn how to use the editor, let’s start with a basic flowchart to document a process.
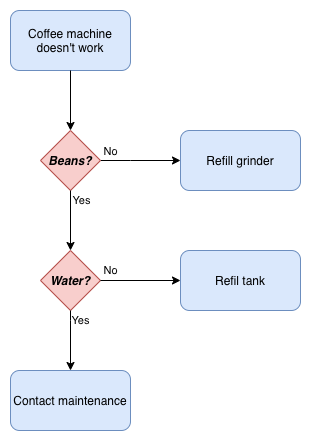
Flow charts let you visually describe a process or system. The shapes and very short labels let readers quickly understand what they need to do.


Tutorial: Create and style a basic flow chart to learn the draw.io editor.
- Create a new blank diagram
- Add shapes to the drawing canvas
- Move, resize, rotate, and delete shapes
- Connect shapes
- Add labels
- Style your flow chart
- Export and share your flow chart
Create a new blank diagram
- Go to the online draw.io editor.
- Click on Create New Diagram.
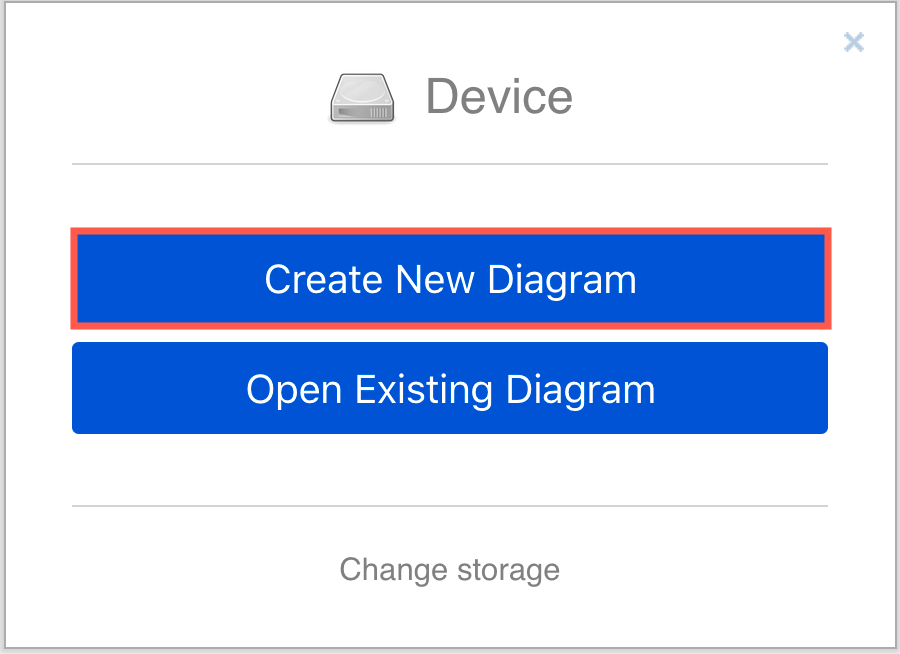
- In the template manager, enter a filename for your flow chart, ensure Blank Diagram is selected, then click Create.
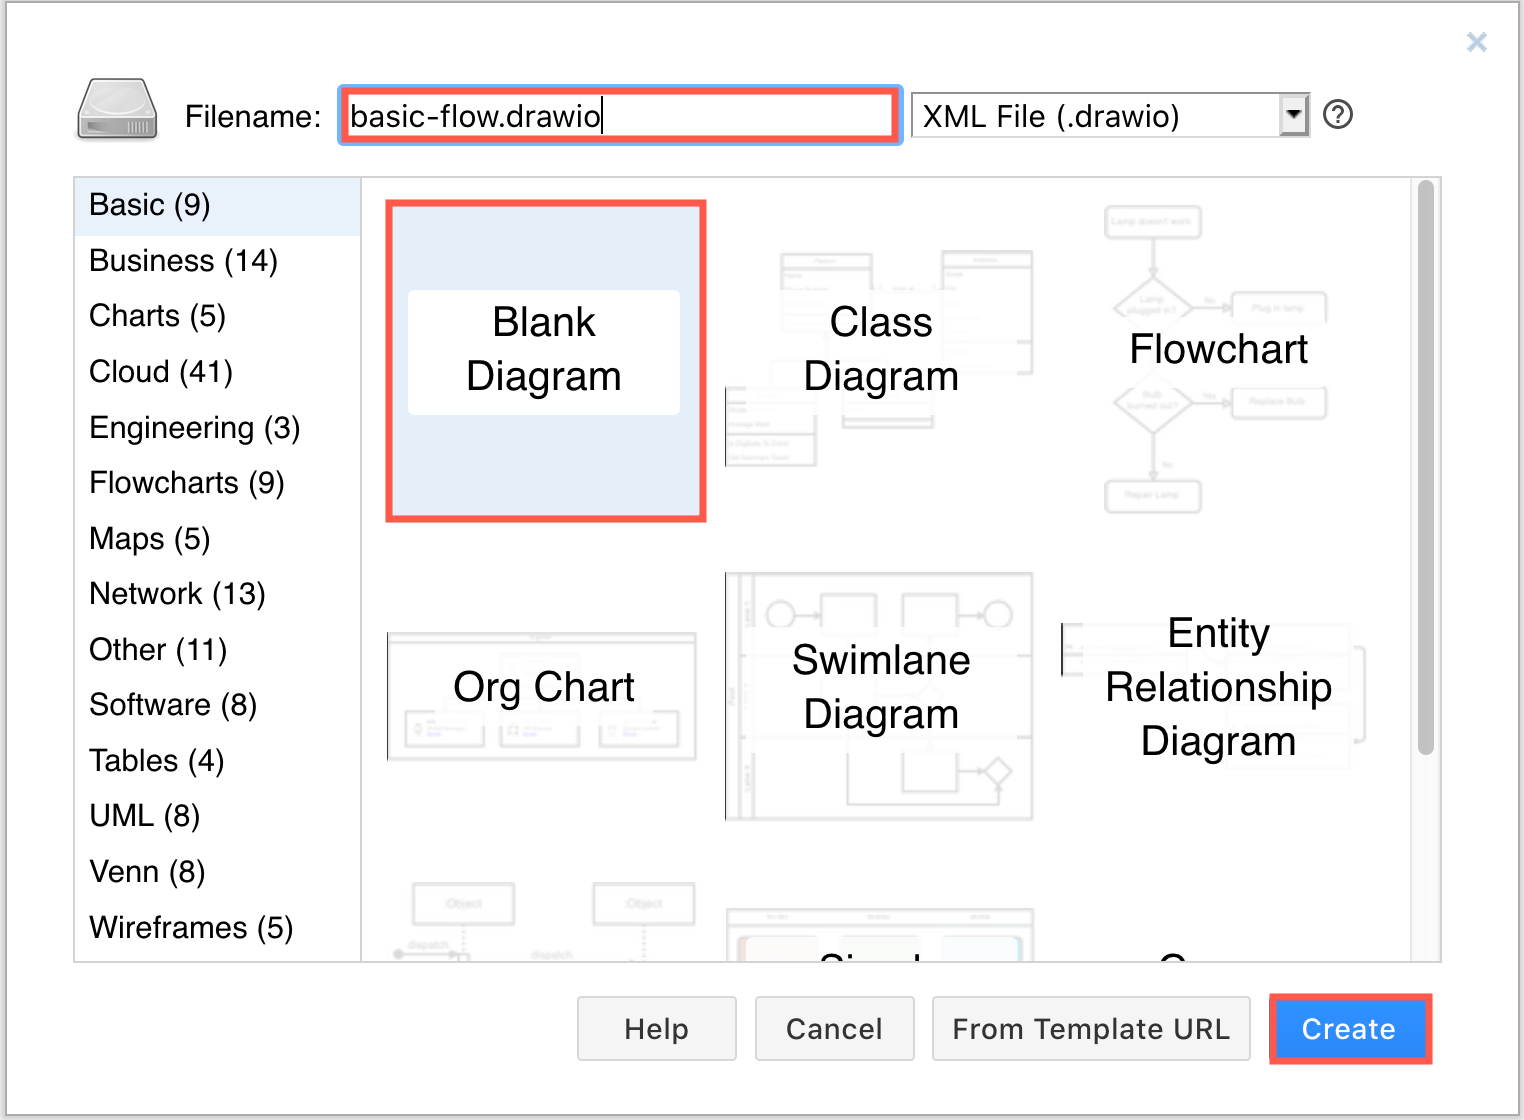
Tip: Click on Change storage first if you want to save your diagram to another location.
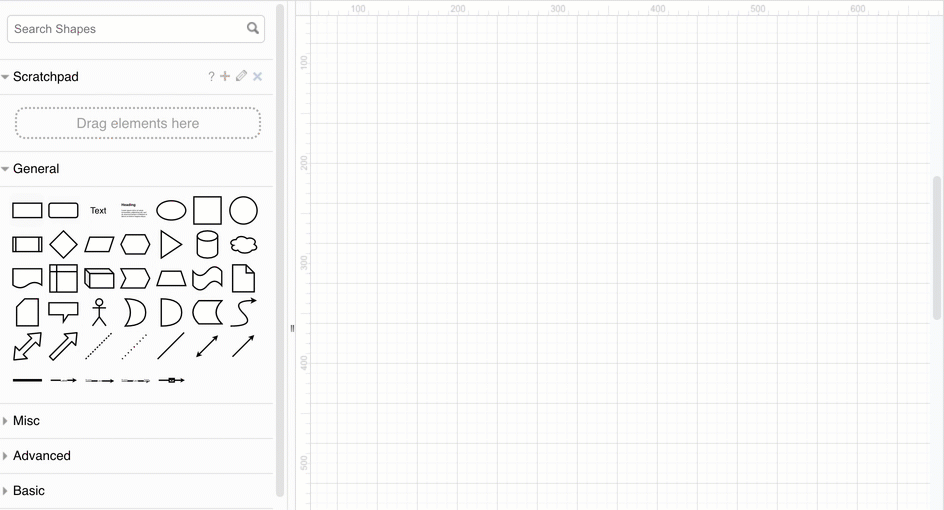
Add shapes to the drawing canvas
There are a number of different ways to add shapes to the drawing canvas in draw.io.
Add the first step - Use one of the following methods to add a rectangle to the drawing canvas. Rectangles represent the steps in your process.
- Click on a rectangle in the General shape library to add it the drawing canvas.
- Double-click on an empty area on the drawing canvas and select a rectangle shape.
- Drag a rectangle from the General shape library to a specific position on the drawing canvas.
Add more shapes - Use one of the following methods to add extra shapes to represent the next steps in your process.
- Hover over the first shape you placed to see the four direction arrows. Click on one of the shapes, then select a shape to add and connect it in that direction.
- Drag a shape from the shape library and hover over an existing shape until you can see the four direction arrows. Move over one of these direction arrows, and drop the shape you have dragged. It will be added to the drawing canvas and connected in that direction.
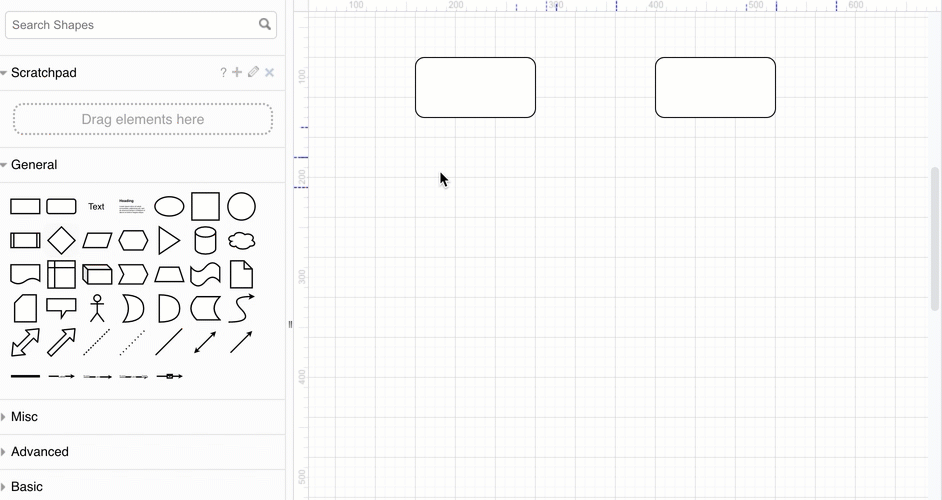
If you added multiple shapes by simply clicking on them in the shape library, you can connect them later. See how to connect shapes below.
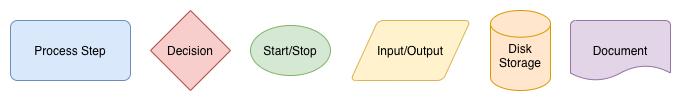
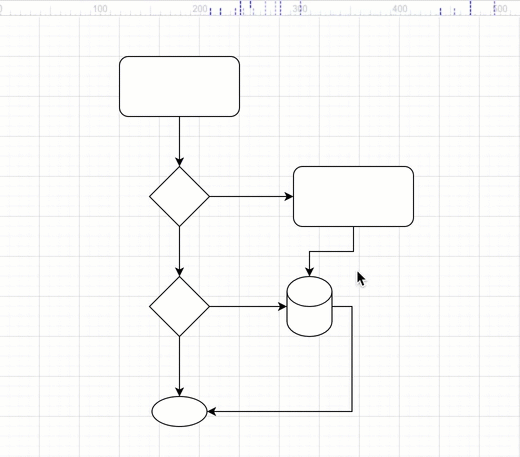
Shapes for flow charts
There are many different shapes used to visualise processes in a flow chart.
- Rectangle - Basic steps in your process.
- Diamond (rhombus) - Decisions, usually yes/no questions, that split the process into two or more branches.
- Circle or oval - Optional start and stop points in your process.
- Parallelogram - Input or output, where your process needs or gives information to an external party or system.
- Cylinder - Disk drives, used to indicate that data is stored during that step in the process.
- Rectangle with a wavy bottom line - Documents that are produced as a result of a process step.
In addition to the shapes in the General and Advanced shape libraries, you can use shapes from the Flowchart shape library.
- Click on More Shapes at the bottom of the left panel.
- Click on the checkbox next to the Flowchart shape library’s name to enable it.
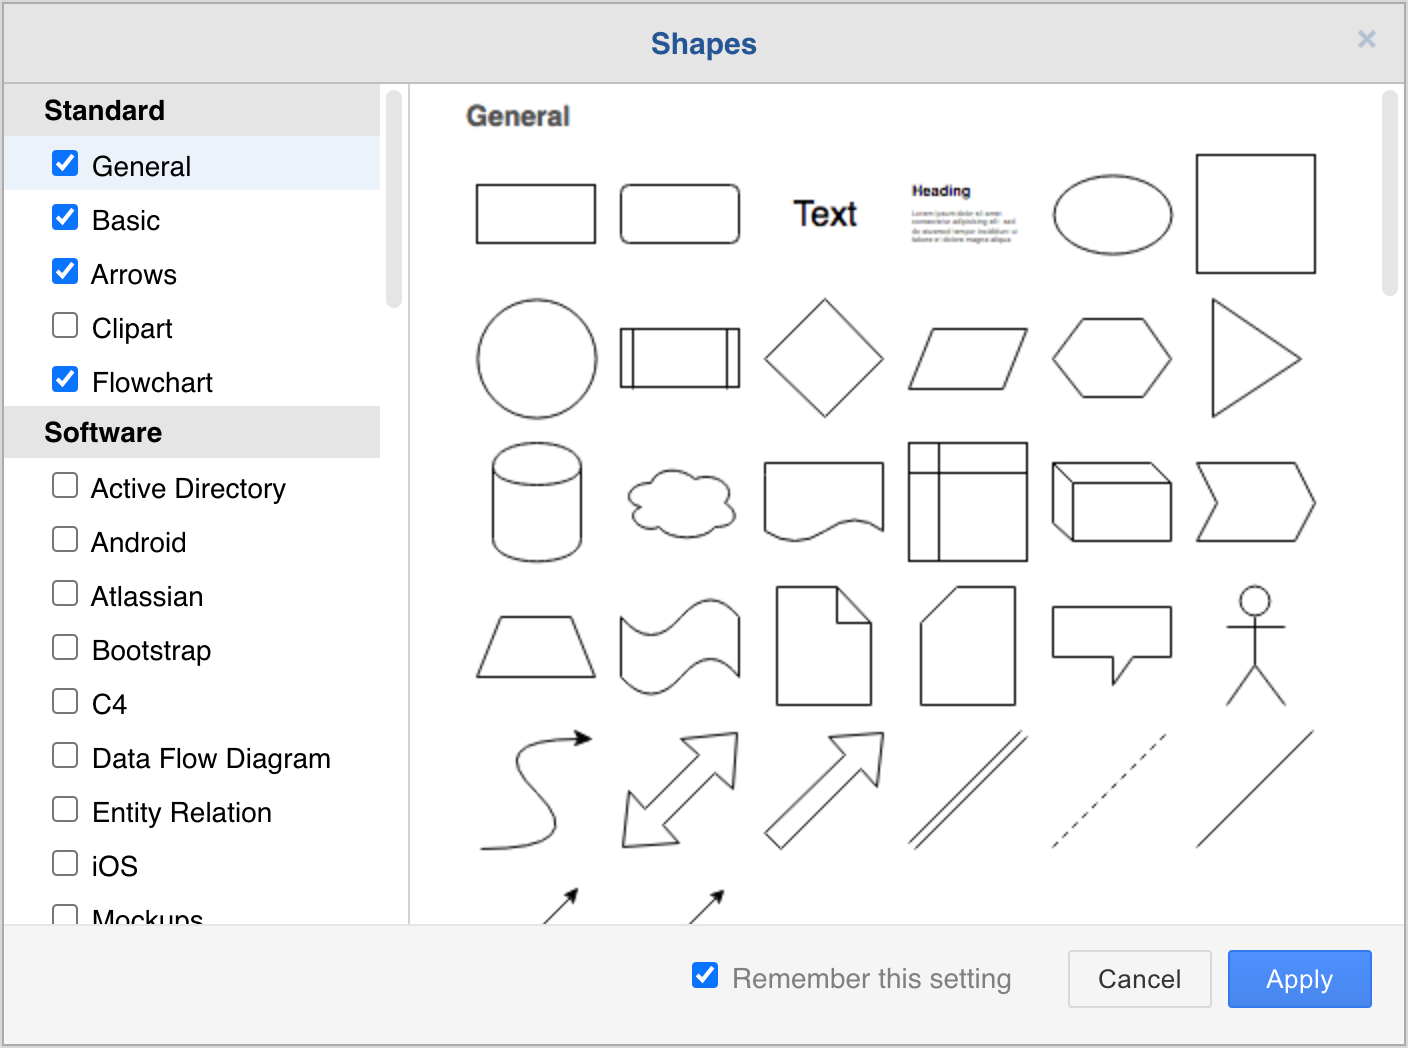
- Click Apply. The Flowchart shape library is now available in the left panel.
Move, resize, rotate, and delete shapes
To select a shape, click on it. To select multiple shapes, hold down Shift or Cmd and click on them.
Move - Select and drag a shape that is on the drawing canvas to another position.
Resize - Select a shape. Drag any of the round ‘grab’ handles to make the shape smaller or larger. Hold down Control when you resize shapes to keep them centred.
See how to resize groups of shapes
Rotate - Select a shape. Drag the rotate grab handle (the round arrow) at the top right corner of the shape to rotate the shape around its center point.
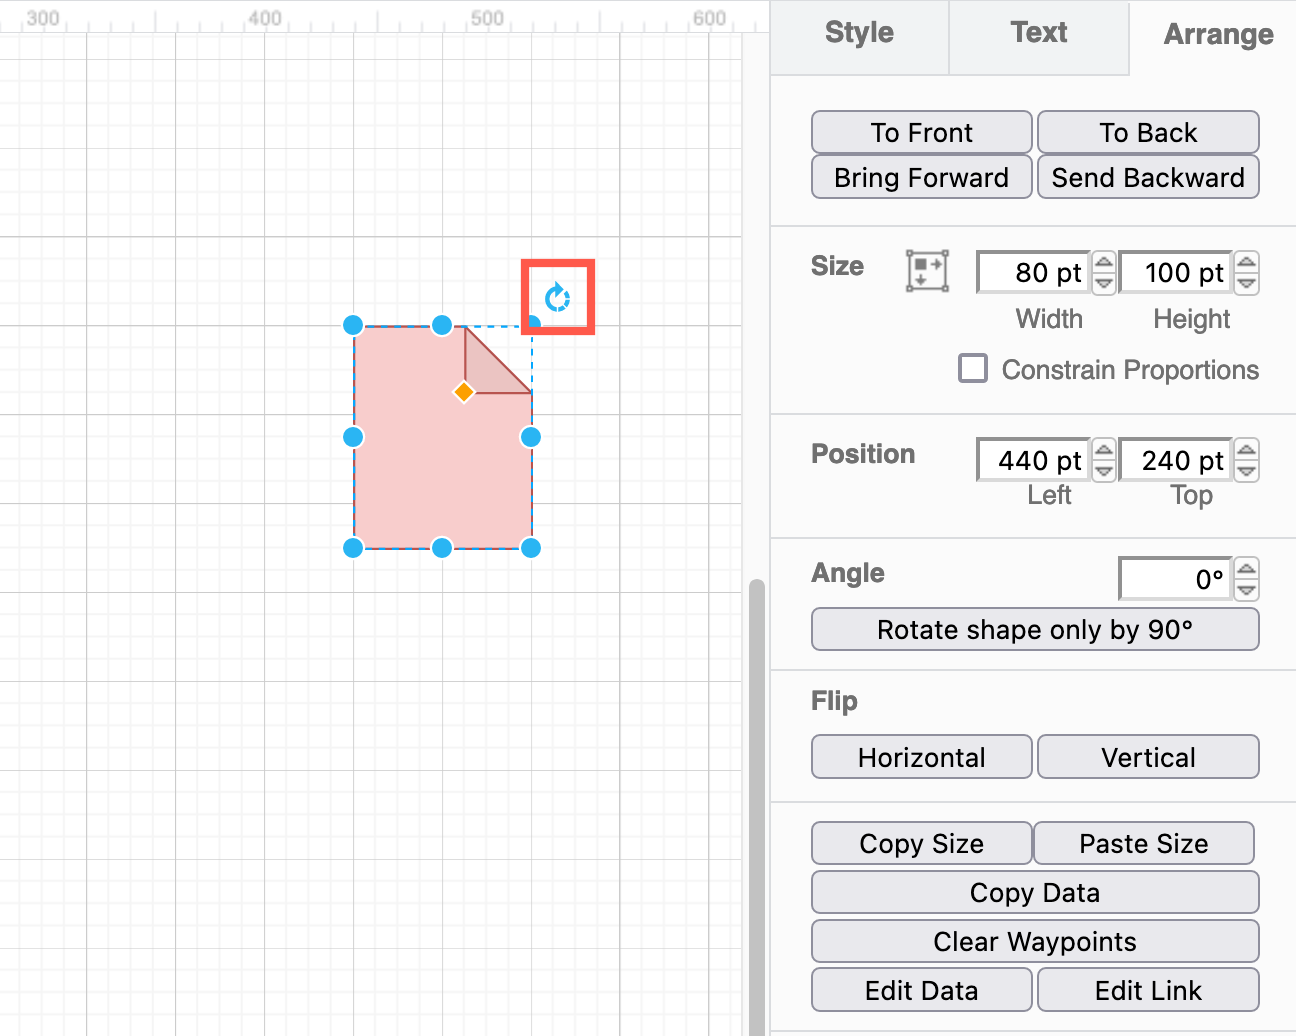
Delete - Select a shape, then press Backspace or Delete, or click on the Delete tool in the toolbar.
If one of the connectors, the arrows between the shapes, is going in the wrong direction, you can select and delete it, just like a shape. Follow the steps below to draw a new connector so it goes in the right direction.
Tip: Use the Arrange tab to precisely rotate, reposition and resize shapes
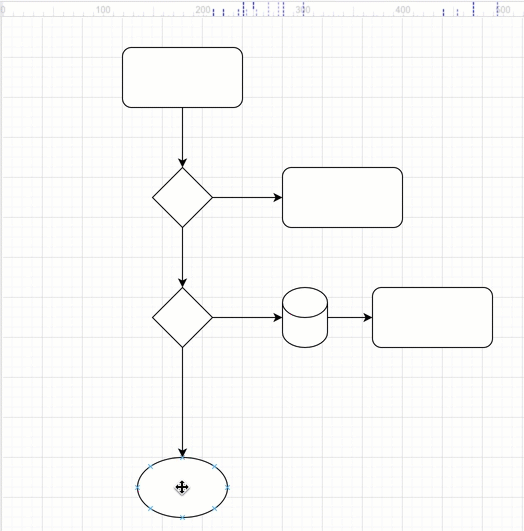
Connect shapes
Connectors are lines that connect your shapes together and may or may not have arrows at one or both ends. There are two types of connectors.
Floating connectors - These move around the perimeter of your shape as you move it around the drawing canvas, or change the route that the connector takes.
Fixed connectors - These stay attached to a fixed point on your shape, even when you move the shape around the drawing canvas.
Draw a floating connector
- Hover over the source shape until you see the light direction arrows appear.
- Move your mouse cursor over the direction arrow you want to draw the connector from, then drag the connector out from the arrow towards the target shape.
- Hover over the target shape and release when the outline of the shape is blue.
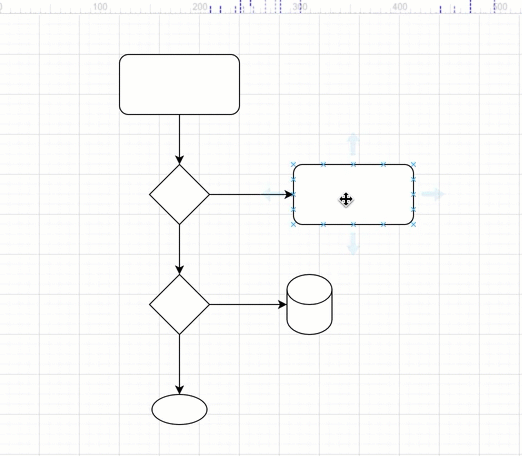
When you move the shape to a new position, the connector ends will automatically move around the shape to ensure the shortest distance.
Draw a fixed connector
- Hover over the source shape until you see the little crosses, connection points, around the shape perimeter.
- Drag a connector from the connection point on the source shape towards the target shape.
- Hover over the target shape until you see the connection points, then hover over one of the connection points until it is highlighted in green, and release to attach the connector.
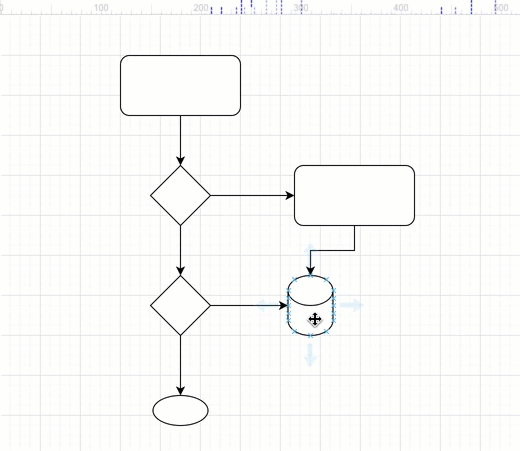
Now when you drag the shape around on the drawing canvas, the connector will remain attached to exactly those connection points.
Change the path of a connector
Waypoints are shown as small circles on a selected connector. They are used to define the path that a connector takes across the drawing canvas.
- Select the connector that you want to change the path of to see its waypoints.
- Drag one of the waypoints into a new position. New waypoints will be added automatically based on where you grabbed the connector and where you move your mouse too.
If it is a floating connector, the end closest to the waypoints you moved will ‘float’ around the perimeter of your shape. If it is a fixed connector, the end will remain attached to that specific connection point.
You can add and remove waypoints to make connectors follow complex paths.
Learn more about working with and styling connectors
Add labels
Short labels on shapes make it easier to understand a diagram quickly.
- Double click on a shape. Start typing to replace the label with your own text. Alternatively, single click on a shape and start typing to add or edit the label.
- Press
Enterto save the label text.
Tip: Press Shift+Enter to add a line break in a label.
Connector labels
You can add more than one label to a connector - at the source end, the target end, and in the middle.
- Double click in the position you want to add a text label there.
- To reposition the connector label text, click on the label, then drag the small yellow diamond to a new position.
If you reroute the connector, you may need to update any labels you had manually positioned, but usually the label will move intelligently with the connector.
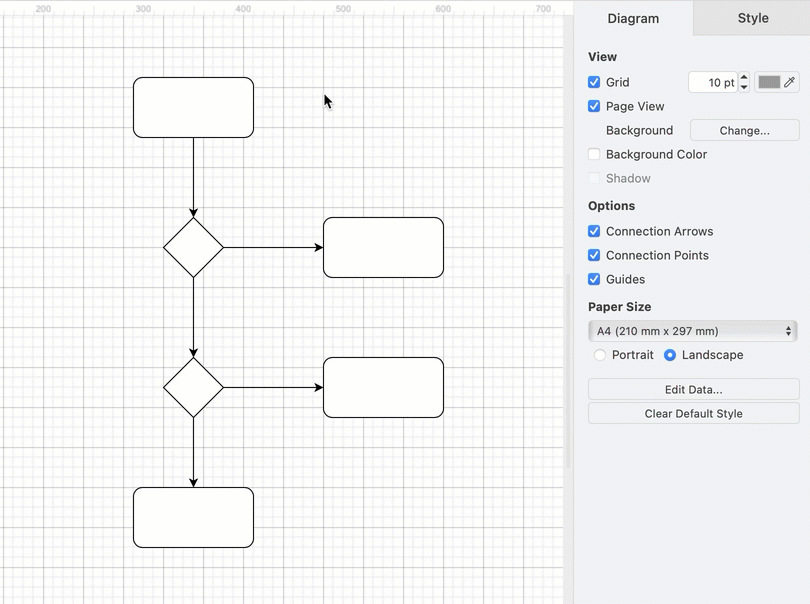
Style your flow chart
Once you have finished adding all the shapes, connectors and labels, you can style your flow chart.
- Select a shape, or hold
Shiftdown and click on multiple shapes and connectors to select many.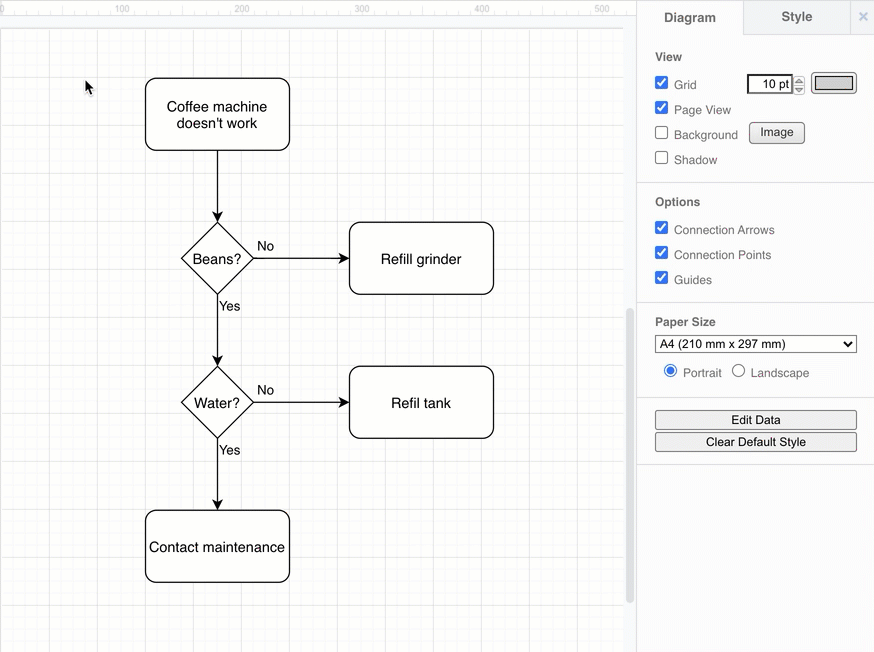
- Add colours and style your shapes and connectors via the Style tab.
- The style palette at the top of the Style tab changes both the fill and outline colour. Click the left or right arrows to view more styles.
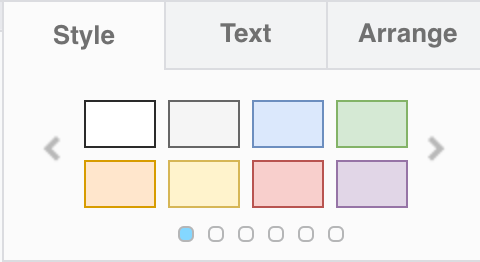
- To set your own colour, click on the colour button next to Fill or Line, select a new colour or enter a hex colour code in the top text field.
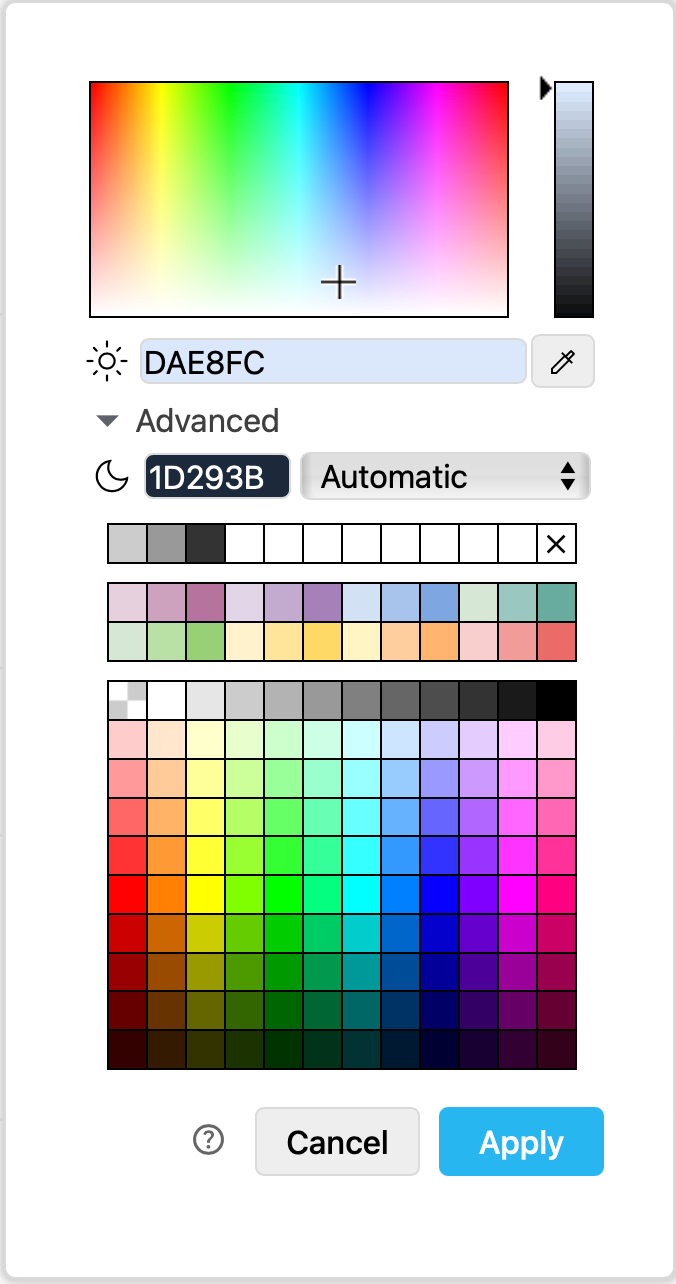
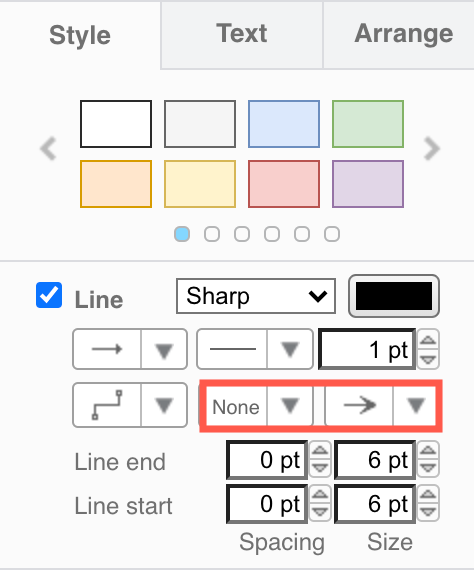
Tip: Learn about adaptive colours and diagramming in dark mode. - Style a selected connector to have arrows on both ends or no arrows.
- The style palette at the top of the Style tab changes both the fill and outline colour. Click the left or right arrows to view more styles.
- Change the text style of labels on the Text tab.
- Select a different Font from the list.
- Add Bold, Italics, or Underline.
- Change the justification to be left, right or centred.
- Click on the colour button next to Font Color.
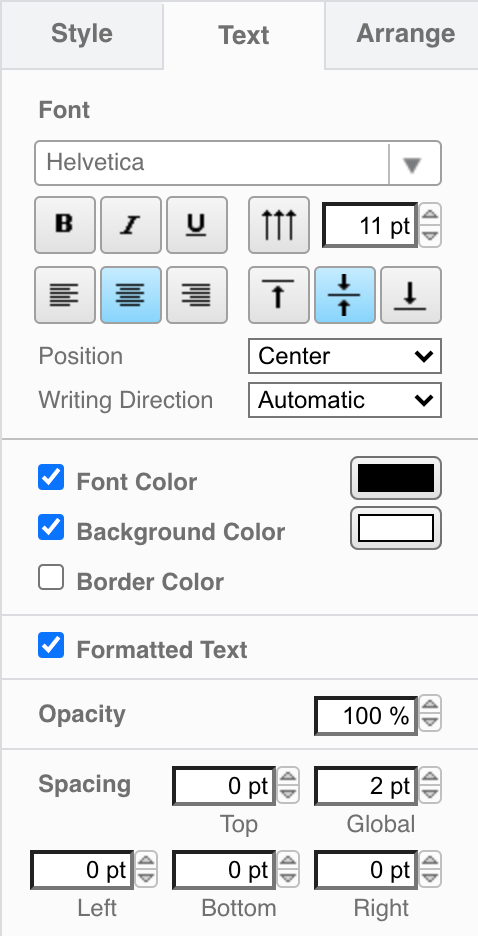
Tip: When you edit the text itself, you will see additional HTML formatting - add a numbered or bulleted list, indent your text, use superscript or subscript text and more.
Export and share your flow chart
You can share your diagram in a number of different ways via the File > Export as menu. The most common export formats are as images or as a URL.
- Export as a PNG, JPEG or SVG to convert your diagram to an image that you can paste into a website or email.
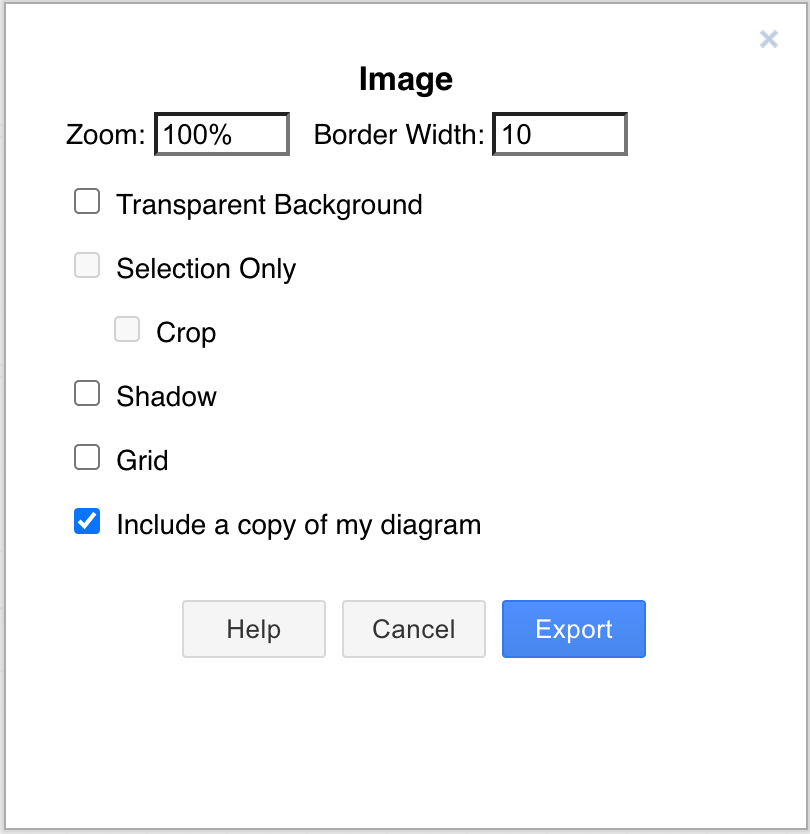
- Export as a URL to encode your entire diagram in a URL. When you share this (very long) URL, the person viewing the diagram will see a copy - they don’t open or edit your original diagram.