How to create data flow diagrams in draw.io
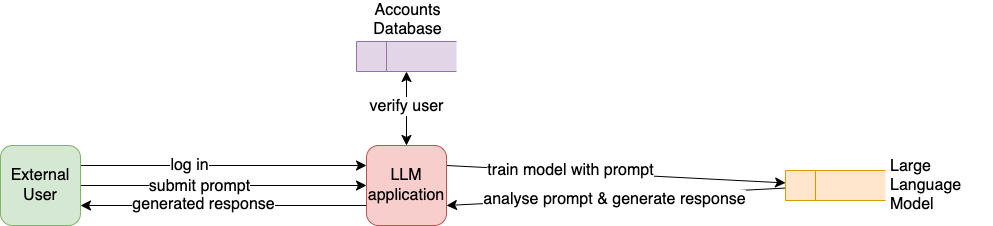
Data flow diagrams (DFDs) are common diagrams used in structured analyses and data modelling to document the data flows between entities, processes and data stores. For example, the following DFD documents the main data flows in a large language model that allows user queries such as ChatGPT.
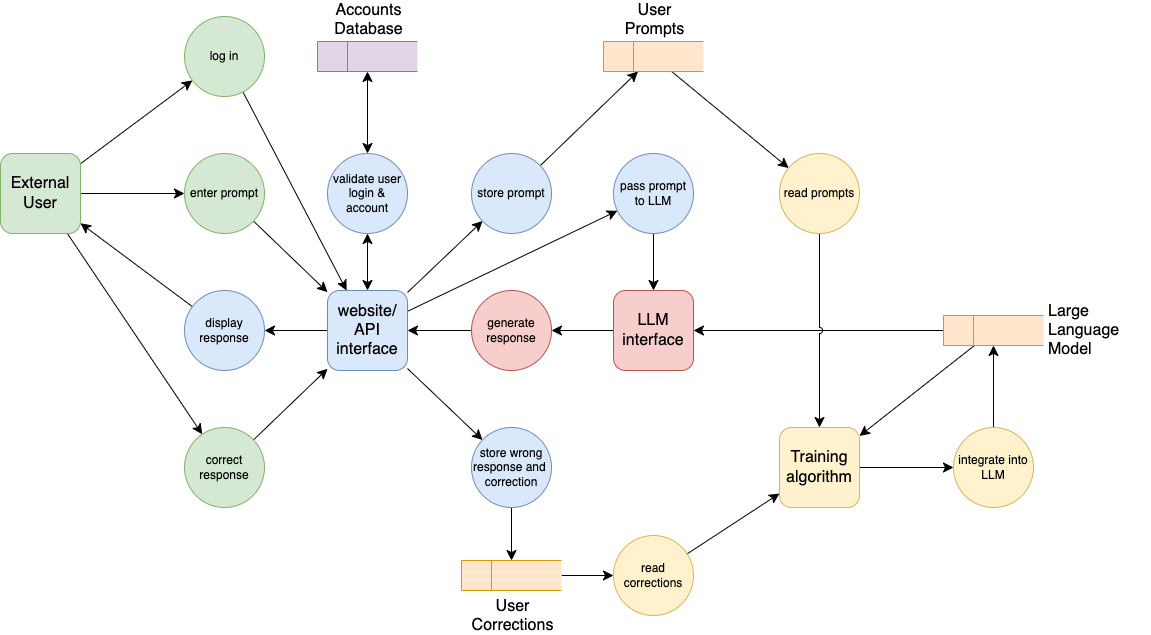
Instead showing the flow of control as a typical flowchart would, the connector arrows indicate only that data is passed between the components of the system.
Data flow diagram components
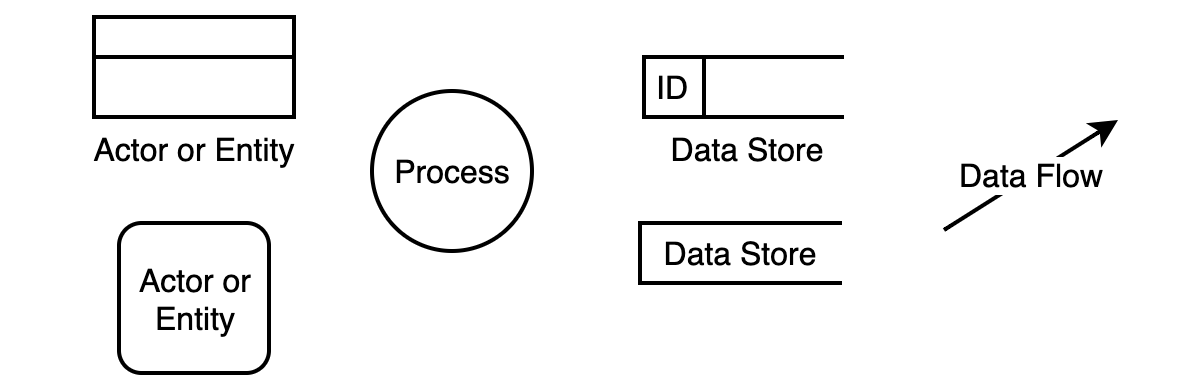
There are four core components to a data flow diagram.
- User, object or entity (terminator): Typically a square or rectangle.
- Process: Usually a circle. Sometimes processes are written directly on the connectors with a text label instead.
- Data store (warehouse): An open-sided rectangle, sometimes with an ID box at the closed end.
- Data flow: A connector with arrows at one or both ends.
Note: Data flow diagrams do not typically include decision rules (diamonds) like process control flowcharts would.
DFDs complement UML diagrams, allowing a higher level abstract view of how data moves through a system, but without providing any implementation details.
You can choose to add additional information to your DFDs. Below, we’ve extended our example to include a dotted connector to show relationships between the data stores. All entries have a unique identification number referred to by an entry in another data store which allows for comprehensive data tracking.

Data Flow Diagram shape library in draw.io
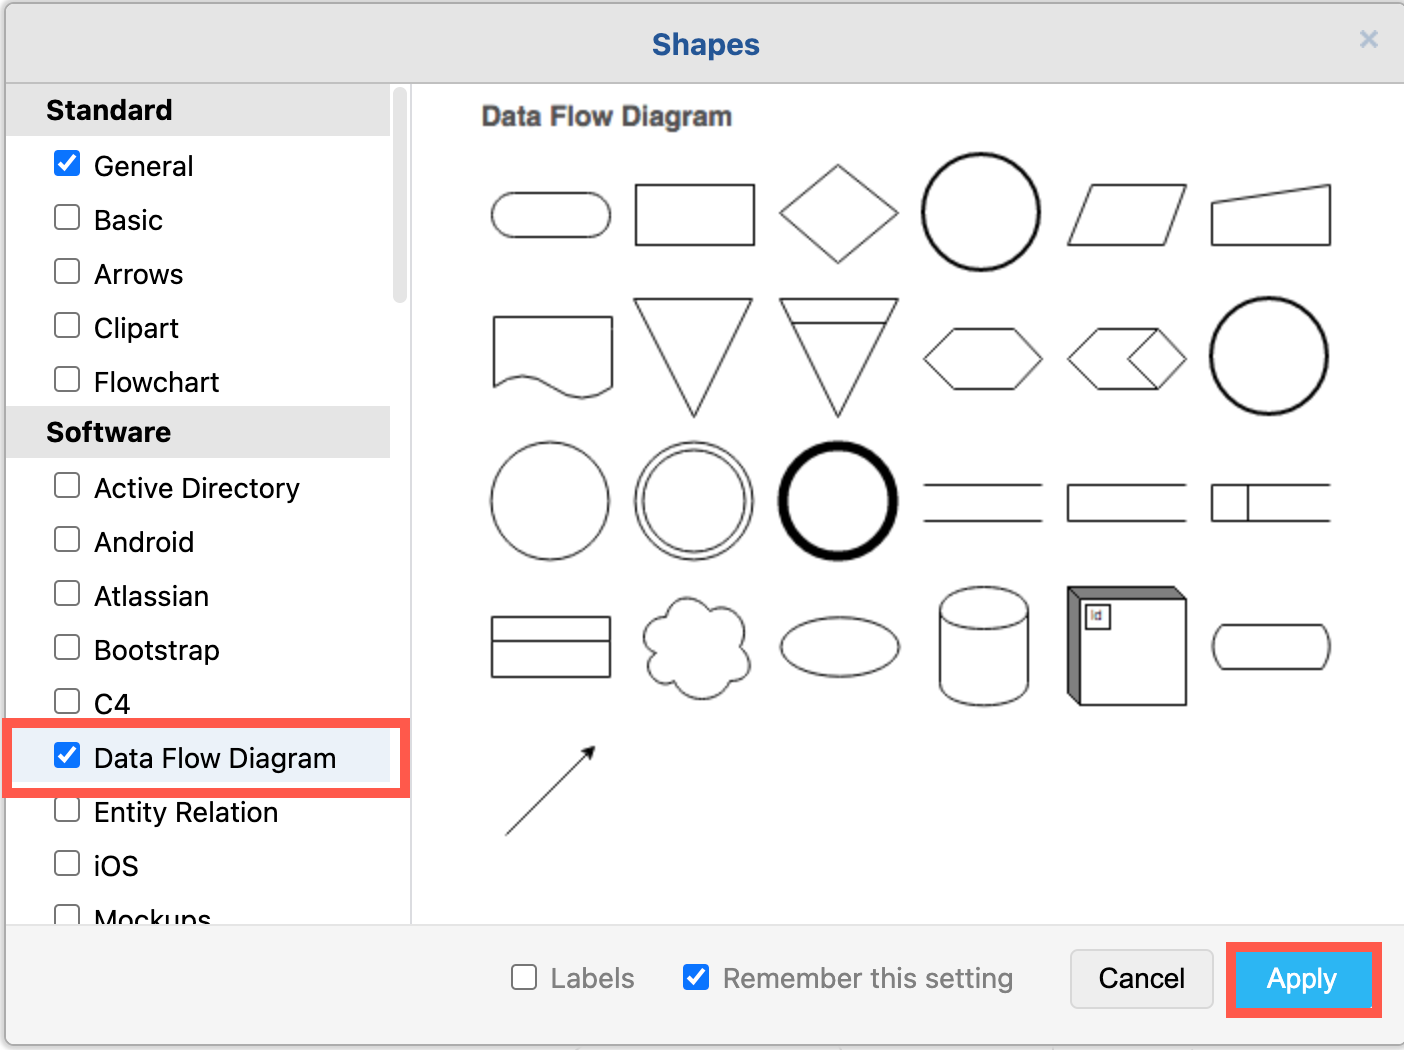
You aren’t limited to just these shapes. draw.io’s Data Flow Diagram shape library includes all the core shapes, and several others that you may find useful.
Click on More Shapes, select Data Flow Diagrams in the Software section and click Apply to open that shape library.
If you don’t want to open the shape library, use the square and circle shapes from the General shape library, and search for data store.
Data flow diagram templates
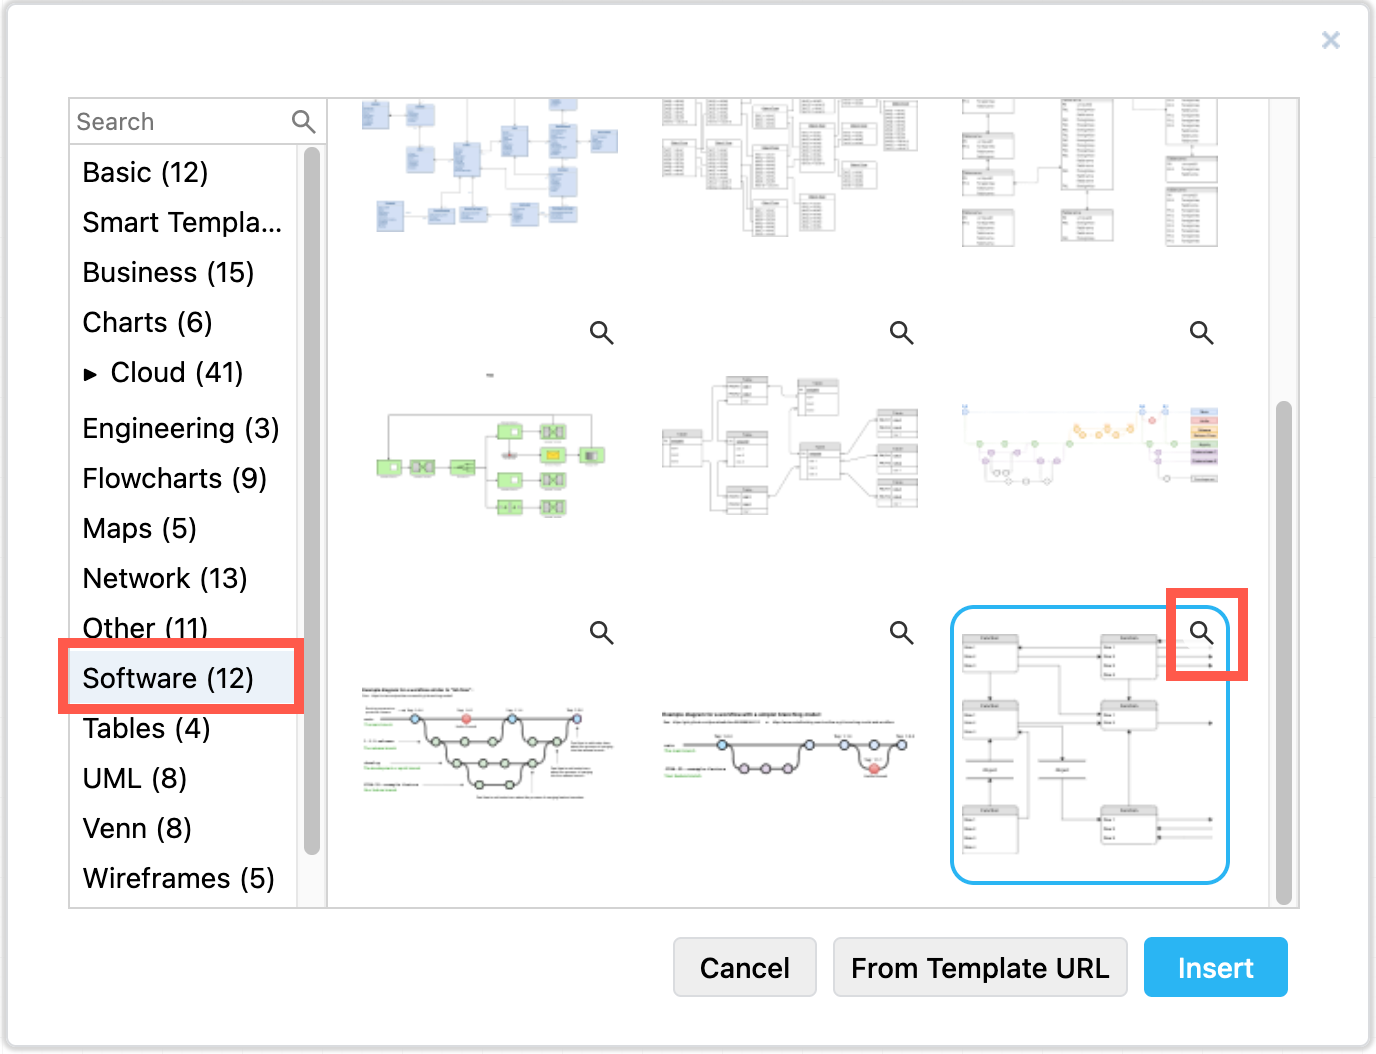
One data flow diagram template is available in the draw.io template library in the Software section.
- Select Arrange > Insert > Template from the draw.io menu or the Template tool in the Sketch editor theme to open the template manager.
- Go to the Software section, scroll to the end and select the Data flow 1 template, then click Insert to add it to the drawing canvas.
For more data flow examples, please see our drawio-diagrams Github repository.
Show hierarchy in data flow diagrams
You can draw data flow diagrams with varying levels of details. This ‘hierarchy’ provides both an abstract view of the system, and detailed data flows that are useful when implementing the system.
For example, a level 0 DFD (context diagram) of the data flow diagram example above could be simplified as follows. The process circles have been replaced with labels on the connectors.
Several processes have now been omitted, and only the most important and integral data flows are drawn.
Add links to other diagrams
You can number the processes in a DFD, to allow easier references to other diagrams when diagramming processes in detail.
In draw.io, instead of numbering the processes, link to other pages in your multi-page diagram where those processes are documented, or the process diagrams hosted elsewhere in Confluence, your cloud storage location or the Notion page where the process is documented.
Tip: Add links between the hierarchies of DFDs in a multi-page diagram to make navigating and understanding the diagrams much easier.
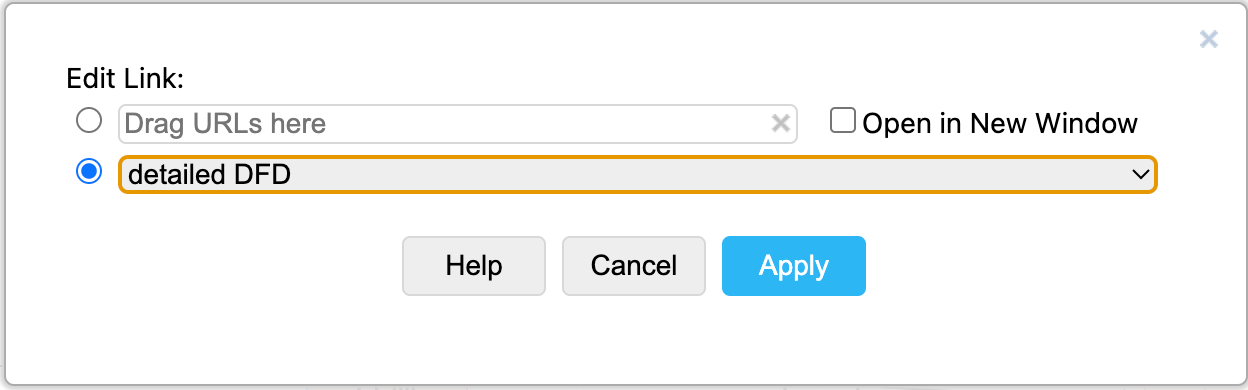
- Right click on a shape to see the context menu, select Edit link. Alternatively, select the shape and press
Alt+Shift+L.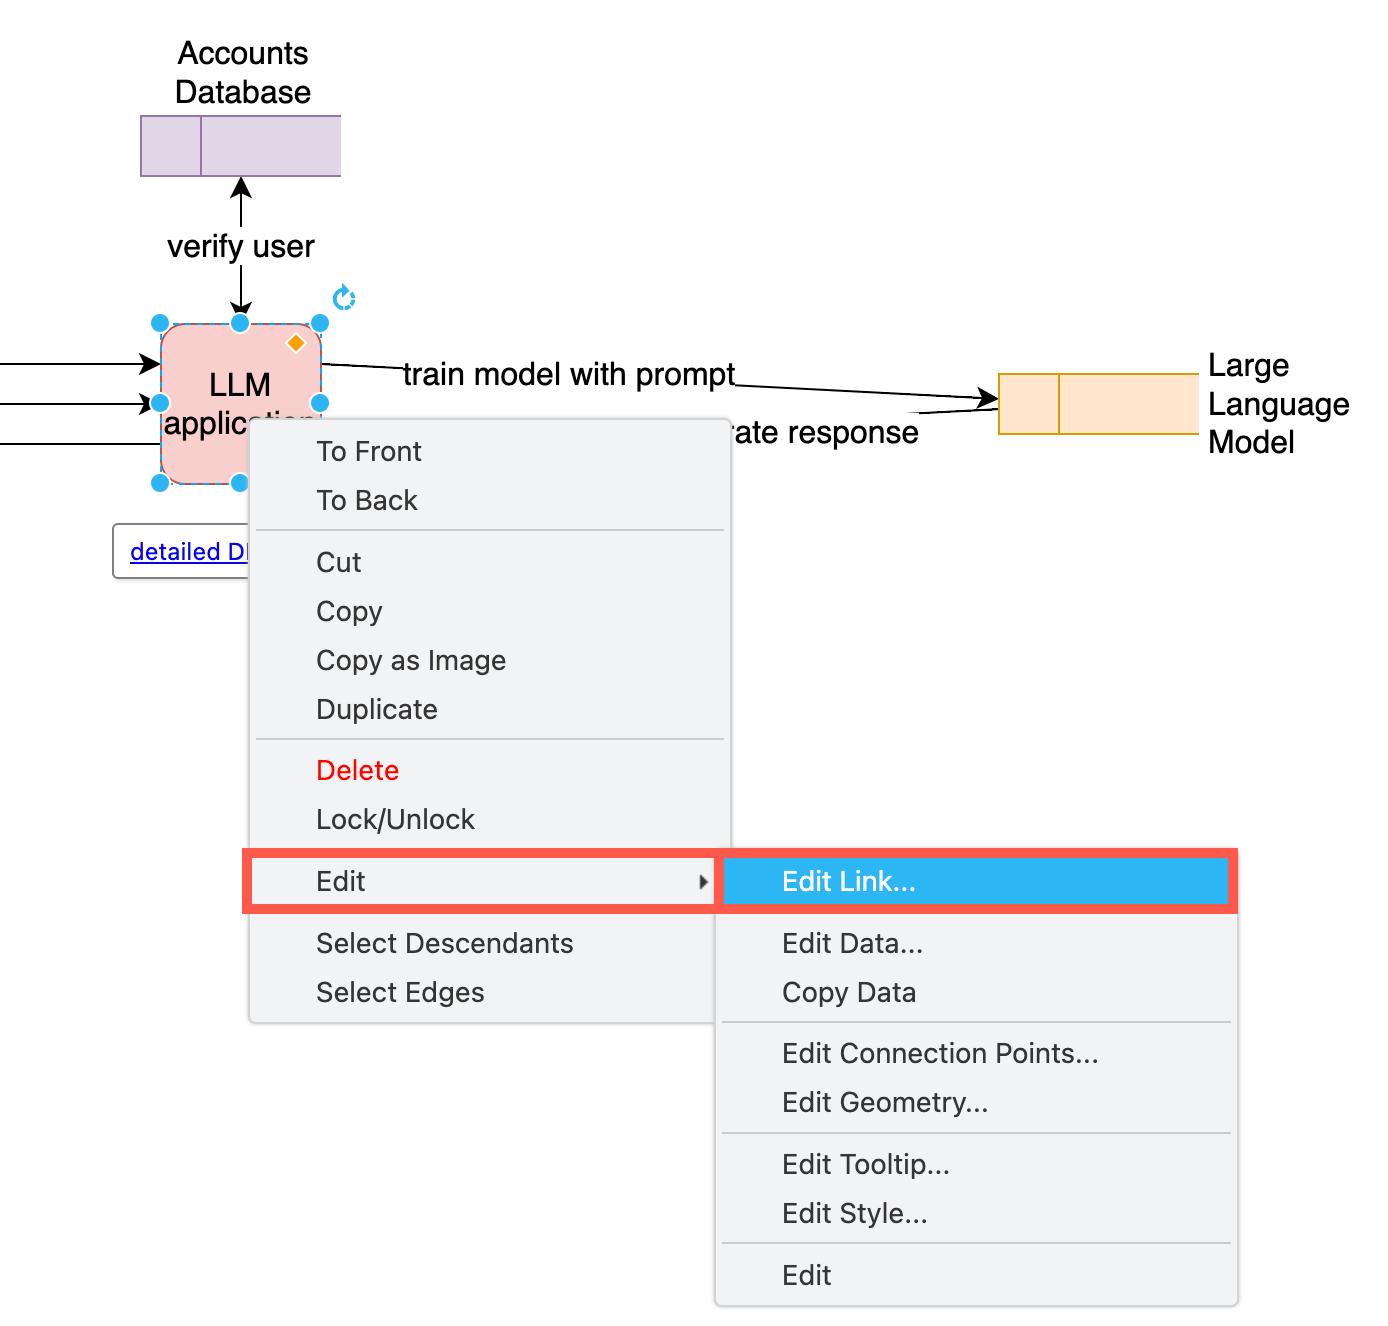
- Select another page in your diagram or add a link to where it the process documentation is stored.