Insert a diagram from specially formatted CSV data
You can create a diagram automatically from a combination of formatting information and CSV data from a spreadsheet. This may be practical when working with spreadsheet models of various types of data (org charts, attack trees, process flows), or CSV files exported from other programs, for example, modeled network topologies or software dependencies.
The text script you insert when you click Arrange > Insert > Advanced > CSV is in two parts. The first part, with a # at the start of each line, contains the formatting information that tells draw.io how to draw each shape, how to connect them together and what styles the shapes and connectors should use. The second part contains the comma delimited (CSV) data.
Quick introduction
- Each shape is represented by one line in the CSV data.
- Use column headings to use the data in that cell, like you would a variable in a program, by surrounding the name in percentage characters:
%column1% - Columns can contain label text, metadata, styling information, or simply be ignored.
- The online CSV viewer tool takes a URL to a CSV file and formatting information to test the import outside of the editor.
- To break a formatting line for readability, add a backslash character
\at the end of the line.
Useful formatting commands
There are several important formatting commands, explained below.
## Comments - Lines that start with two hash characters are ignored.
# label: %column1% - Use data from one or more columns as labels. For example, to combine data from the name, and position columns and format it with HTML: # label: %name%<br /><i style="color:gray;">%position%</i>
# connect: {"from":"column_1", "to":"column_2", "style": "..."} - Define which columns contain the target and source data for connectors and their style. Multiple connector styles need multiple connect statements.
# connect: {"from": "column1", "to": "column2", "invert": true, \
# "label": "label1", "style": "curved=1; endArrow=blockThin; endFill=1;"}
# connect: {"from": "column3", "to": "column1", "style": "curved=1;"}
# ignore: column1,column2 - Any columns that you don't ignore here, are added to the shape as metadata.
# layout: auto - Select one of the options available via Arrange > Layout.
# style: whiteSpace=wrap;html=1;fillColor=#aa8899;strokeColor=%stroke%; - Define the shape style. Use a fixed hex colour code, or a hex value from in a column in the CSV data.
Tip: To discover the style of an existing shape, select it, then press Ctrl+E on Windows or Cmd+E on macOS.
- Instead of using a single style for all shapes, you can define a multiple styles for different groups of shapes in a column in the CSV data. For example, to define two styles.
# stylename: column1# styles: {"column1-style1": "rhombus;fillColor=#dae8fc;", \# "column1-style2": "ellipse;fillColor=#d5e8d4;"}
Defining multiple connector styles in the CSV data works similarly.
See the comments in the following examples stored on GitHub for more information on the available formatting commands.
The comma delimited data is added after all the formatting information without a hash character at the beginning of each line. The first line is the column headings that you can use as variables in formatting commands.
Import a diagram from CSV
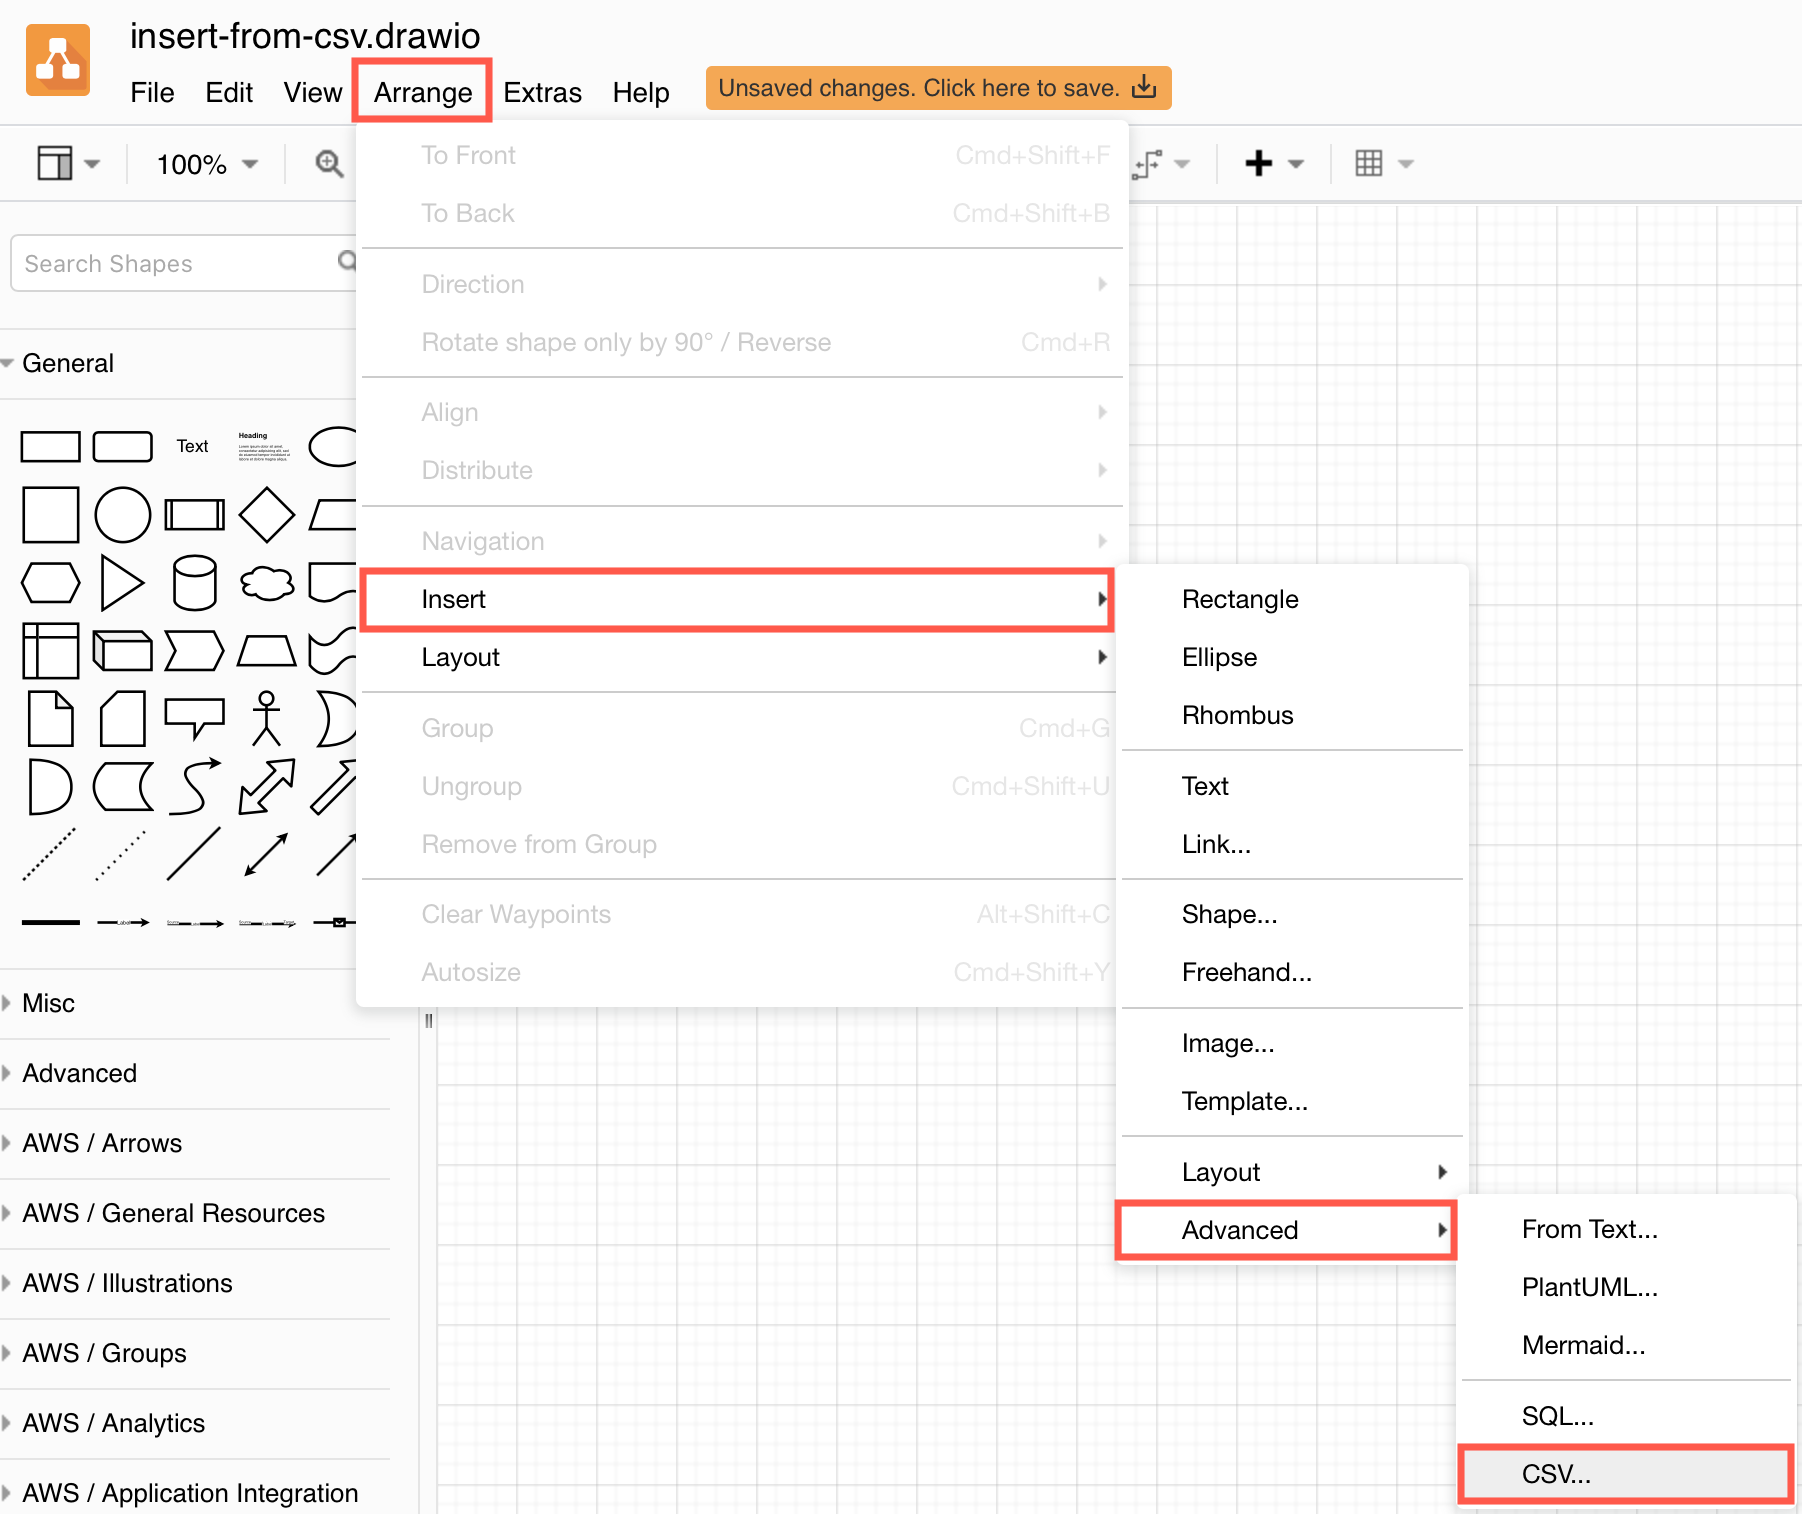
- Select Arrange > Insert > Advanced > CSV.
- Paste your formatting information and CSV data into the large text field, overwriting the example.
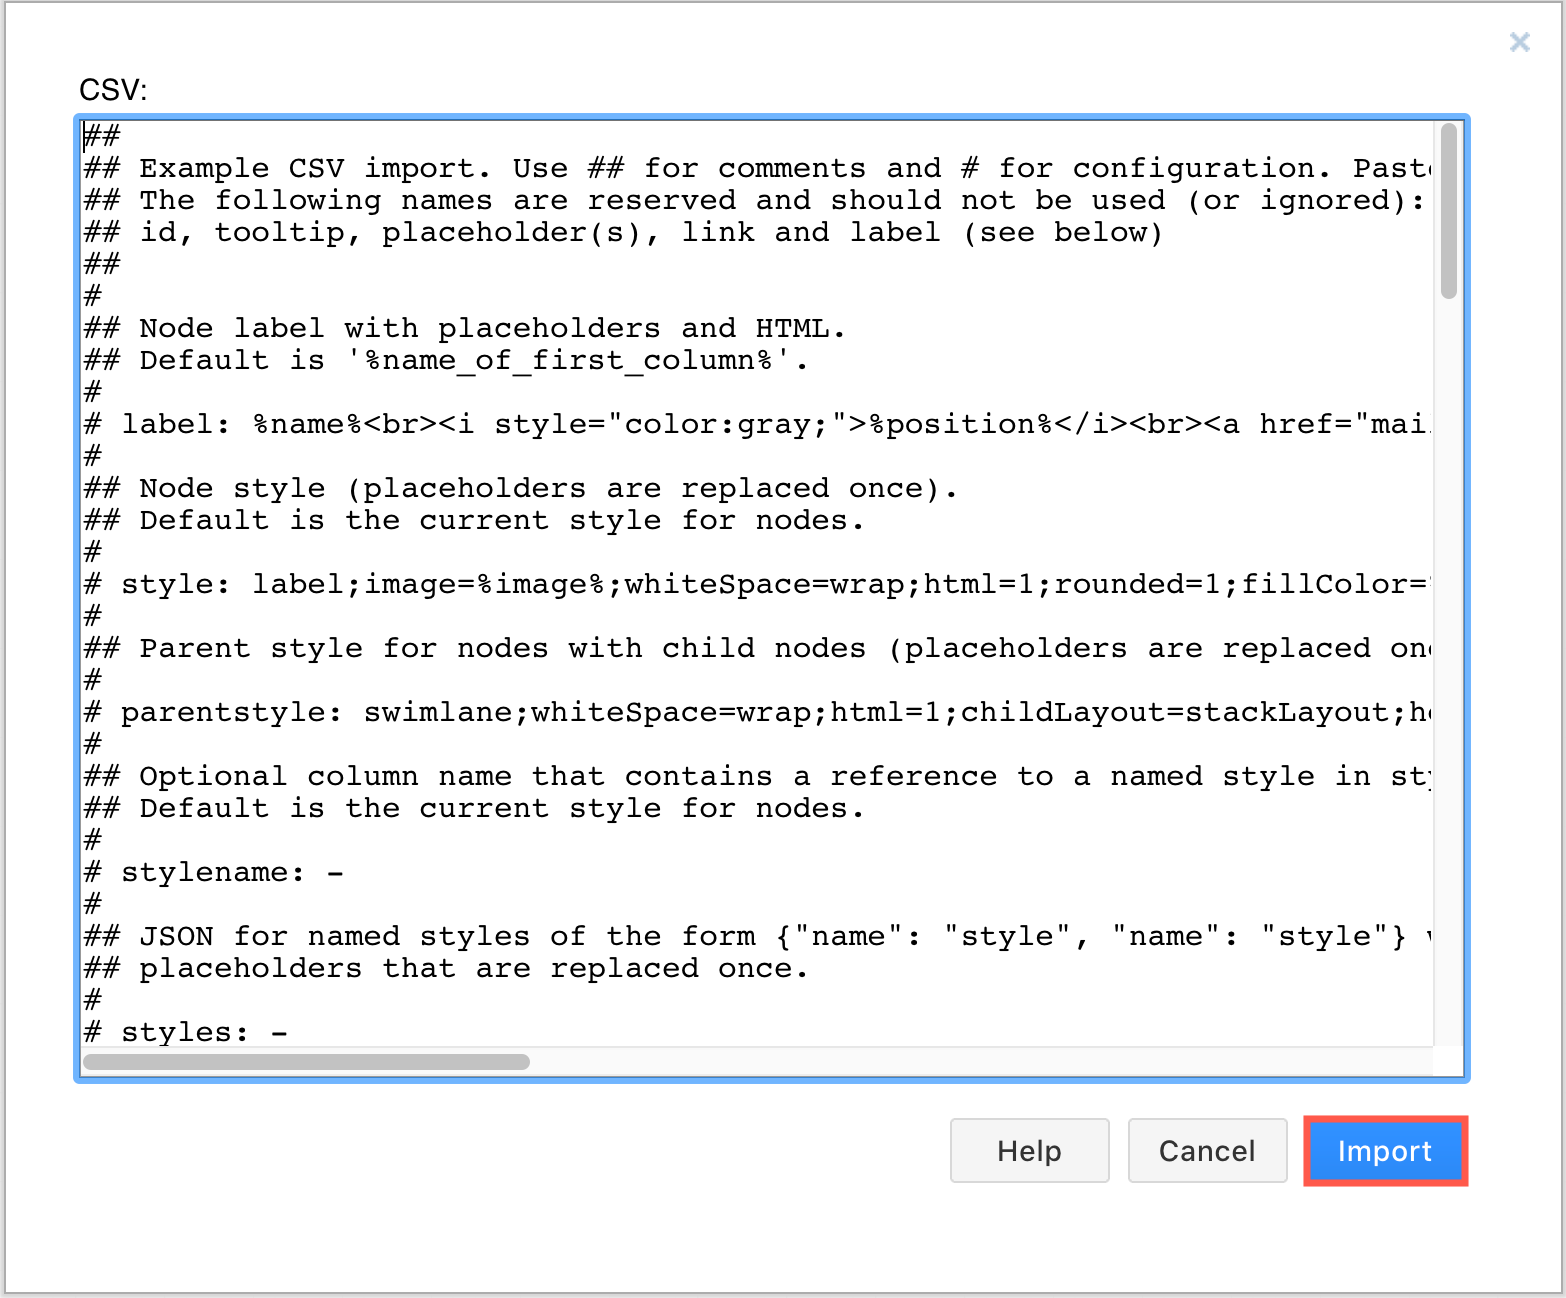
- Click Import to generate and insert your diagram on the drawing canvas.
Note: If your formatting information or CSV file contains errors, you may see unexpected formatting or diagram structures. The CSV dialog will remember what you last imported to make it easier for you to debug and fix any problems.
See how to embed a diagram in Confluence Data Center and Server from CSV data stored at a public URL
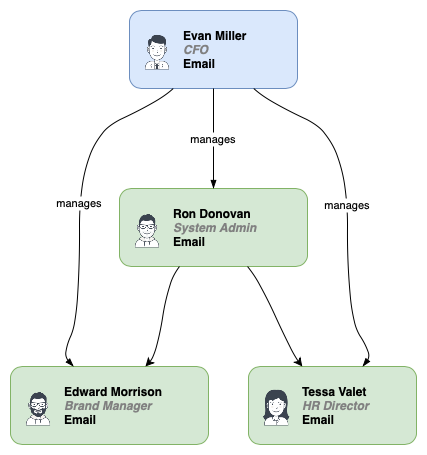
Org chart example from CSV
The example script you see when you first select Arrange > Insert > Advanced > CSV is of an organisation chart, with two different connector styles, HTML labels with linked email addresses, and two different shape styles.
Open this org chart in our online diagram viewer
Taking out the inline help from the example, the script would look like as follows:
# label: %name%<br /><i style="color:gray;">%position%</i><br /><a href="mailto:%email%">Email</a>
#
# style: label;image=%image%;whiteSpace=wrap;html=1;rounded=1; fillColor=%fill%;strokeColor=%stroke%;
# parentstyle: swimlane;whiteSpace=wrap;html=1;childLayout=stackLayout;horizontal=1;horizontalStack=0;resizeParent=1;resizeLast=0;collapsible=1;
#
# namespace: csvimport-
#
# connect: {"from": "manager", "to": "name", "invert": true, "label": "manages", "style": "curved=1;endArrow=blockThin;endFill=1;fontSize=11;"}
# connect: {"from": "refs", "to": "id", "style": "curved=1;fontSize=11;"}
#
## Node width and height, and padding for autosize
# width: auto
# height: auto
# padding: -12
#
# ignore: id,image,fill,stroke,refs,manager
#
## Column to be renamed to link attribute (used as link).
# link: url
#
## Spacing between nodes, heirarchical levels and parallel connections.
# nodespacing: 40
# levelspacing: 100
# edgespacing: 40
#
# layout: auto
#
## ---- CSV below this line. First line are column names. ----
name,position,id,location,manager,email,fill,stroke,refs,url,image
Tessa Miller,CFO,emi,Office 1,,[email protected],#dae8fc,#6c8ebf,,https://www.draw.io,https://cdn3.iconfinder.com/data/icons/user-avatars-1/512/users-3-128.png
Edward Morrison,Brand Manager,emo,Office 2,Tessa Miller,[email protected],#d5e8d4,#82b366,,https://www.draw.io,https://cdn3.iconfinder.com/data/icons/user-avatars-1/512/users-10-3-128.png
Alison Donovan,System Admin,rdo,Office 3,Tessa Miller,[email protected],#d5e8d4,#82b366,"emo,tva",https://www.draw.io,https://cdn3.iconfinder.com/data/icons/user-avatars-1/512/users-2-128.png
Evan Valet,HR Director,tva,Office 4,Tessa Miller,[email protected],#d5e8d4,#82b366,,https://www.draw.io,https://cdn3.iconfinder.com/data/icons/user-avatars-1/512/users-9-2-128.png
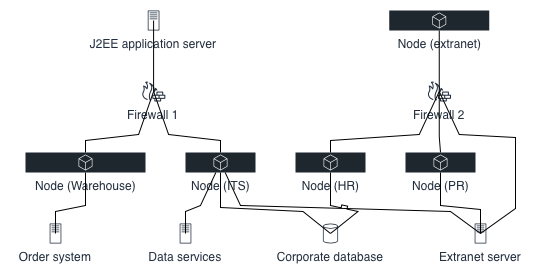
Network topology from CSV data
As the draw.io editor automatically works out the layout and connector routing, your diagram may not be as 'pretty' as if it were designed manually by hand.
This network topology example uses four different shapes from the AWS-19 shape library. Edit the shape style to discover the shapename of any shape - select the shape, then press Ctrl+E on Windows or Cmd+E on macOS.
The shape style formatting commands in the network topology is as follows.
# stylename: type
# styles: {"server": "fontColor=#232F3E;fillColor=#232F3E;verticalLabelPosition=bottom;verticalAlign=top;align=center;html=1;shape=mxgraph.aws4.traditional_server;perimeter=none;strokeColor=#232F3E;aspect=fixed;whiteSpace=wrap;",\
# "node": "fontColor=#232F3E;gradientColor=#505863;fillColor=#1E262E;strokeColor=#ffffff;dashed=0;verticalLabelPosition=bottom;verticalAlign=top;align=center;html=1;fontSize=12;fontStyle=0;aspect=fixed;shape=mxgraph.aws4.resourceIcon;resIcon=mxgraph.aws4.general;",\
# "firewall": "fontColor=#232F3E;fillColor=#232F3E;verticalLabelPosition=bottom;verticalAlign=top;align=center;html=1;shape=mxgraph.aws4.generic_firewall;perimeter=none;strokeColor=#232F3E;aspect=fixed;whiteSpace=wrap;",\
# "database": "fontColor=#232F3E;fillColor=#232F3E;verticalLabelPosition=bottom;verticalAlign=top;align=center;html=1;shape=mxgraph.aws4.generic_database;perimeter=none;strokeColor=#232F3E;labelPosition=center;horizontal=1;aspect=fixed;whiteSpace=wrap;"}
See the complete formatting information and CSV data for the network topology
Shape styles are located in the type column in the CSV data. The start of the CSV data section is as follows.
entry,zone,type,host,connected
1,Internet,server,J2EE application server,3
2,Extranet frontend,node,Node (extranet),4
3,DMZ,firewall,Firewall 1,"5,6"
Open this network topology in our online diagram viewer
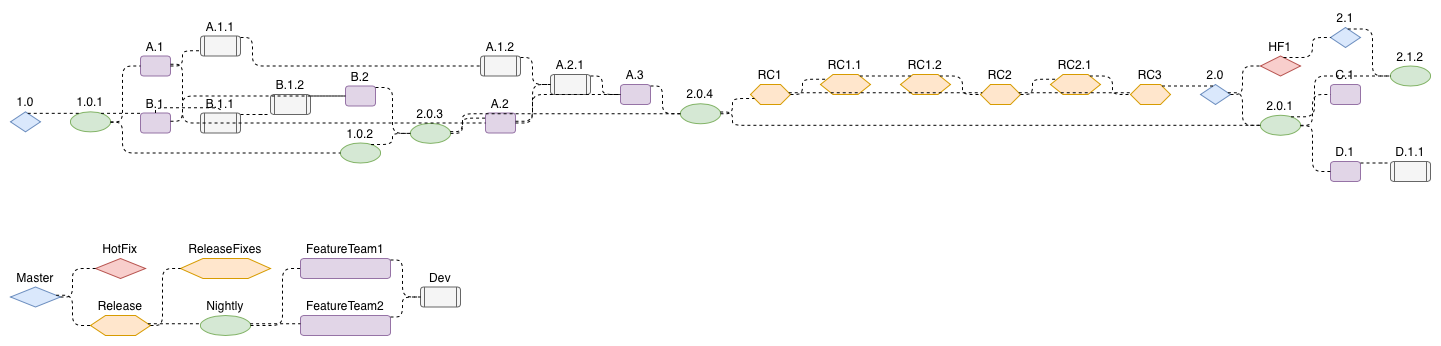
Gitflow diagram from CSV data
You can increase the complexity of the diagram to contain many different shapes and styles.
In this example, CSV data was created to represent this gitflow example. Formatting information was then added to make it easier to read, and includes a separate flow as a diagram legend.
See the complete formatting information and CSV data for this gitflow diagram