Ishikawa fishbone diagrams for root cause analyses
Ishikawa diagrams, also called fishbone, herringbone or cause and effect diagrams, are used to analyse and identify the root causes of defects or negative events. As most problems have multiple causes, Ishikawa diagrams are a useful prompt to look at the many different contributing factors.
When presented visually following a common format, you can look for patterns or where the same root cause contributes to multiple defects much more easily in a diagram than in lists and tables.
Teams will typically create Ishikawa diagrams together in one or more brainstorming sessions, then present them to stakeholders for further discussion.
Structure of an Ishikawa diagram
The problem or event is to the right, as the 'head' of the fish. The broad categories that may contribute branch off a central 'backbone', forming the 'ribs' of the fish. These may have sub-branches for the sorted root causes.
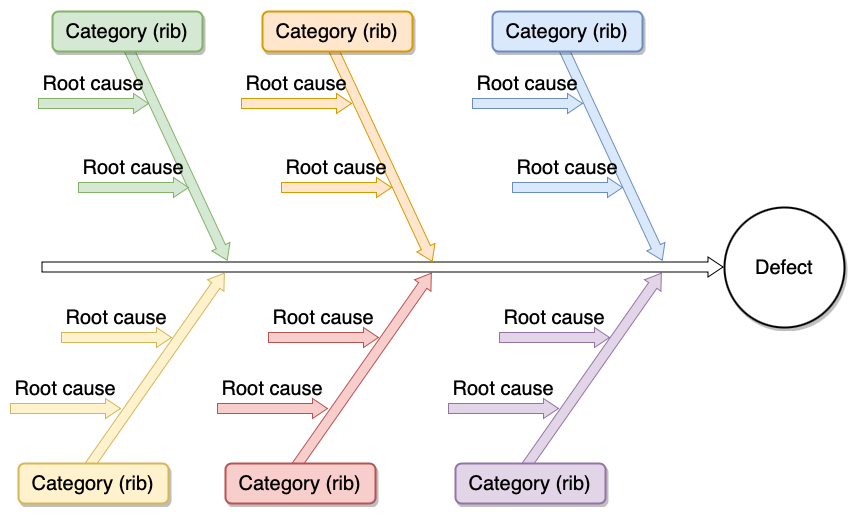
Note: Complex problems with many contributing factors can clutter your diagram. Break down the complex defect into multiple simpler diagrams across several pages, and link to the appropriate page from each 'rib' in the overview diagram.
Learn more about working with multi-page diagrams
Ishikawa diagrams in draw.io
The draw.io template library provides you with a few Ishikawa diagram templates, so you don't need to draw the skeleton every time - just change the labels on an existing example to suit your use case.
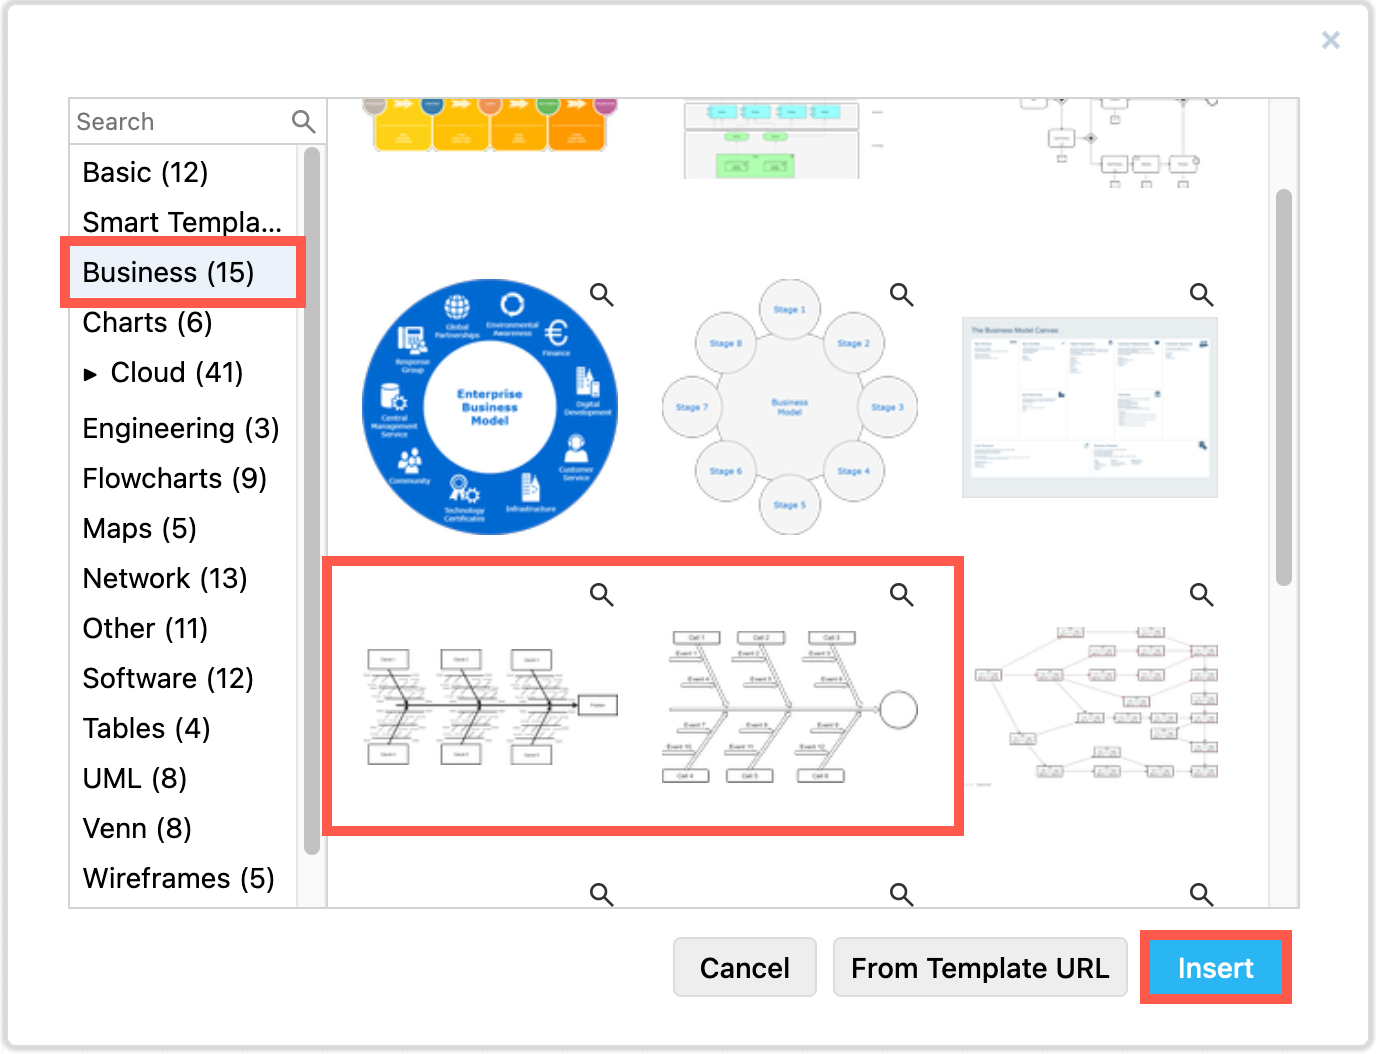
- Create a new diagram, or click Arrange > Insert > Template to open the template library.
- Select the Business category, then scroll down to find the Ishikawa templates. Click on the magnifying glass to see a larger preview.
- Select one of the templates, then click Create or Insert to add it to the drawing canvas.
Edit your fishbone diagram
- Double click on any text label and start typing to change the text.
- Use the Style tab in the format panel to change the colours of shapes and lines.
To visually add weight to a root cause, make the sub-branch and 'rib' it sits on thicker or coloured line. The problems will be clear at a glance without adding additional clutter to your diagram.
Alternatively, highlight which root causes are problematic and which seem to not contribute with contrasting colours.
Remove or add new 'ribs' as needed. First drag a selection box around an existing rib with its sub-branches.
Delete a rib
Press Delete or Backspace if you want to delete the rib.
Add new ribs
If you want to create a new rib, press Ctrl+C then Ctrl+V to copy and paste, then drag the new rib into its position. You may need to extend the backbone before you attach the new rib to it.
Tip: Waypoint shapes can make it much easier to attach and move fishbone ribs in an Ishikawa diagram if you need to rearrange sub-branches and ribs regularly.
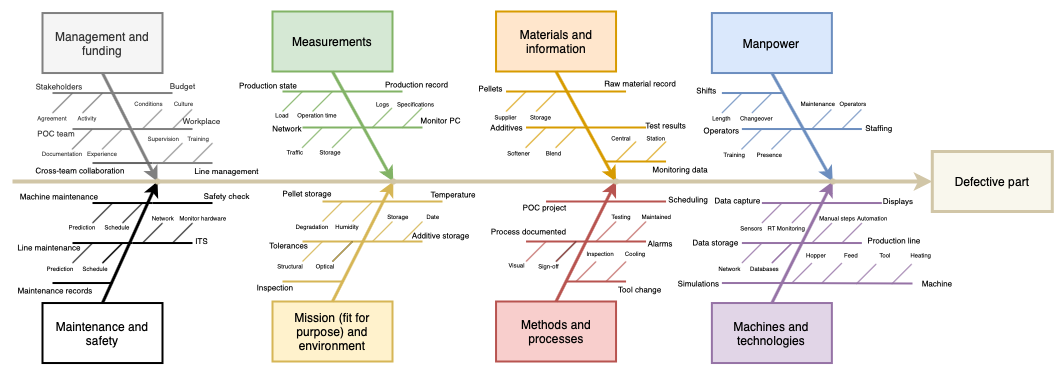
Ishikawa diagram content is domain specific - there are different standardised fishbone diagram categories for manufacturing, product marketing, and when providing services to customers.
Ishikawa diagrams for manufacturing
5M model
For a root cause analysis in the manufacturing industries, the 5M model is typically used:
- Manpower / mind power
- Machines and technologies
- Materials, including information
- Methods
- Measurements, including environmental issues
This has been expanded in some instances to include three more Ms: mission, management, maintenance
See this example in our diagram viewer
Ishikawa diagrams in product marketing
Problems that cause a marketing campaign to underperform or fail are quite different again to those faced by manufacturing and the service industries.
7P marketing mix
This commonly expanded marketing mix is described by popular marketing theory for both physical and digital products and services: Product, Price, Place, Promotion, People, Process, and Proof.
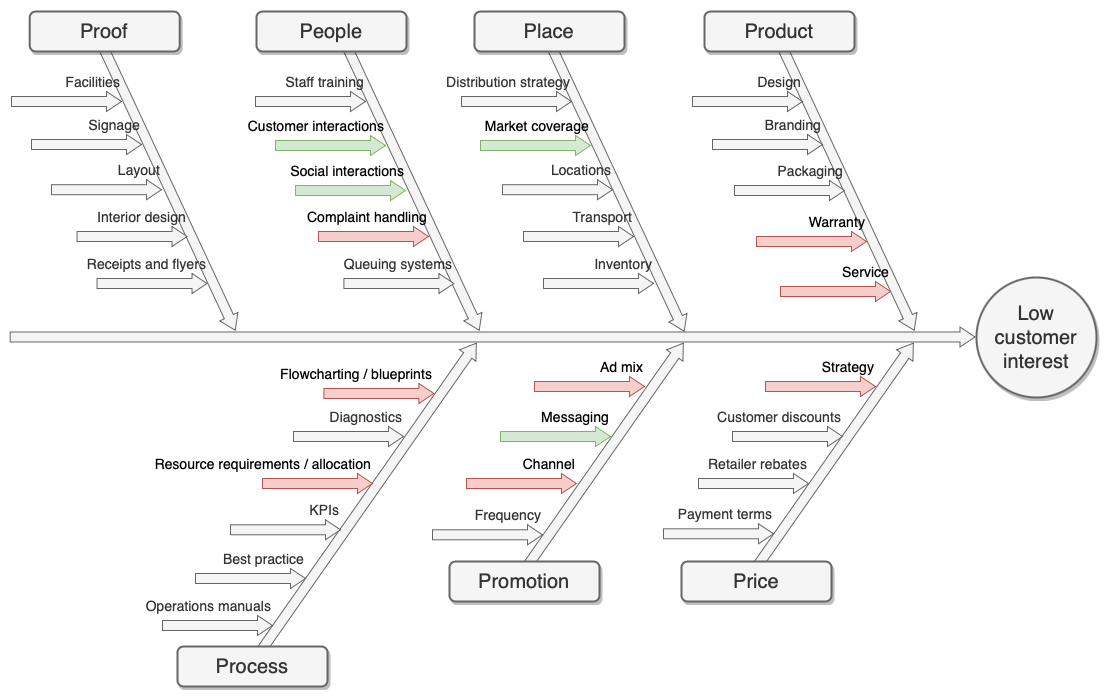
See this example in our diagram viewer
7C compass model
Alternatively, you can use the 7C Compass Model, most commonly used when co-marketing a product with another company:
- Corporation - competitors, organisation, and stakeholders
- Commodity - goods and services
- Cost - pricing and social cost
- Channels - marketing and flow of goods
- Communication - promotion, public relations, corporate identity and internal communication
- Consumer - needs, security, education, and wants
- Circumstances - national, social and cultural, economic, and weather
Ishikawa diagrams for service industries
5S model
Problems that occur when directly serving customers, rather than producing a physical product, will have markedly different root causes. A 5S model is most commonly used in the customer service industries.
- Suppliers
- Systems
- Skills
- Surroundings
- Safety
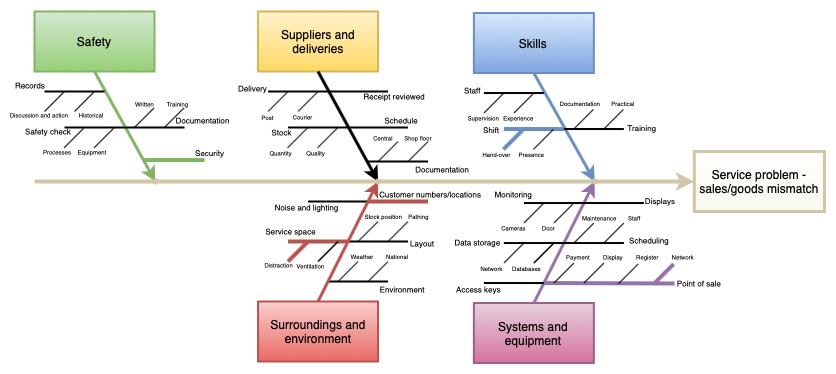
See this example in our diagram viewer
Related
Ishikawa diagrams may not be best for root causes that lie across multiple categories. If you want to show the interrelationships between causes, a modified form of a dependency graph or an entity relationship diagram may fit your needs better.