Use lists in diagrams to present text information clearly
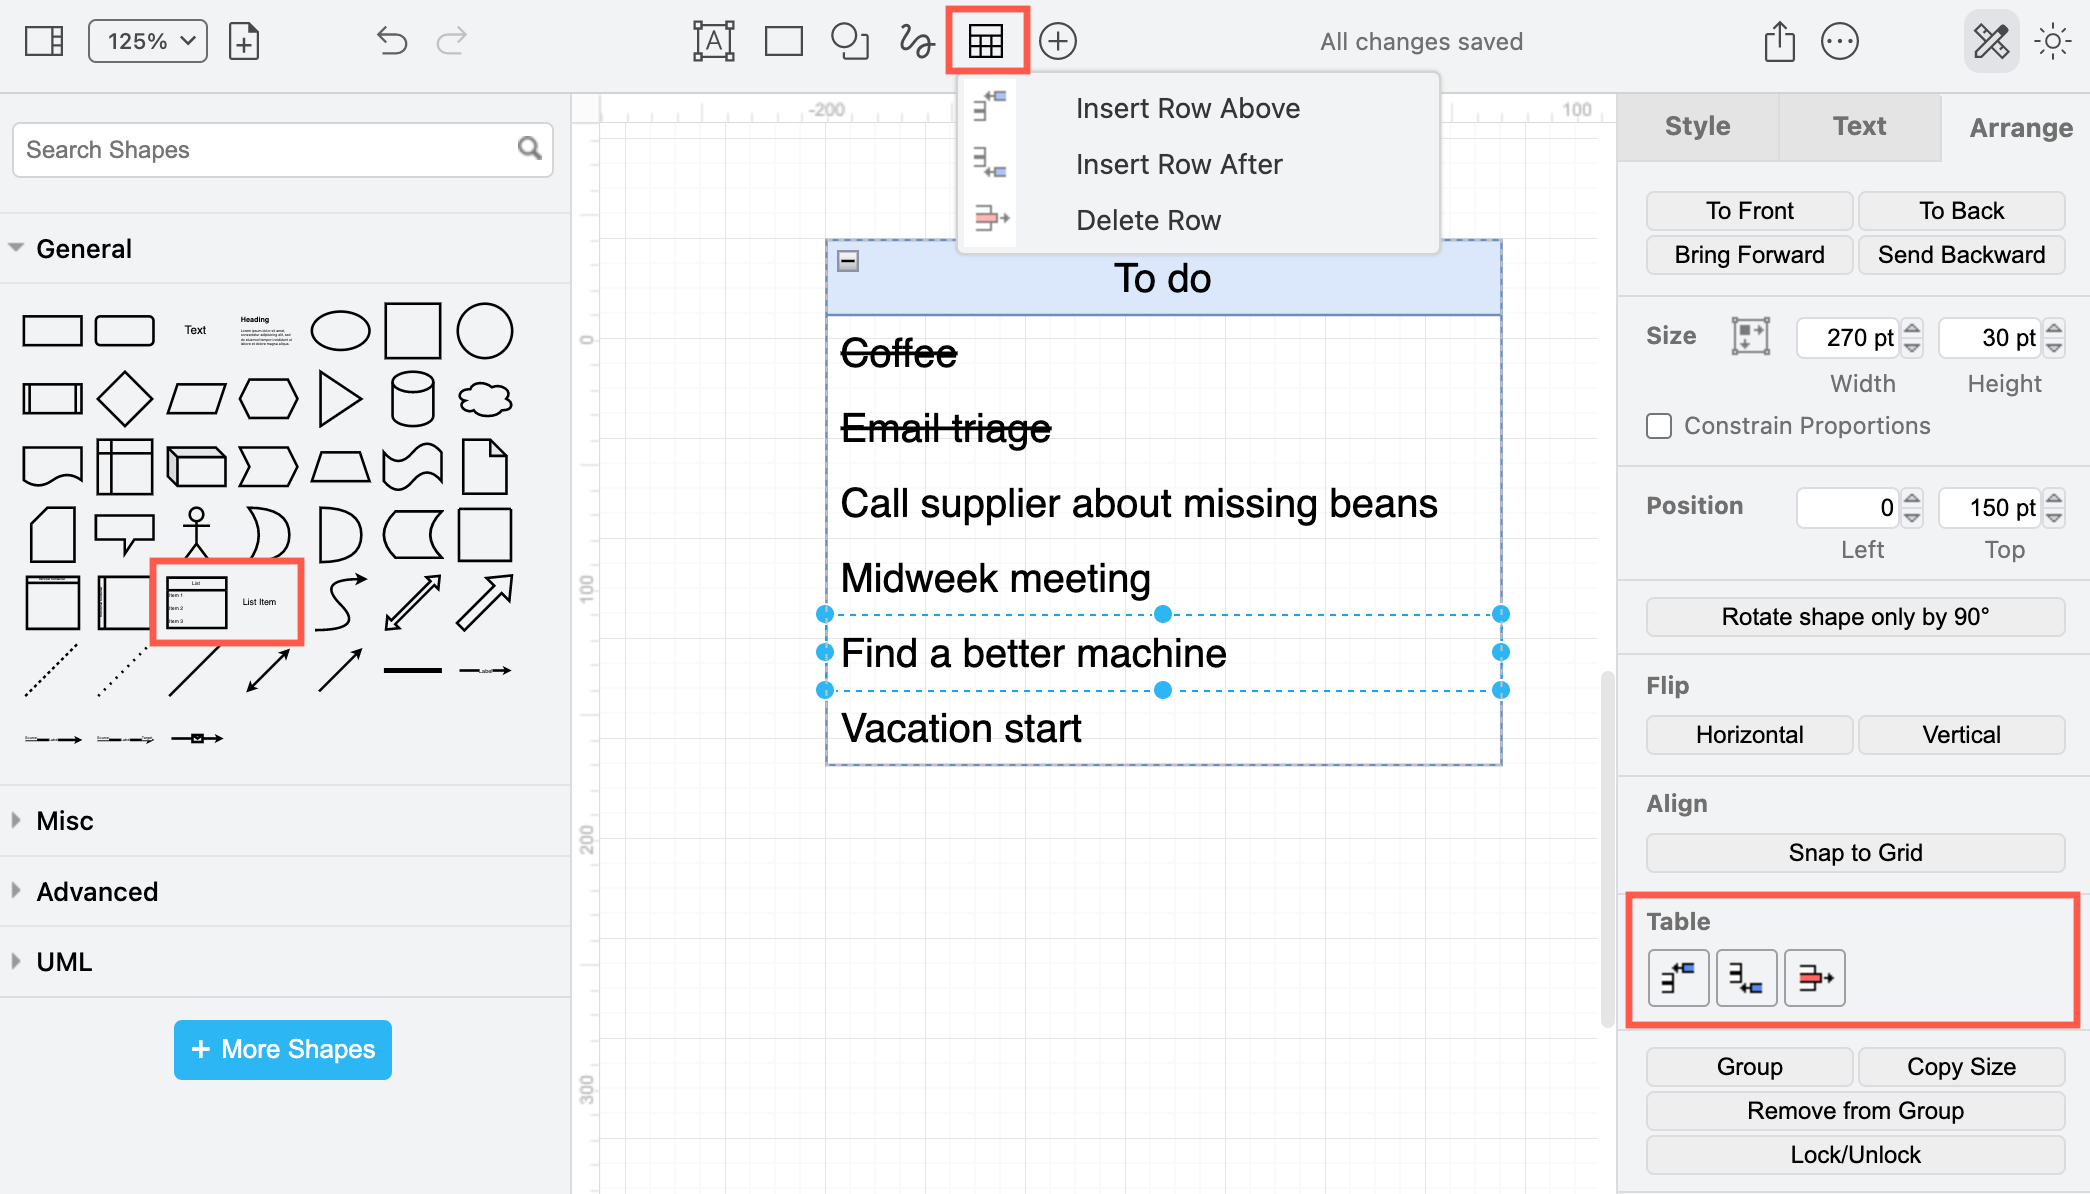
The list shape in draw.io functions just like a table shape - use keyboard shortcuts, or the table tools in the Arrange tab of the format panel on the right, or the table tool in the toolbar above the drawing canvas to quickly add and delete list entries.
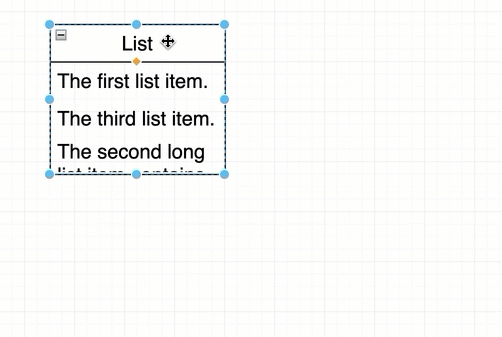
Work with a list shape
Find this list shape and the row shape (list item) in the General shape library.
Note: There are many other specialised list shapes in the Misc shape library, and more if you search for "list" in the Shapes panel. While some work like the list shape described in this post, others have very different features, such as the infographic, clipart, or mock-up lists.
Add a row
There are several ways you can add a row to a list shape. First, click on a list shape and click again to select a row inside the shape.
- Click on the Insert Row After or Insert Row Before buttons in the Arrange tab of the format panel.
- Use the table tool in the toolbar to add a row.
- Press
Ctrl+Enteron Windows orCmd+Enteron macOS to insert a copy of the row directly below the selected row. - Hold down either
CtrlorCmd, grab and drag a copy of a row to a new position in the table, or pressEnterto copy it.
Delete a row
Click on a list shape to select it, then click again on the row to select just that row, then choose one of the following methods.
- Use the tools in the Arrange tab of the format panel, or in the Table tool in the toolbar to delete that row.
- Press the
Deletekey. - Right click on the row inside the list shape and select Delete from the context menu.
Move a row
Click on the list shape, click again on the row inside to select it, then drag the row to a new position. Alternatively, use the arrow keys on the keyboard to move the selected row up or down.
Resize a row vertically
Select the list item inside the list, drag the round grab handle at the top or bottom of the row to make it larger or smaller.
Resize the list horizontally
Select the containing list shape (click on the top title) and drag the grab handles on either side.
Expand and collapse lists
Click on the small - or + icon in the top left of the list shape to collapse or expand it.
Connect to rows in a list
Hover over an unselected row, drag a connector from one of the crosses on either side of the row, and drop it on another shape or row in a list shape to draw a connector between them.
These fixed connectors will remain attached to the row when you move the list shape on the drawing canvas.
Dividers, embedded shapes, and nested lists
Add a divider
Use the divider shape in the UML shape library to add sections to a list shape. Drag it from the shape library on the left and drop it over the list. You can drag it up and down, just like any other list entry to reposition it.
Tip: Divider placed in a list shape will automatically use the colour of that list shape's outline.
Embed shapes in lists
Drag a shape from the shape library and drop it on the list shape when the outline is purple to add it as a row in the list.
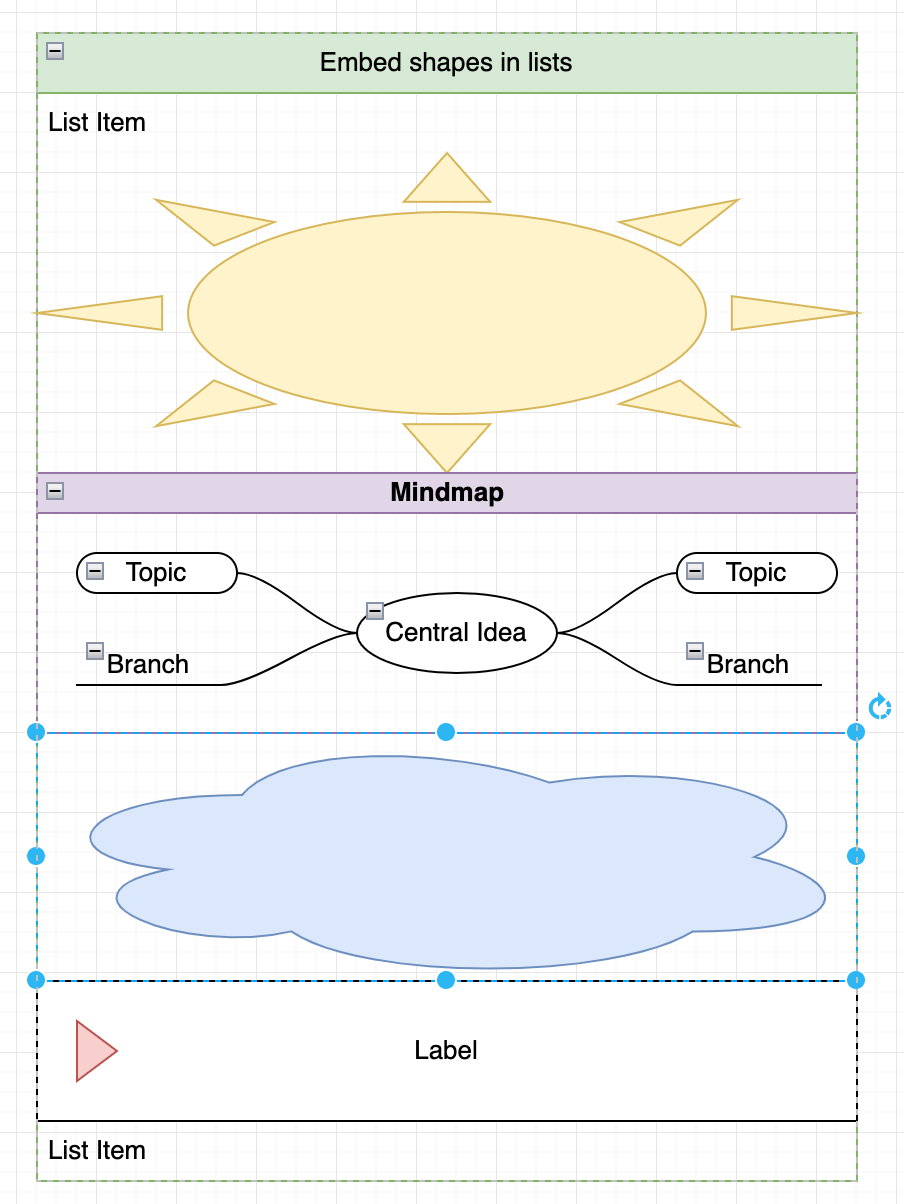
Most simple shapes can be embedded this way, as well as some of the smart container shapes (such as the mindmap shape from the Advanced shape library).
To overlay a shape and not turn it into a row, hold down Alt as you drag and drop the shape on top of the list.
Nest lists
Drag a new list shape into a list shape that is already on the drawing canvas. A nested list shape will be hidden when its containing list shape is collapsed.
Format list text
The list shape in the General shape library has word wrap and HTML text formatting options enabled by default. Double click to select the text inside the row and use the formatting options like bold, strike-through, bulleted list, indented text, and so on, in the Text tab of the format panel.
Diagrams using list shapes
If you're using draw.io as an online whiteboard in a team meeting, use the list shape to quickly prepare checklists and to-do lists.
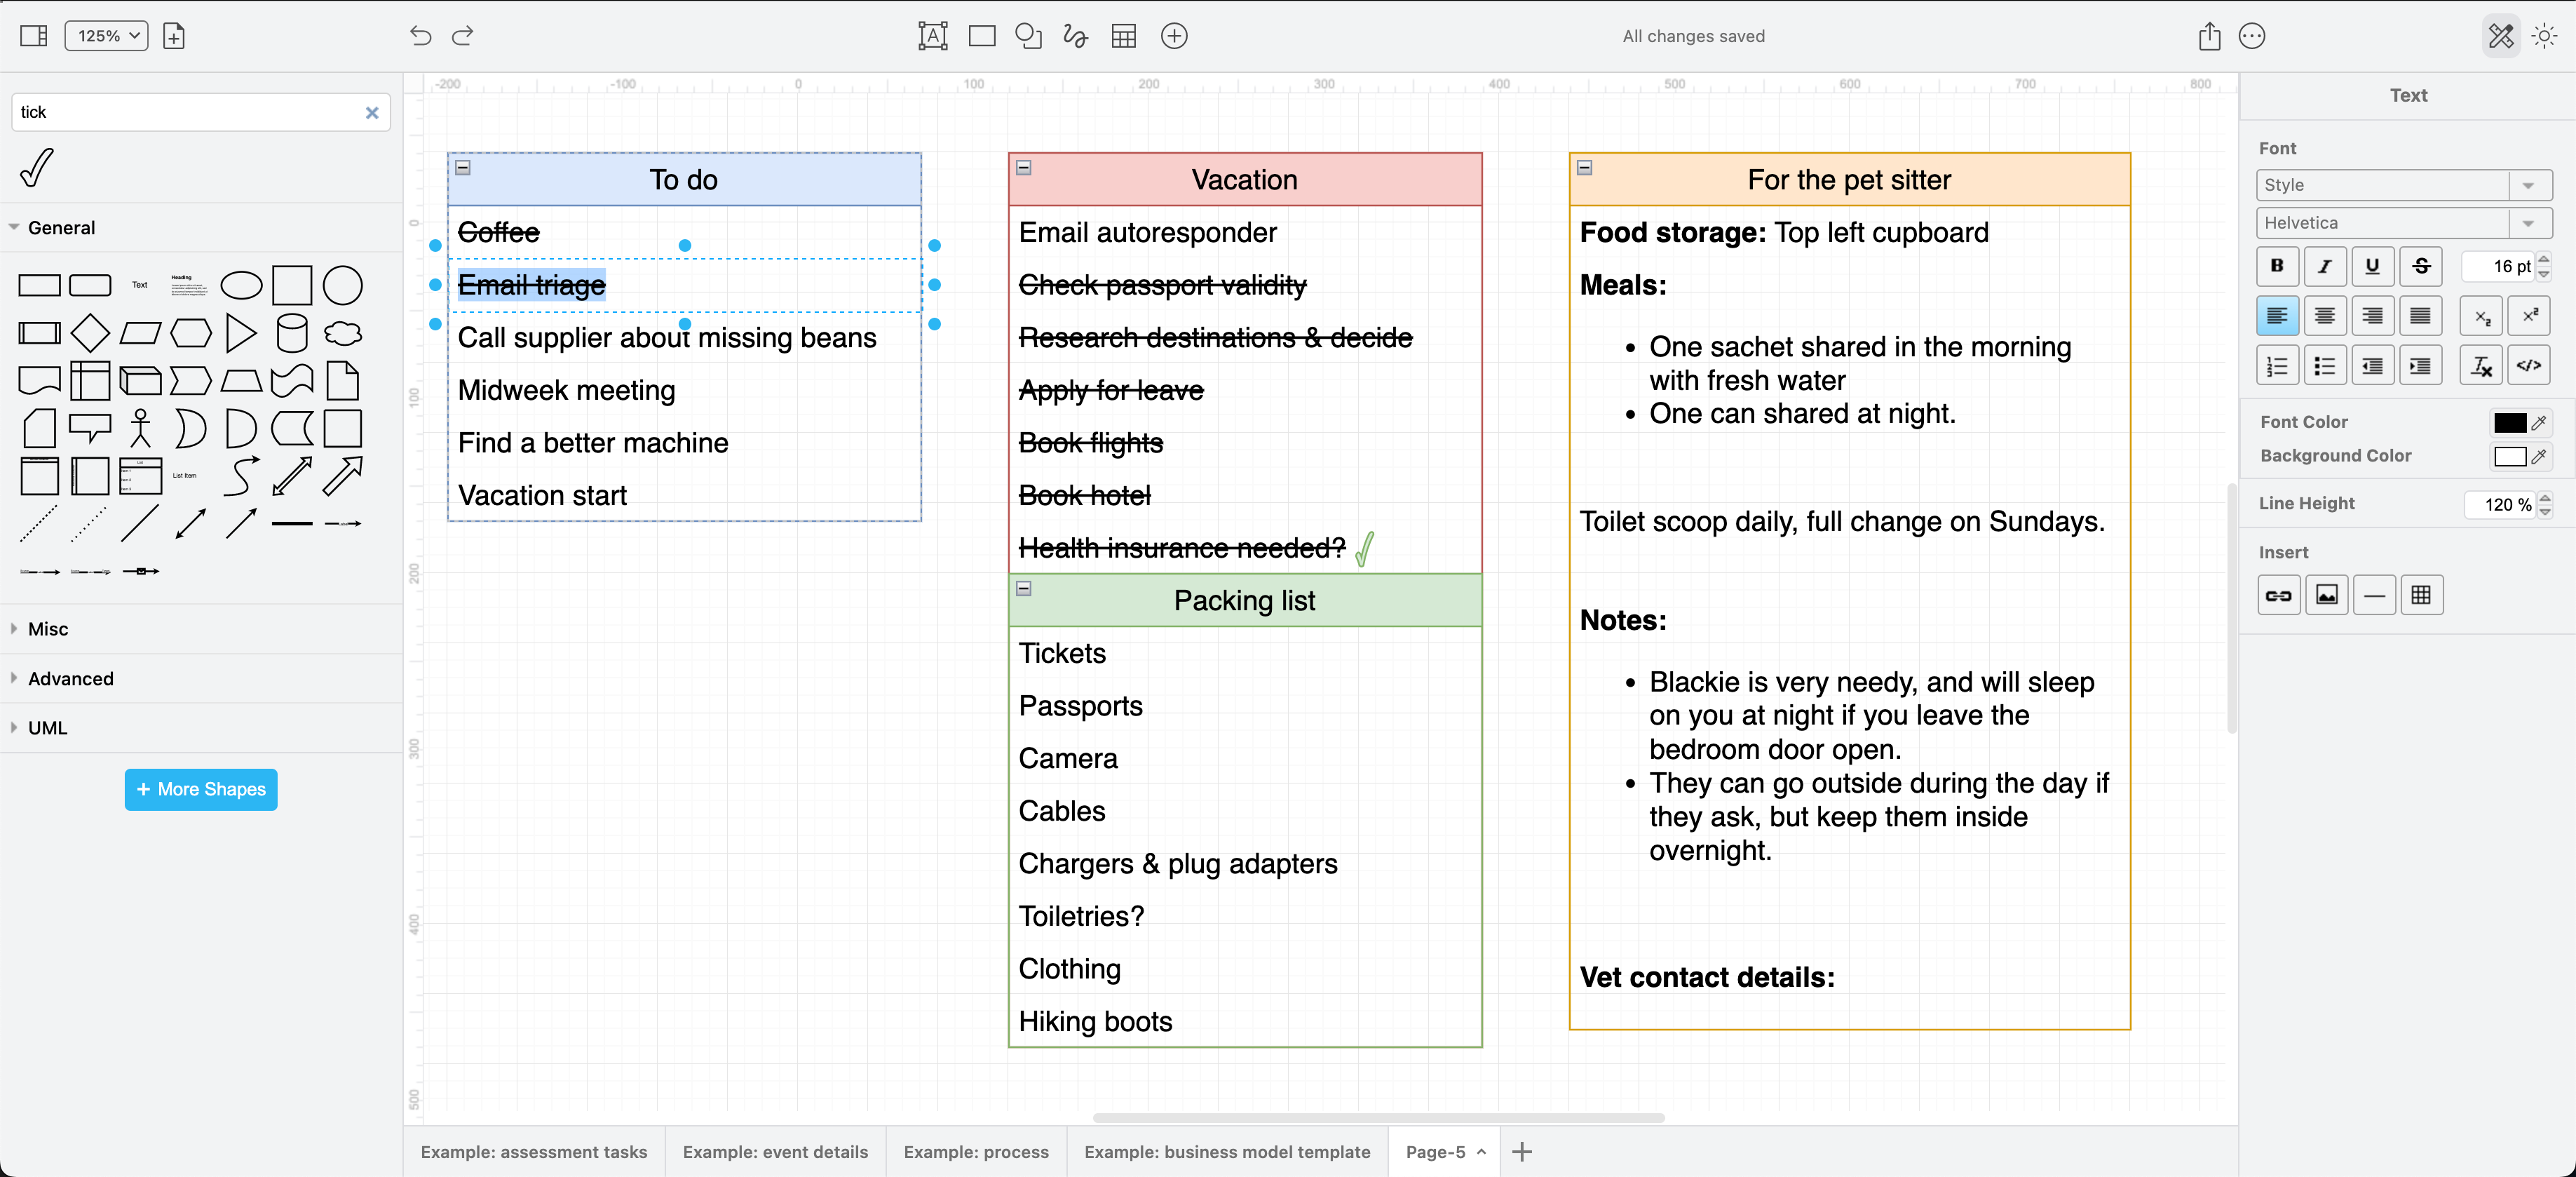
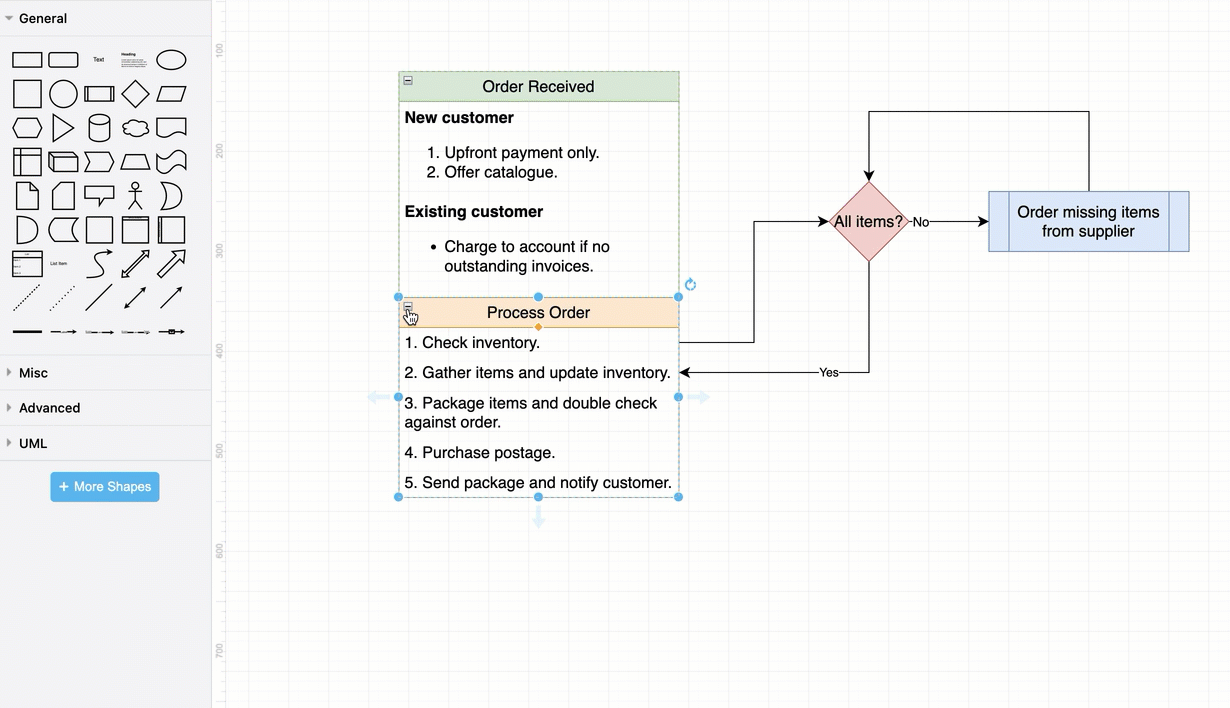
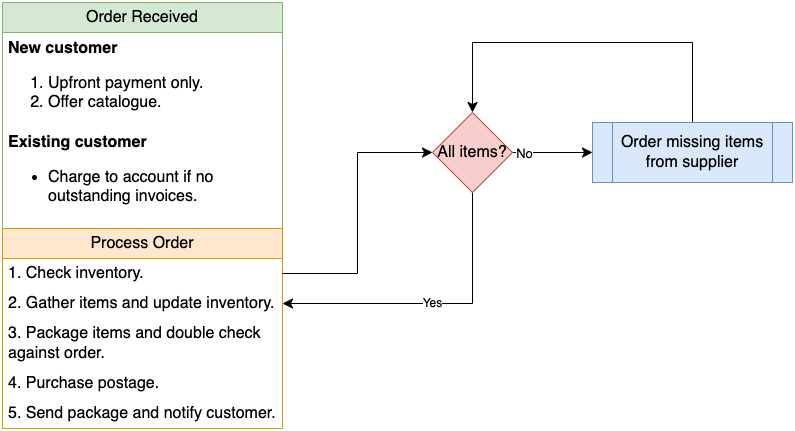
Short processes also work well in list shapes and are quick to draw using the Ctrl+Enter keyboard shortcut to copy rows.
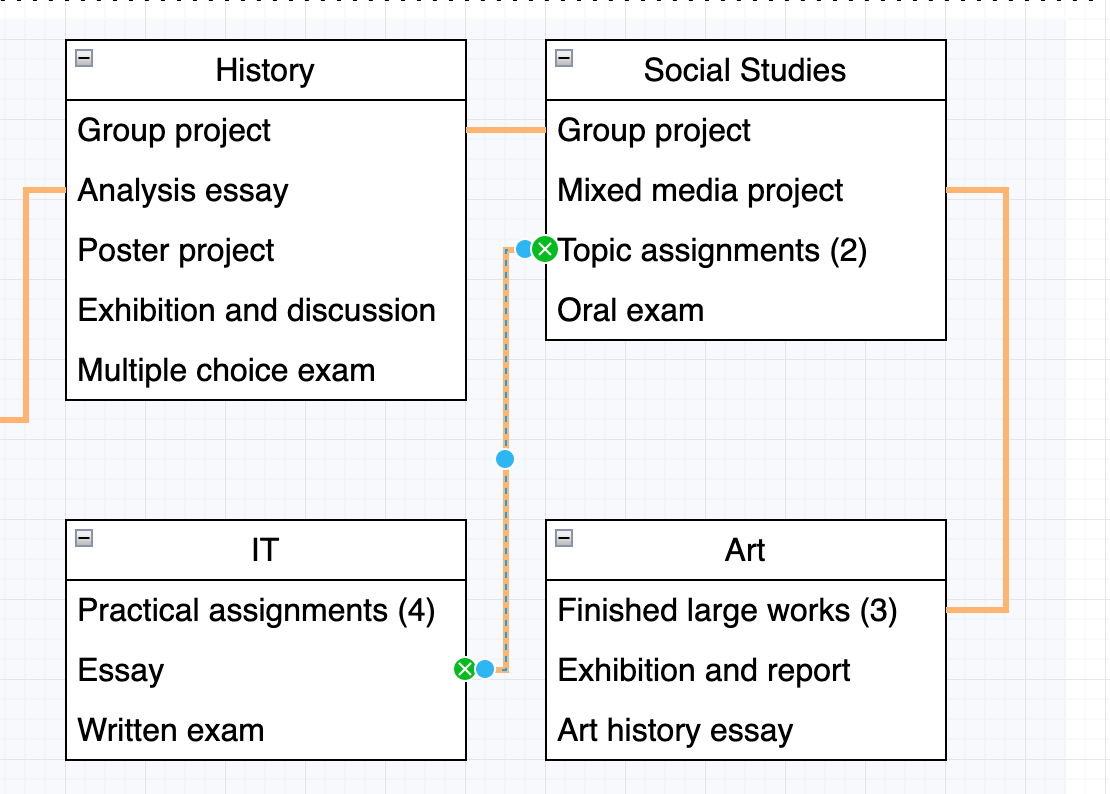
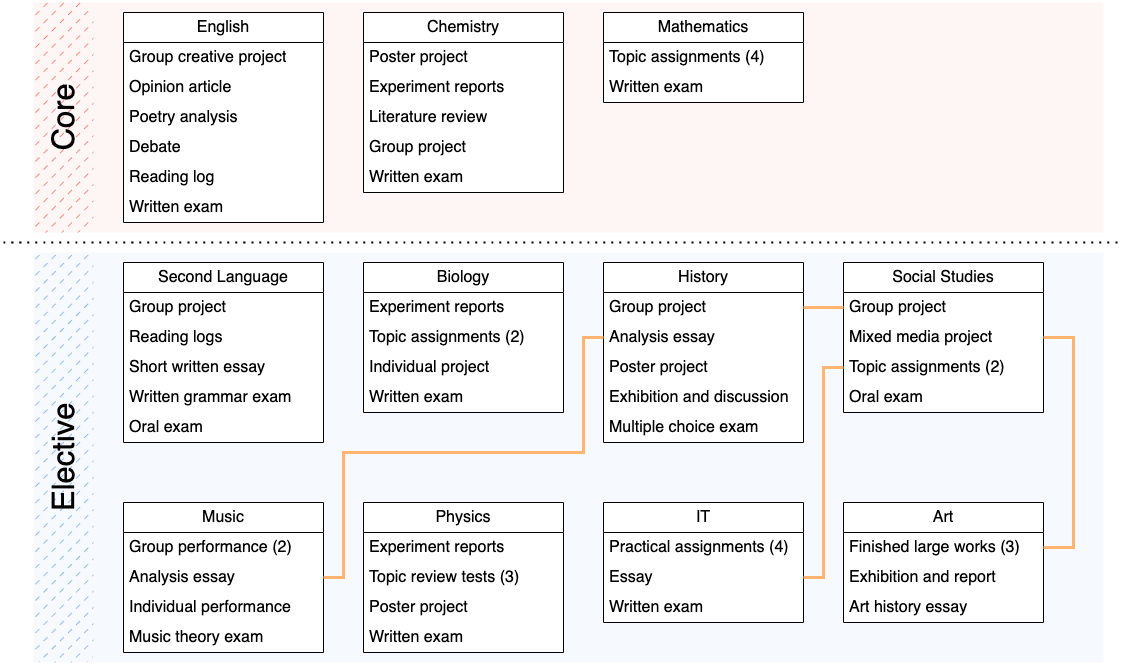
Document requirements or role responsibilities. For example, this is a list of assessment tasks for core and elective subjects showing which tasks may be combined across multiple subjects.
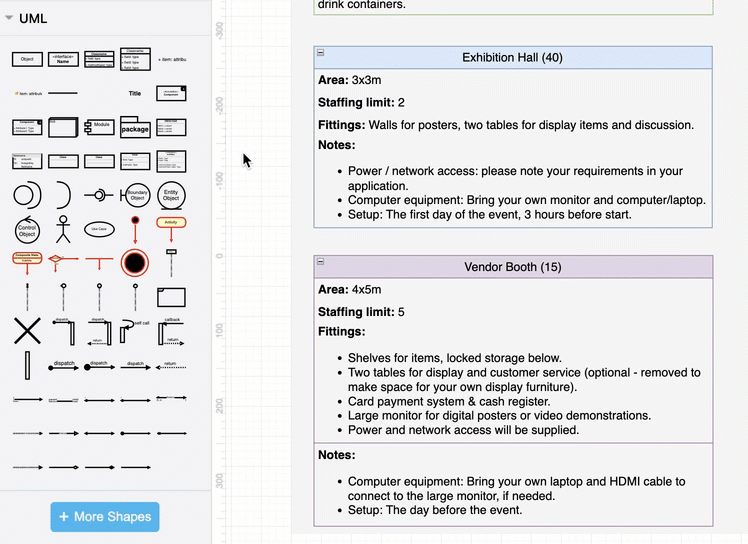
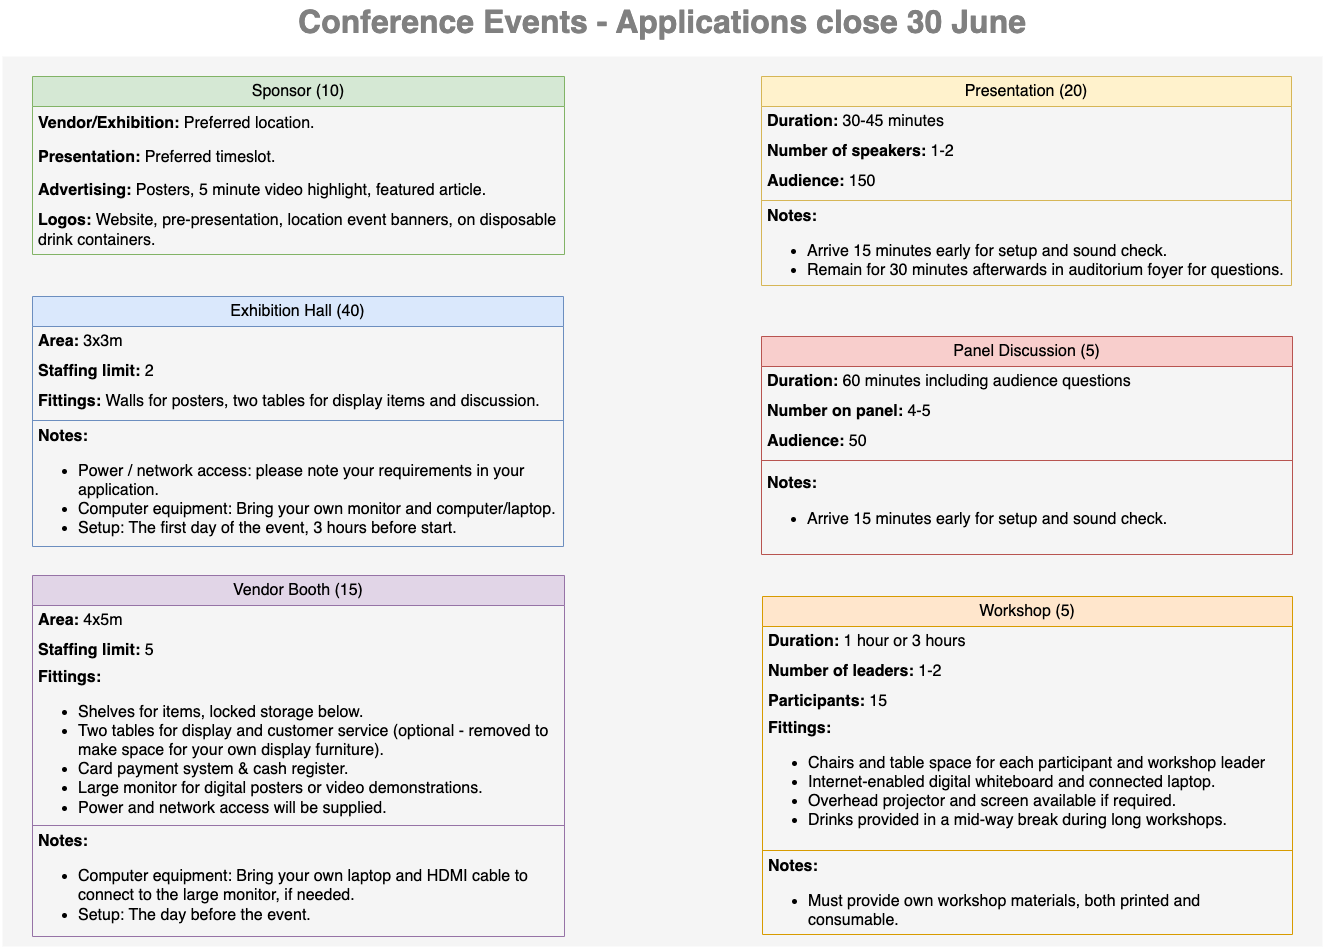
Conference details for each event and exhibitor type are easily shown and compared using list shapes.
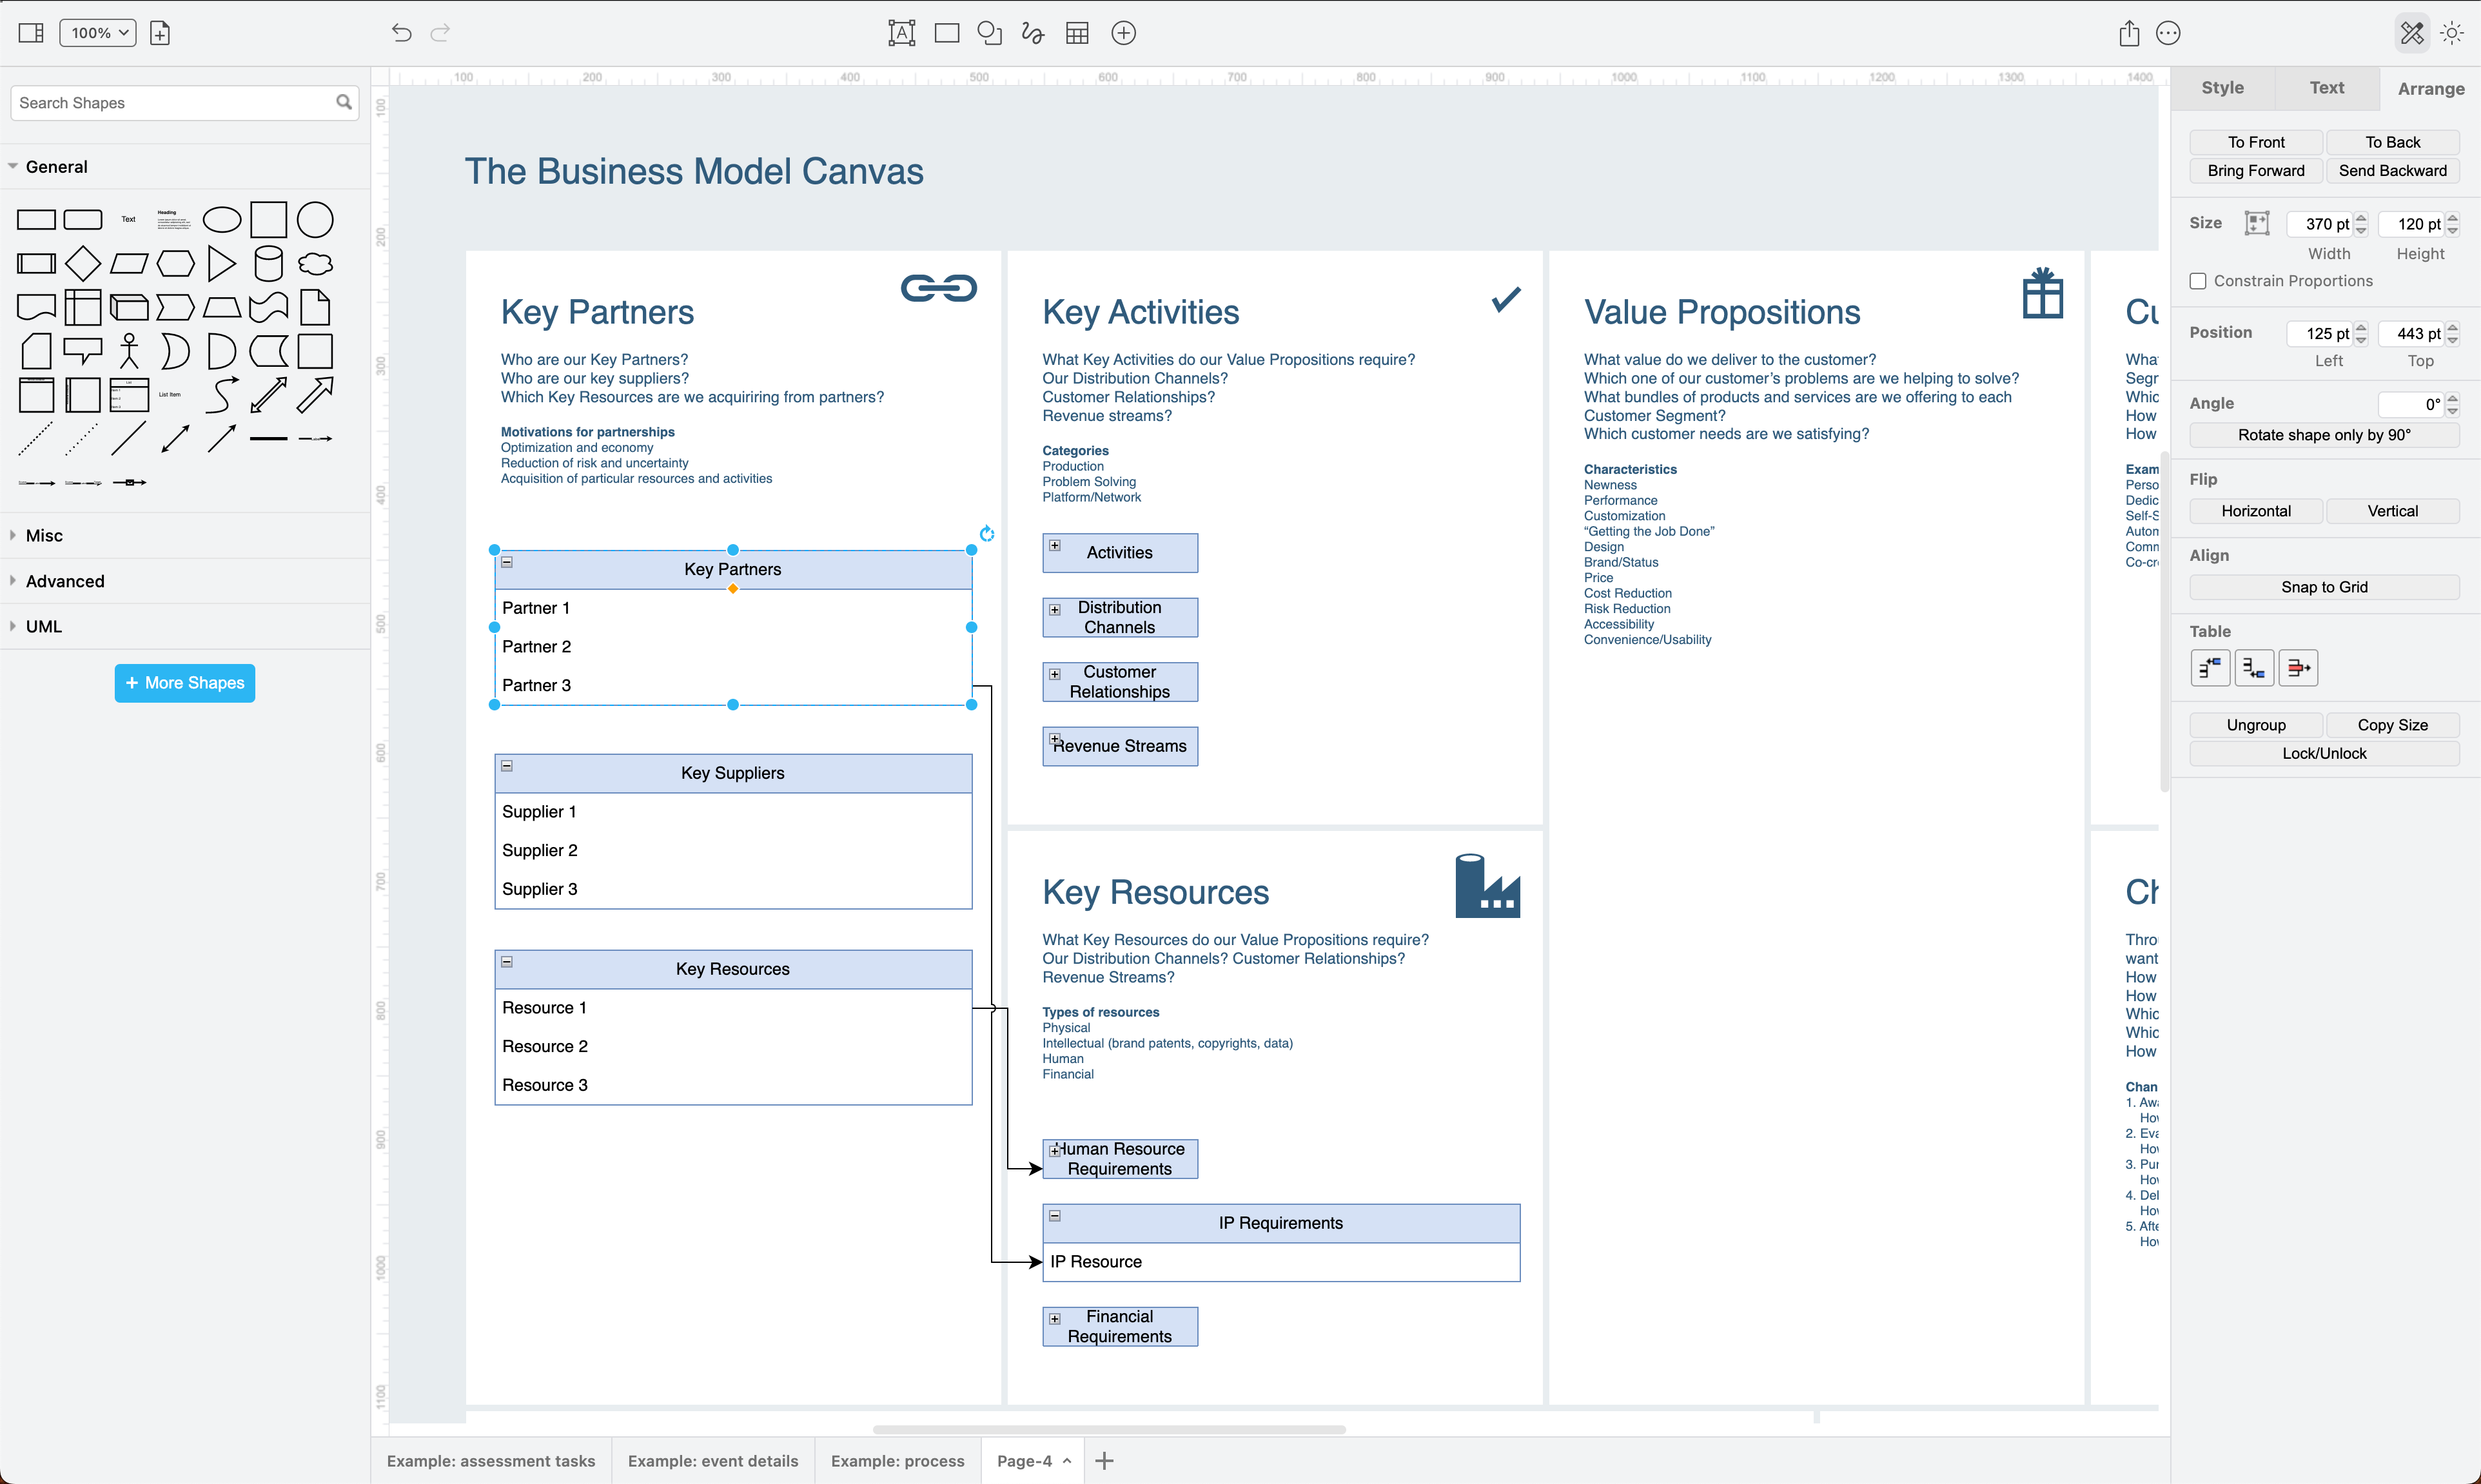
You may find text-rich templates, like this business model canvas, easier to work with when you use list shapes. For example, you can draw connections between key resources and requirements, and collapse each category to work with the business model more easily.
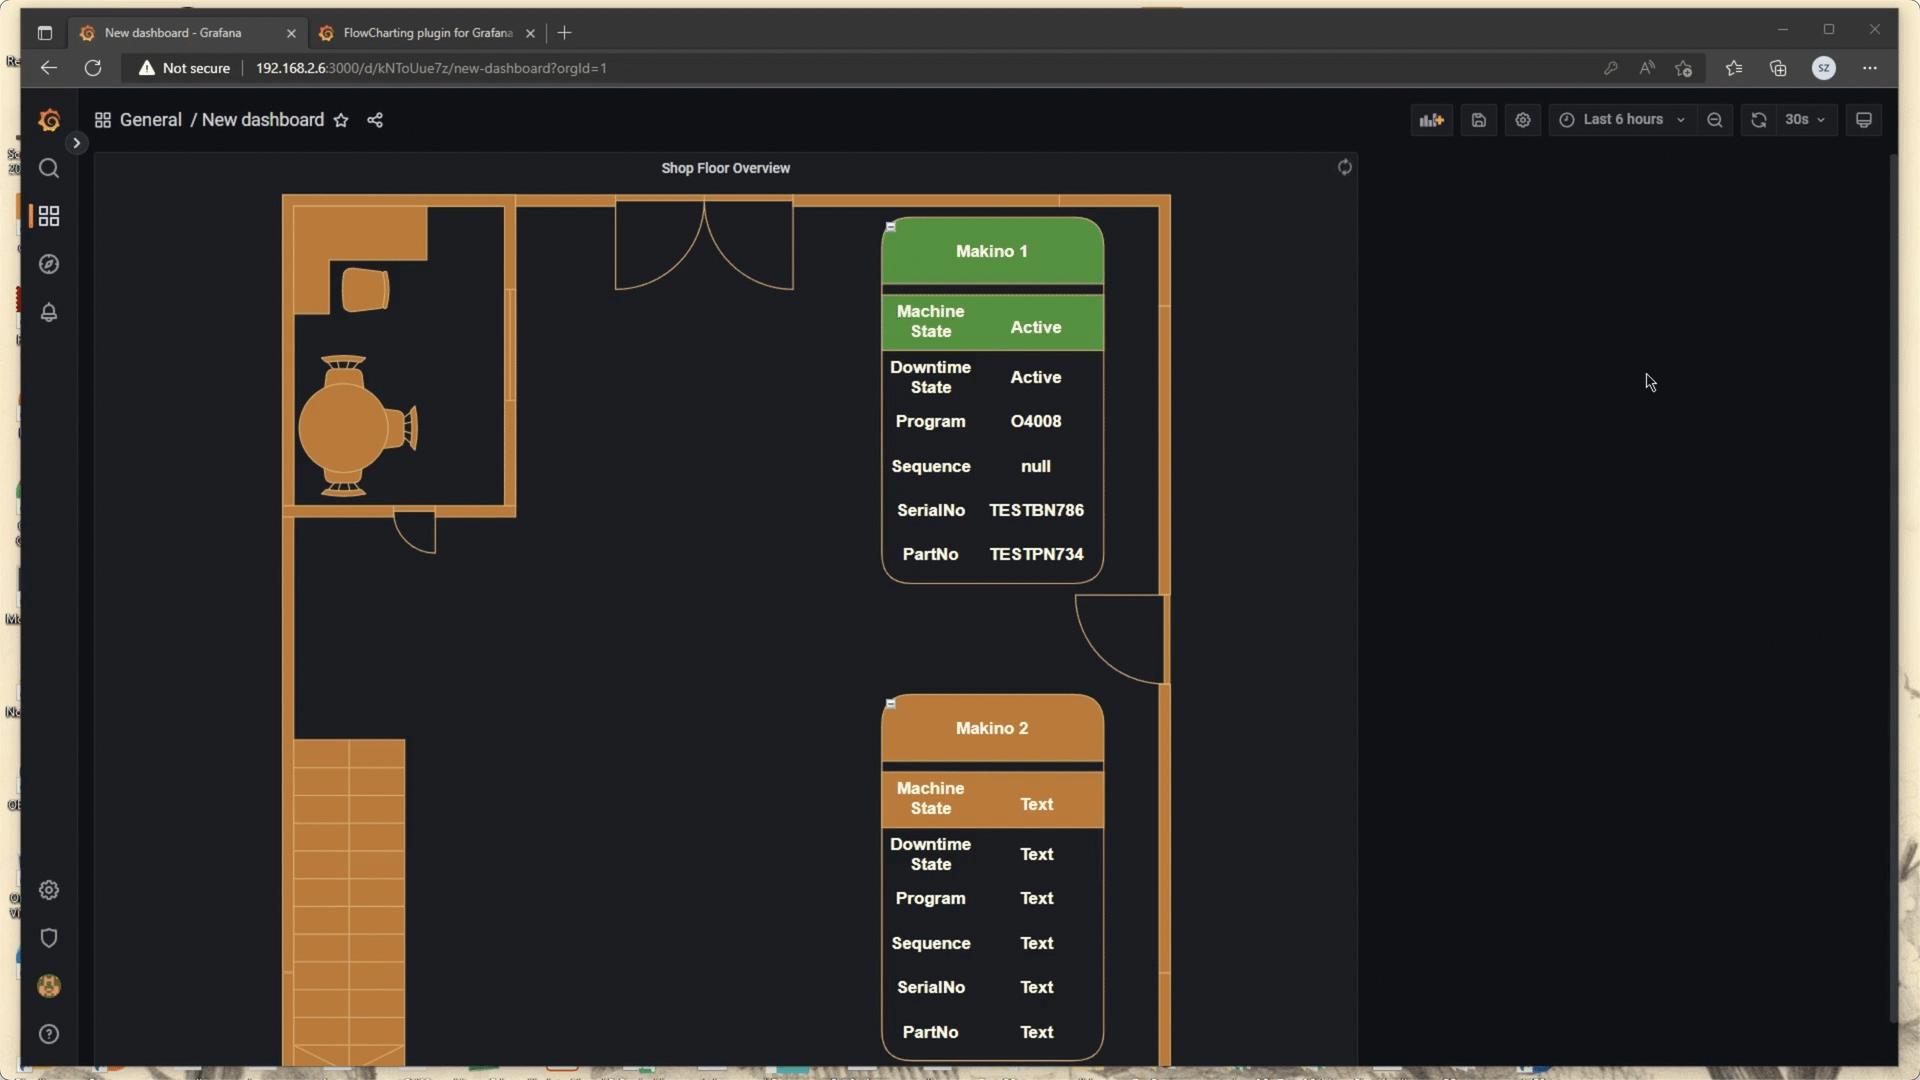
Advanced users: List shapes are useful in data-driven diagrams, just like the table in dashboard below. As each row in the list shape has its own unique shape ID, it can also be referred to and updated by other applications dynamically.