Org charts and tree diagram in draw.io
Org charts, also known as tree diagrams, organisational charts, and organigrams, are used throughout all disciplines and professions. Humans like to categorise everything as it helps us make sense of how the world works. Species of plants and animals, corporate and military hierarchies, team structures, family trees, language family relationships, even symptoms of illnesses - org charts help us quickly find who to contact, what illness to treat, and so on.
As an employee directory, org charts may show your company's reporting or management structure, or be divided into departments or projects.
Create org charts quickly
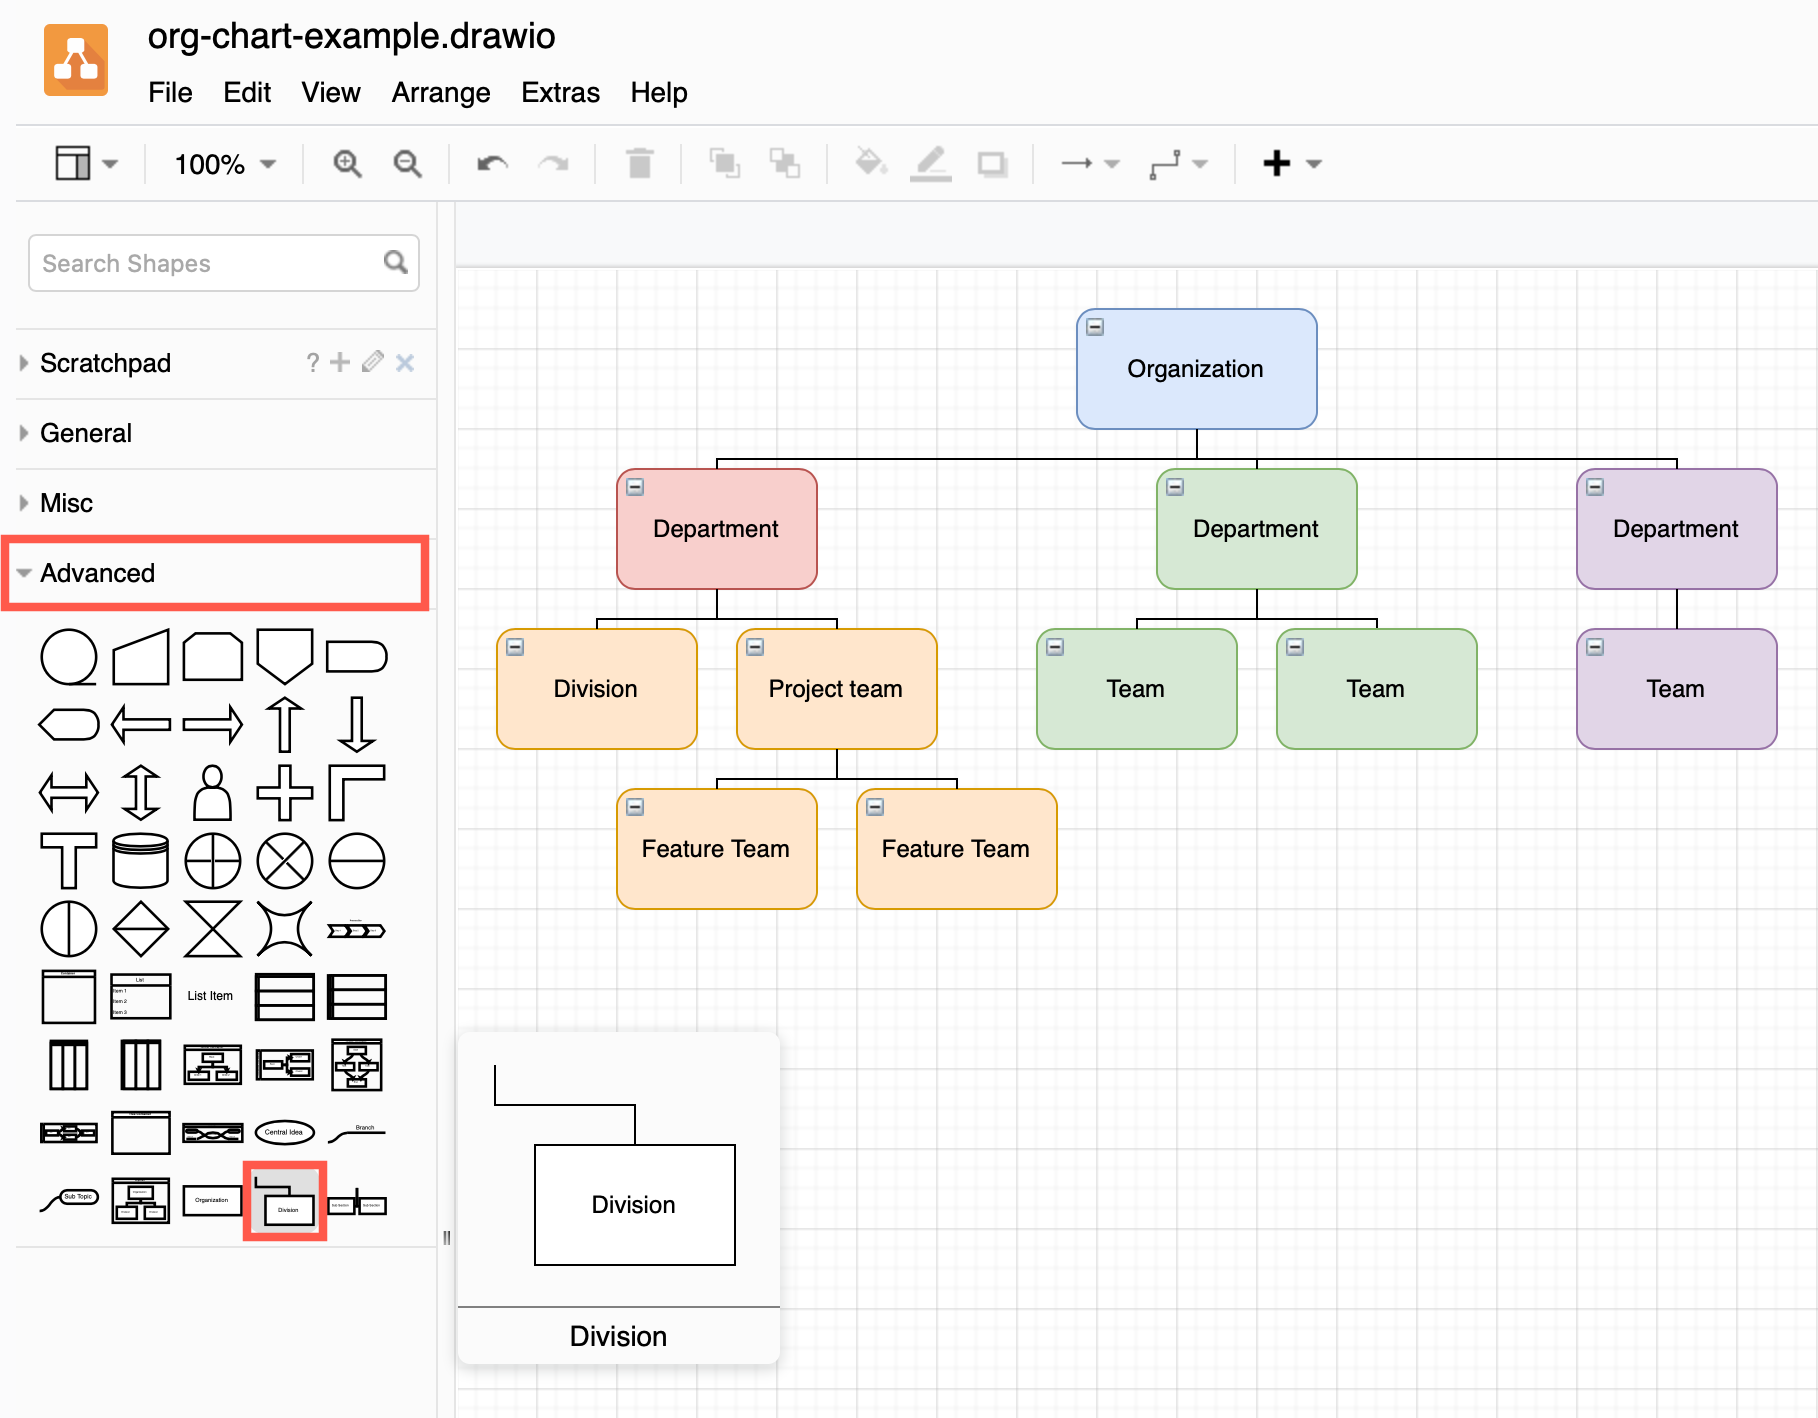
You can create an org chart with just two components - rectangular shapes with a label, and the connectors between them. Use the rectangular shapes in the default Advanced shape library. The Advanced shapes have additional features that allow them them to be repositioned using automatic layouts.
Draw an org chart using basic shapes
The rectangles (nodes) in an org chart are laid out in a tree structure, showing their parent-child relationship. The most important node is almost always placed at the top of the tree.
- Add an Organization shape from the Advanced shape library to the diagram canvas and style it as you wish. This is your parent node.
- Drag Division and Sub Sections shapes from the Advanced shape library, hover over one of the blue arrows of your parent node and release to connect. If you want to connect another child node in the same direction, you'll need to move the existing child node first.
- Use various shortcuts to clone and connect child shapes into your hierarchical tree structure.
- Hover over a node and click on the blue arrow to clone and connect a child shape in that direction.
- Select a shape then use the keyboard shortcut
Alt+Shift+arrow keyto clone and connect shapes quickly.
Arrange org charts with layouts
To quicly rearrange an org chart, you can use an automatic horizontal or vertical layout. There are some other layouts you may prefer, such as fishbone, radial, or single columns. You can quickly switch between the different layouts with draw.io.
- Click Arrange > Insert > Layout > Org Chart. There are a number of different common layouts used for org charts.
- Select one from the Org Chart Type drop down box.
- If you want to, set a different spacing from parent to child, and between siblings by editing the text fields.
- Click OK. Your diagram will be rearranged into your selected layout.
Open this org chart in our online diagram viewer
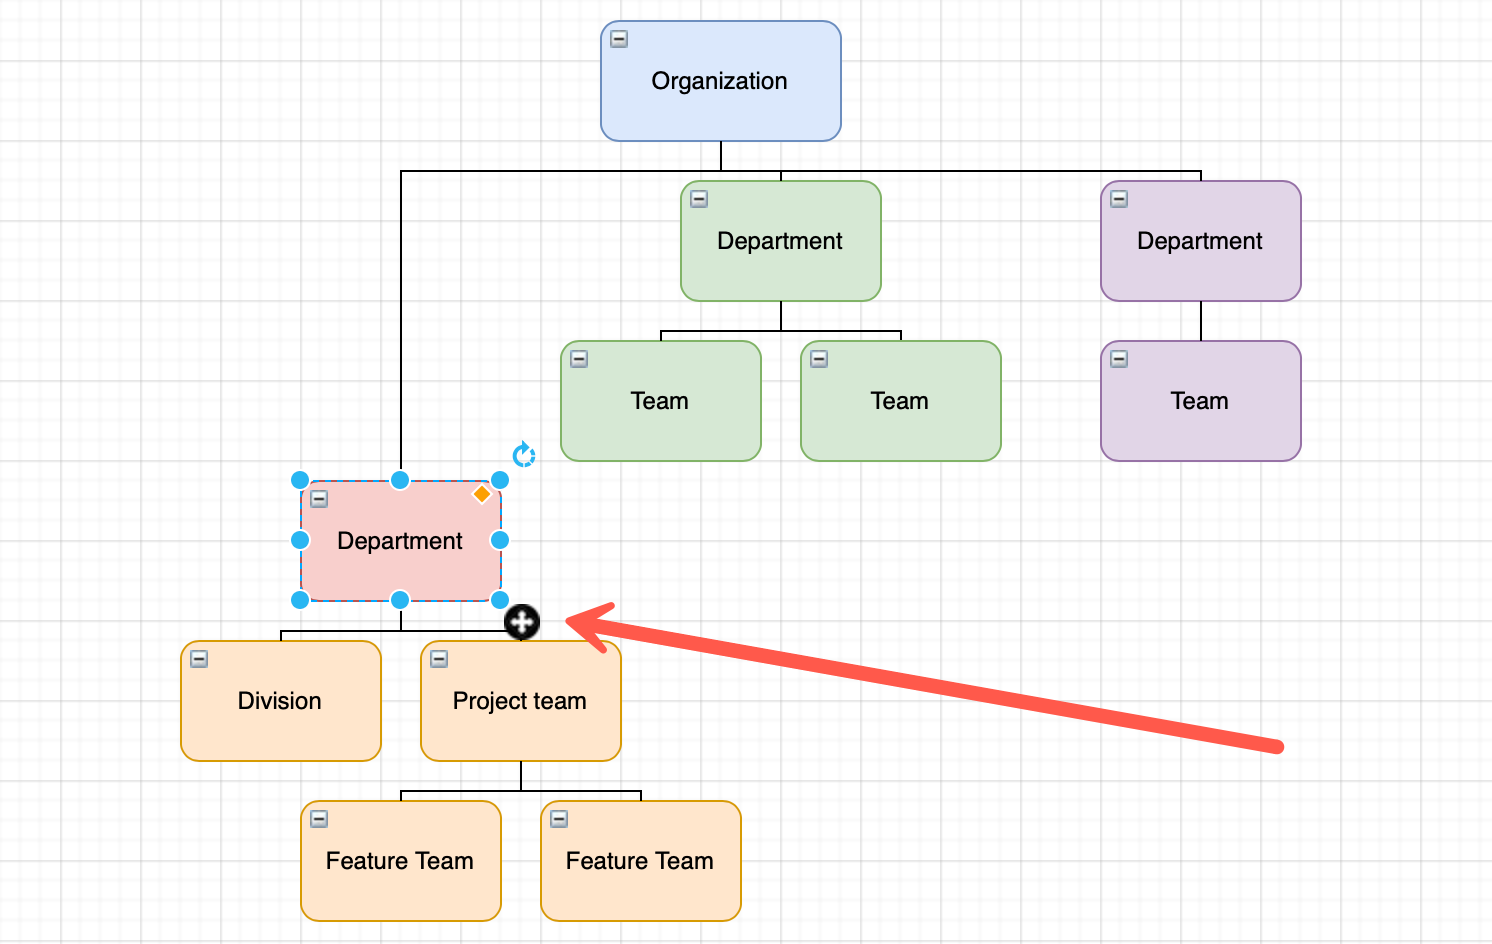
Move a branch
Select a shape, then click and drag the black circle with a plus on the bottom right to move the entire branch of your org chart to another position.
Expand/collapse a branch
Click on the +/- button in the top left of the shape.
Tip: Separate complex branches into their own page in a multi-page diagram and link to those pages from the parent node of that branch.
Use a tree layout shape
In the Advanced shape library, there are also container shapes with vertical and horizontal tree layouts. These container shapes can be collapsed and expanded.
These container tree layouts automatically resize to fit their contents, and arrange all of the shapes inside neatly and automatically, either in a vertical or horizontal tree format. After you clone and connect a parent to a child node inside a tree layout shape, you won't need to reposition it.
The blue arrows that appear when you hover over a shape work a little differently inside a tree layout shape. If you click on a left or right arrow, you'll add a sibling shape connected to the same parent shape.
Note: you can also embed container shapes inside other container shapes.
Open this org chart in our online diagram viewer
Publish and share your org chart
You can export your org chart to an image file (.png, .jpg, .svg) or HTML to embed it in a webpage, or to a PDF file for printing.
- Click File > Export As, then choose the format you want.
- Change the export options if necessary, then click Export.
If you want to share your diagram, you can publish it as a link or export it as a URL. If it's not too complex, the entire diagram will be encoded in the link that is generated - no need to send files back and forth.
Auto-create org charts
Large org charts can become out of date very quickly, especially if they have to be manually updated whenever staff leave or new staff join a company. With draw.io, you can create org charts quickly from text or CSV data exported from a employee management system (EMS).
Create an org chart from a simple text list
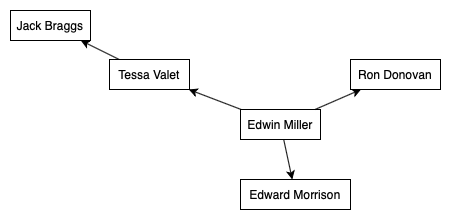
You can create your org chart quickly in a text file with parent node labels connected to children with arrows (->), one per line, and paste it into draw.io. For example:
Edwin Miller
Edwin Miller->Ron Donovan
Edwin Miller->Edward Morrison
Edwin Miller->Tessa Valet
Tessa Valet->Jack Braggs
- Click on Arrange > Insert > Advanced > From Text.
- From the drop down selector next to the Close button, select Diagram.
- Select all of the sample text in the dialog and paste in your own text. Then click Insert to create a radial tree.
Use the automatic layout tools described above (Arrange > Insert > Layout > Org Chart) to change the layout as needed.
Learn more about creating a variety of diagrams automatically from text
Create an org chart from CSV data
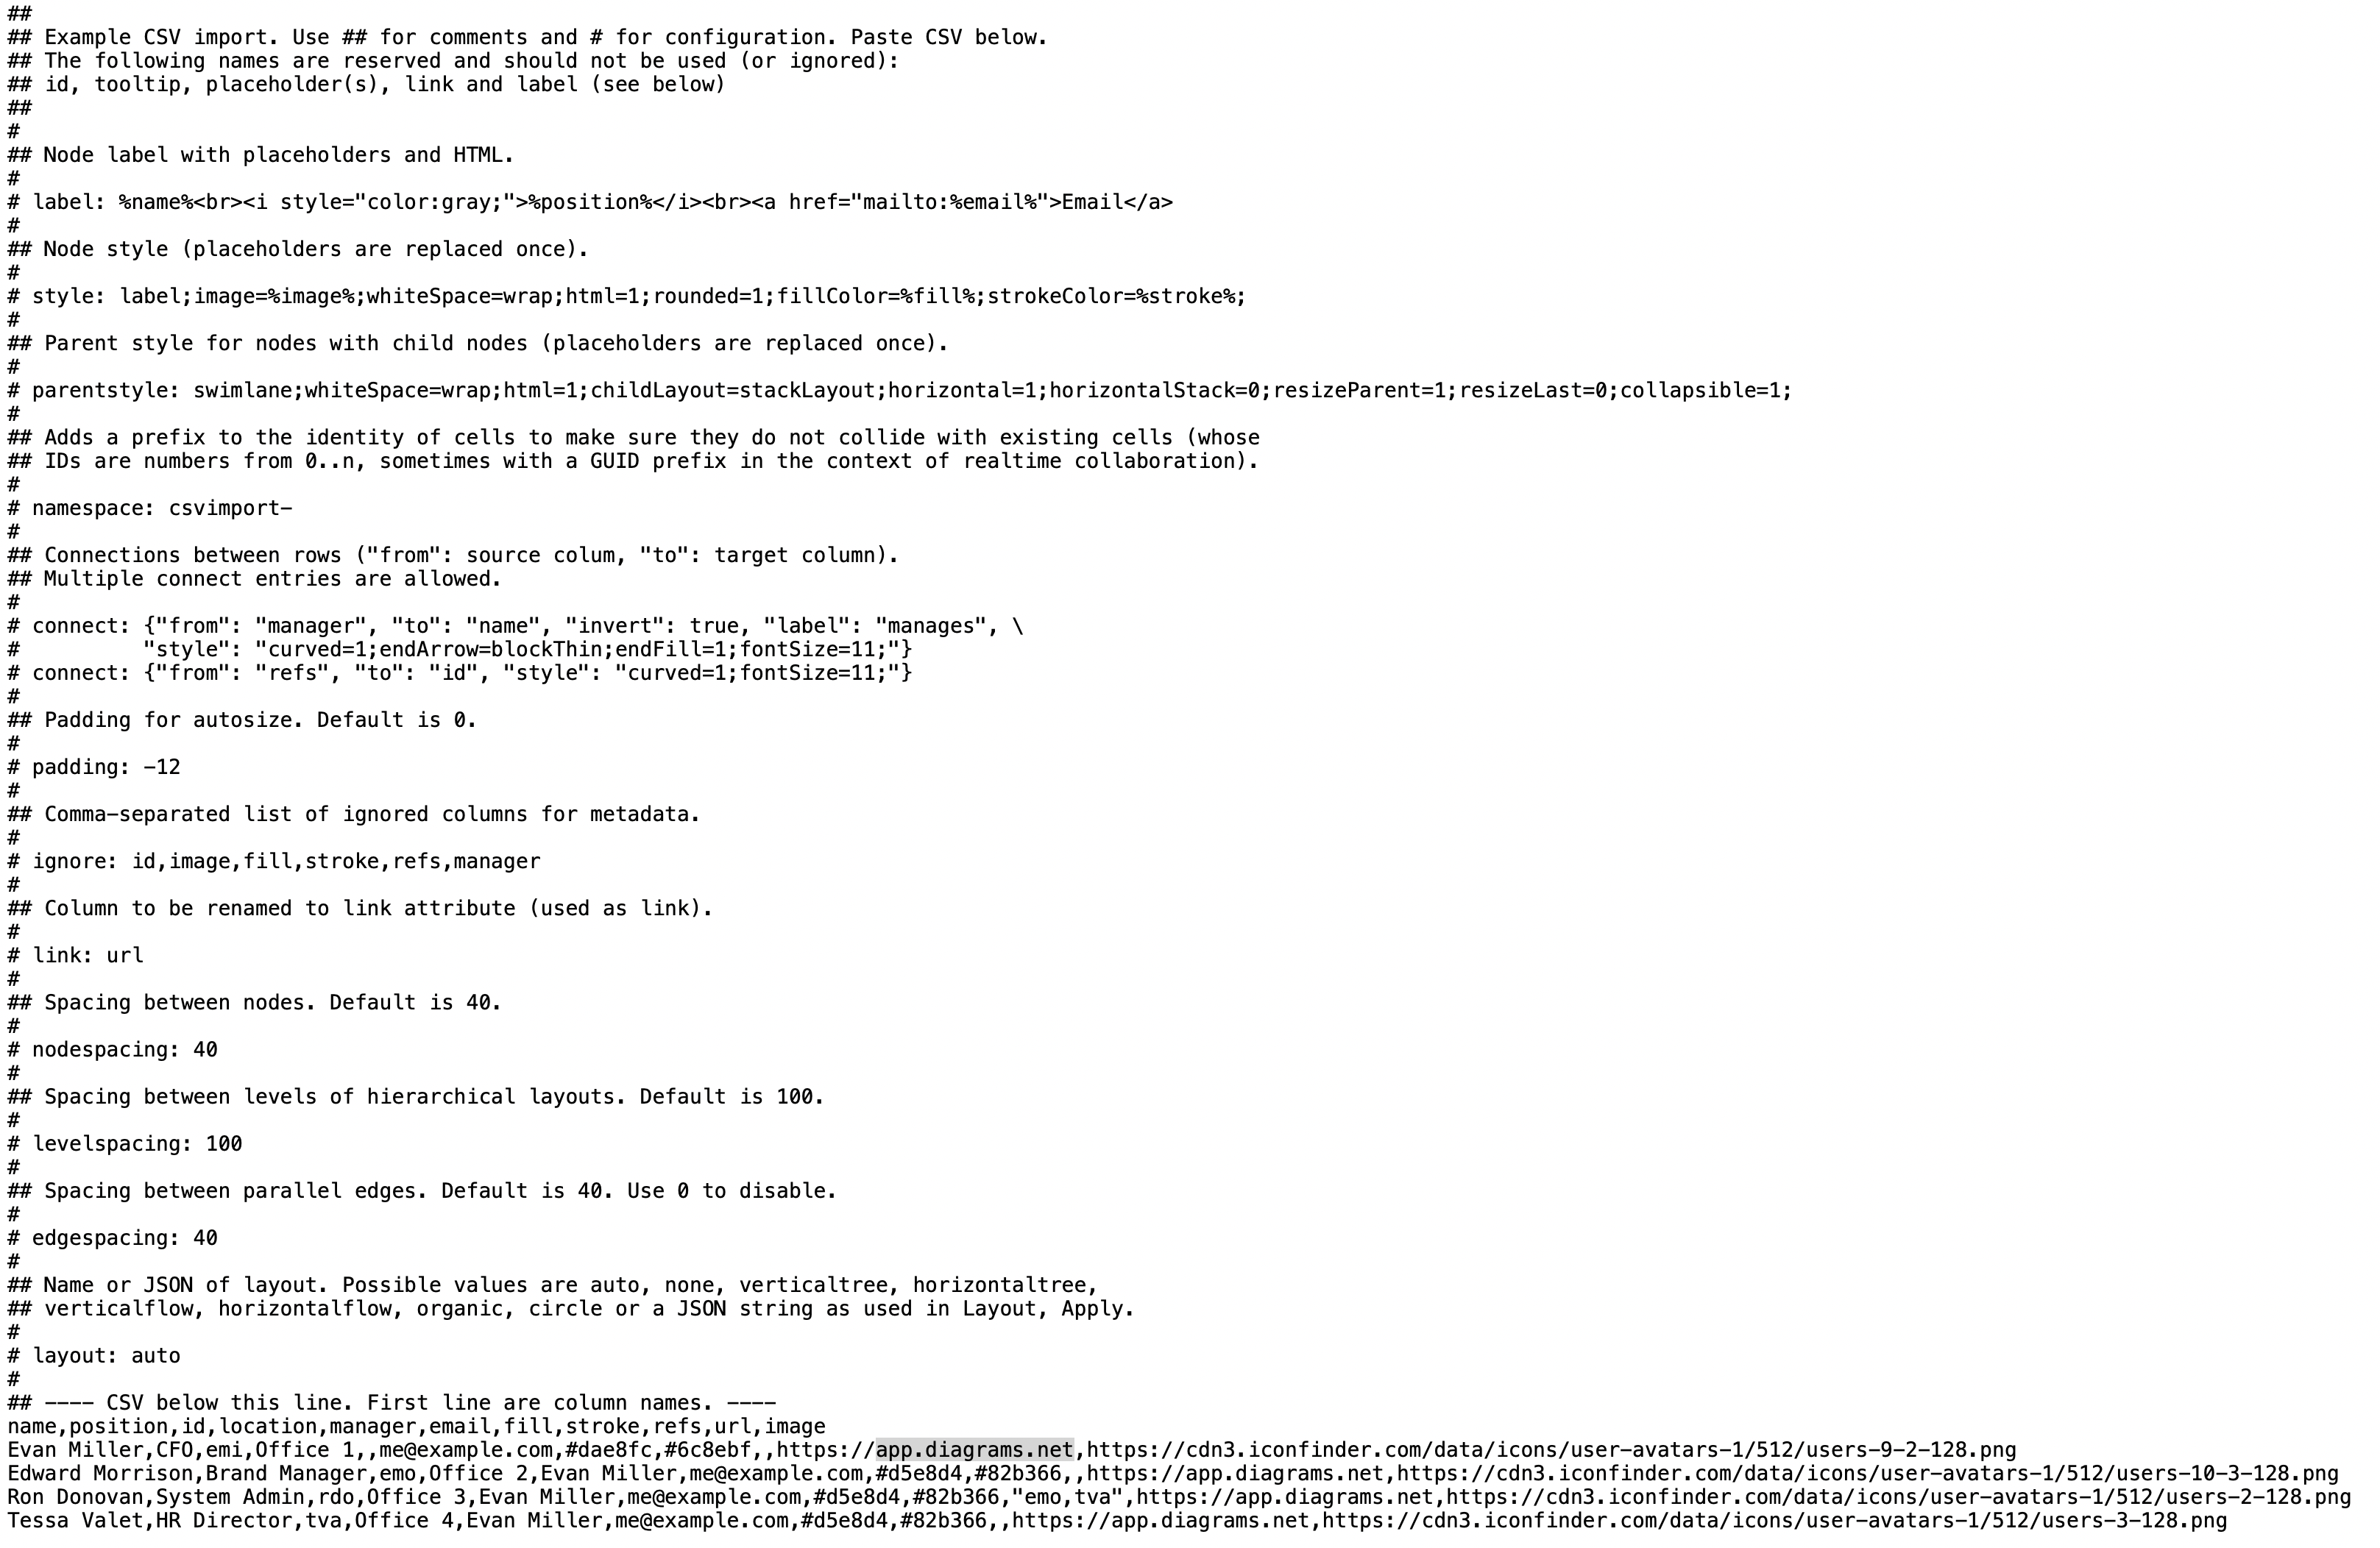
Most employee management systems (EMS) allow you to export to CSV files. This CSV data can be paired with formatting and layout information (described in text) and inserted into a draw.io org chart.
Select Arrange > Insert > Advanced > CSV.
The example CSV data and formatting code is of a more complex org chart, using image and text labels with names, roles, linked email addresses, as well as additional metadata that appears in a tooltip when you hover over each employee's node.
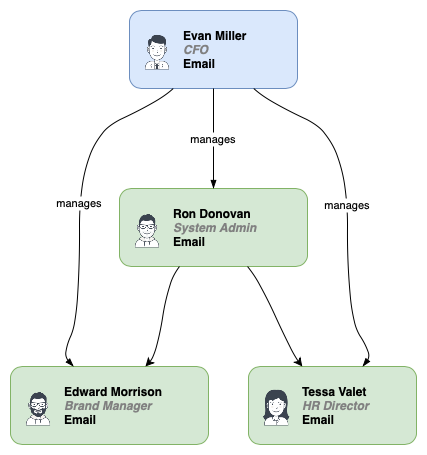
Open this org chart in our online diagram viewer
Use this example to create and format your own org chart using the CSV data exported from your EMS.
Tip: You don't need to display all of the columns in your CSV file in your org chart. Add # ignore: columnX, columnY to the diagram configuration section above the CSV data.
Related
If you want to show more than just a hierarchy, there are other types of diagrams you could use:
- Matrix management diagrams show how people report to more than one supervisor in a cross-functional, cross-business model.
- Role and responsibility diagrams to show reporting and responsibility structures in an organisation.
- Organigraphs represent the relationships between departments by connecting nodes based on processes and not just on reporting hierarchies.
- Flow charts may be used to show the communication, project development, or release authorisation flows in a company, which are not possible in a traditional org chart.