Story mapping
User story diagrams are quite strongly related to UML use case diagrams, and both are used in an agile software development context. Both types of diagrams are used to explore and document customer requirements, they identify different groups of users and their goals, but they are used in different ways.
Use case diagrams
A use case diagram shows all of the ways an end-user interacts with your systems, with all of its pre- and post-conditions, exceptions and alternate paths. These diagrams are used to establish your system requirements, whether that be a software system or an interaction with another person or team.
UML use case diagrams are not used for scheduling or broad planning purposes as they are highly technical and specific, but instead function as the foundation for a system's technical documentation.
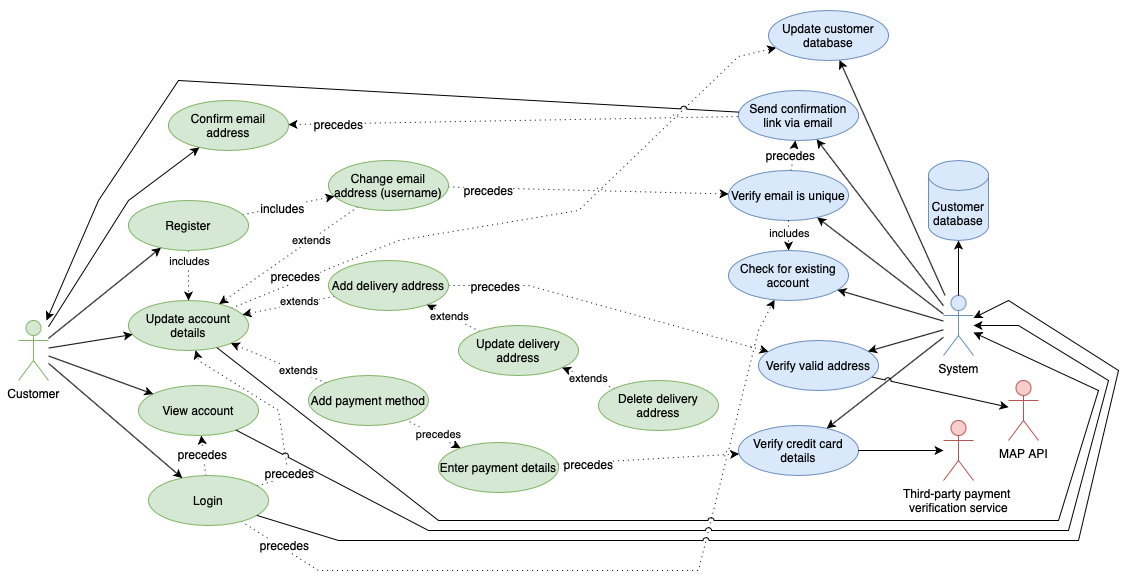
Customer updates their account - open this use case diagram our online diagram viewer
User stories or story maps
A user story captures what a user needs to do and why, from the user's point of view. They are written very simply in natural language:
As an [actor] I want to do [action] to achieve a [goal].
For example:
- As a manufacturer, I want to minimise tool changes to optimise the production line and thus reduce costs.
- As a customer, I want to order groceries online (to avoid going to the shops and to enjoy my meals).
- As a software developer, I want to do remote pair programming to write better code.
As the customer is not interested in the technical implementation of your systems, user stories are not used to detail system requirements, leaving room for you to explore alternative solutions and systems to better meet the customer's needs.
Who draws story maps?
Many different types of teams find story mapping to be a flexible and useful planning tool to keep improvements and development focused strongly on the prioritised needs of their customers.
- Software development - prioritise and schedule coding tasks.
- Marketing - plan advertising campaigns that attract customers.
- HR - improve hiring and onboarding processes and systems.
- Factory managers - optimise an assembly station or an ntire production line.
- Product designers - plan incremental improvements to an existing product.
- ITS - improve data and network security and stability.
- ...
Such customer-focused stories are very popular in agile development, where user stories (epics), are broken into smaller tasks (stories) or implementation steps. This lets agile teams better estimate and plan development projects. Smaller tasks can be easily prioritised and scheduled into Scrum backlogs and sprints.
Story maps on a whiteboard
Story mapping is traditionally done with sticky notes on a whiteboard in some kind of a grid layout, which is not really usable when you work in distributed teams.
In today's remote world, you can replicate this with an online whiteboard in draw.io using table shapes, containers with swimlanes (such as those used for cross-functional flowcharts), or even just rectangles arranged on the drawing canvas.
Start story mapping in draw.io with our online editor at app.diagrams.net
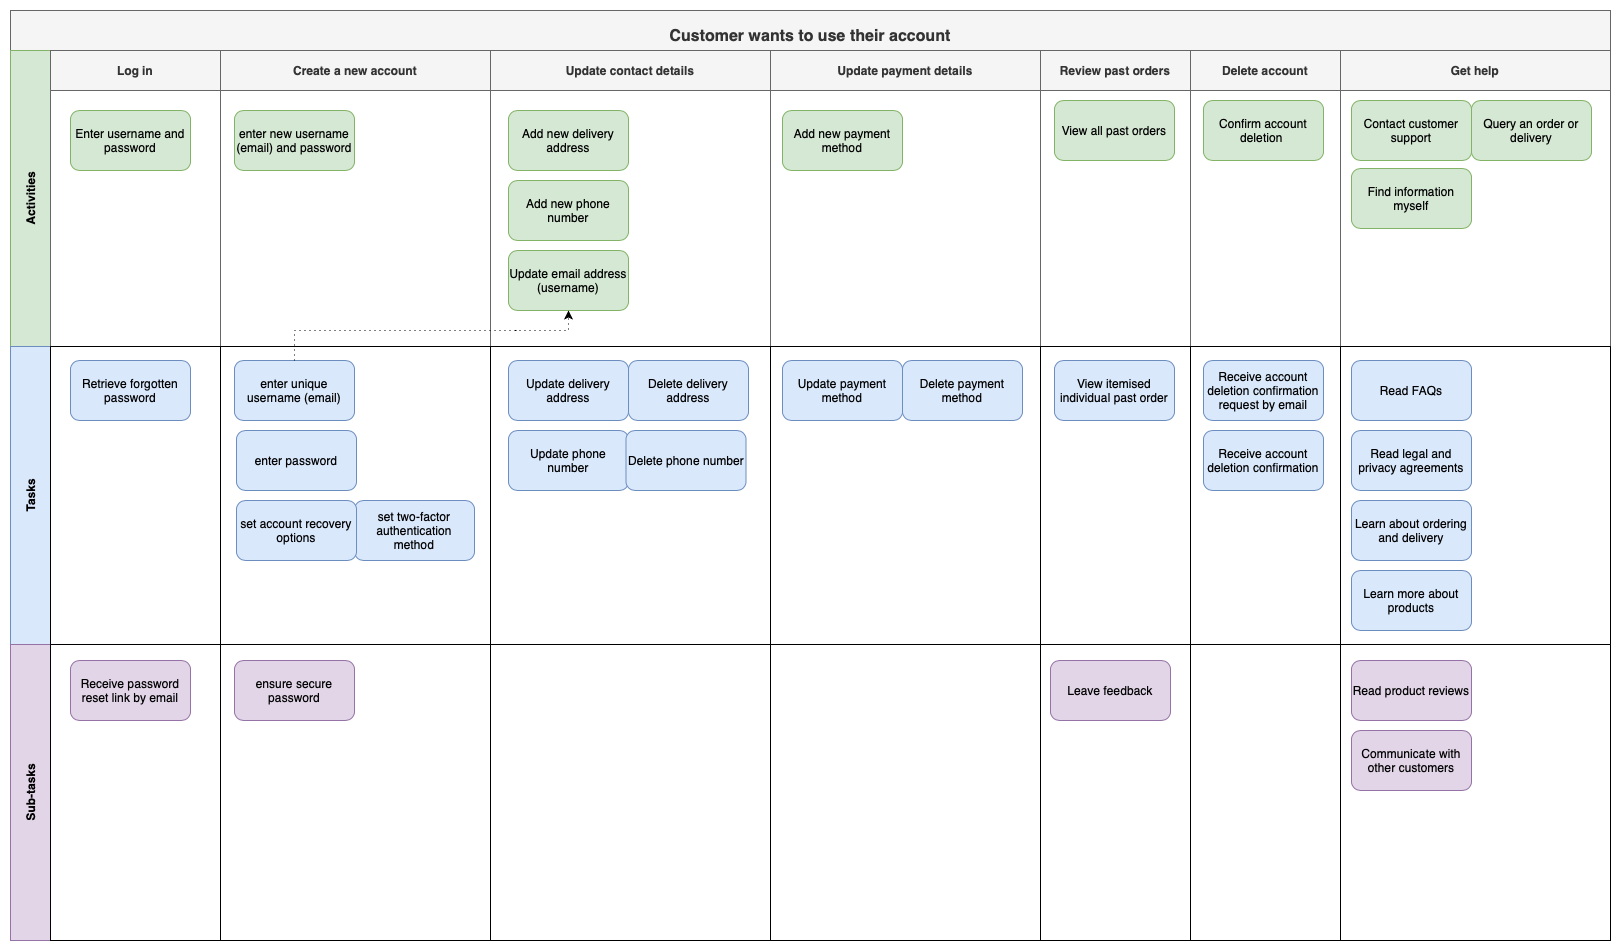
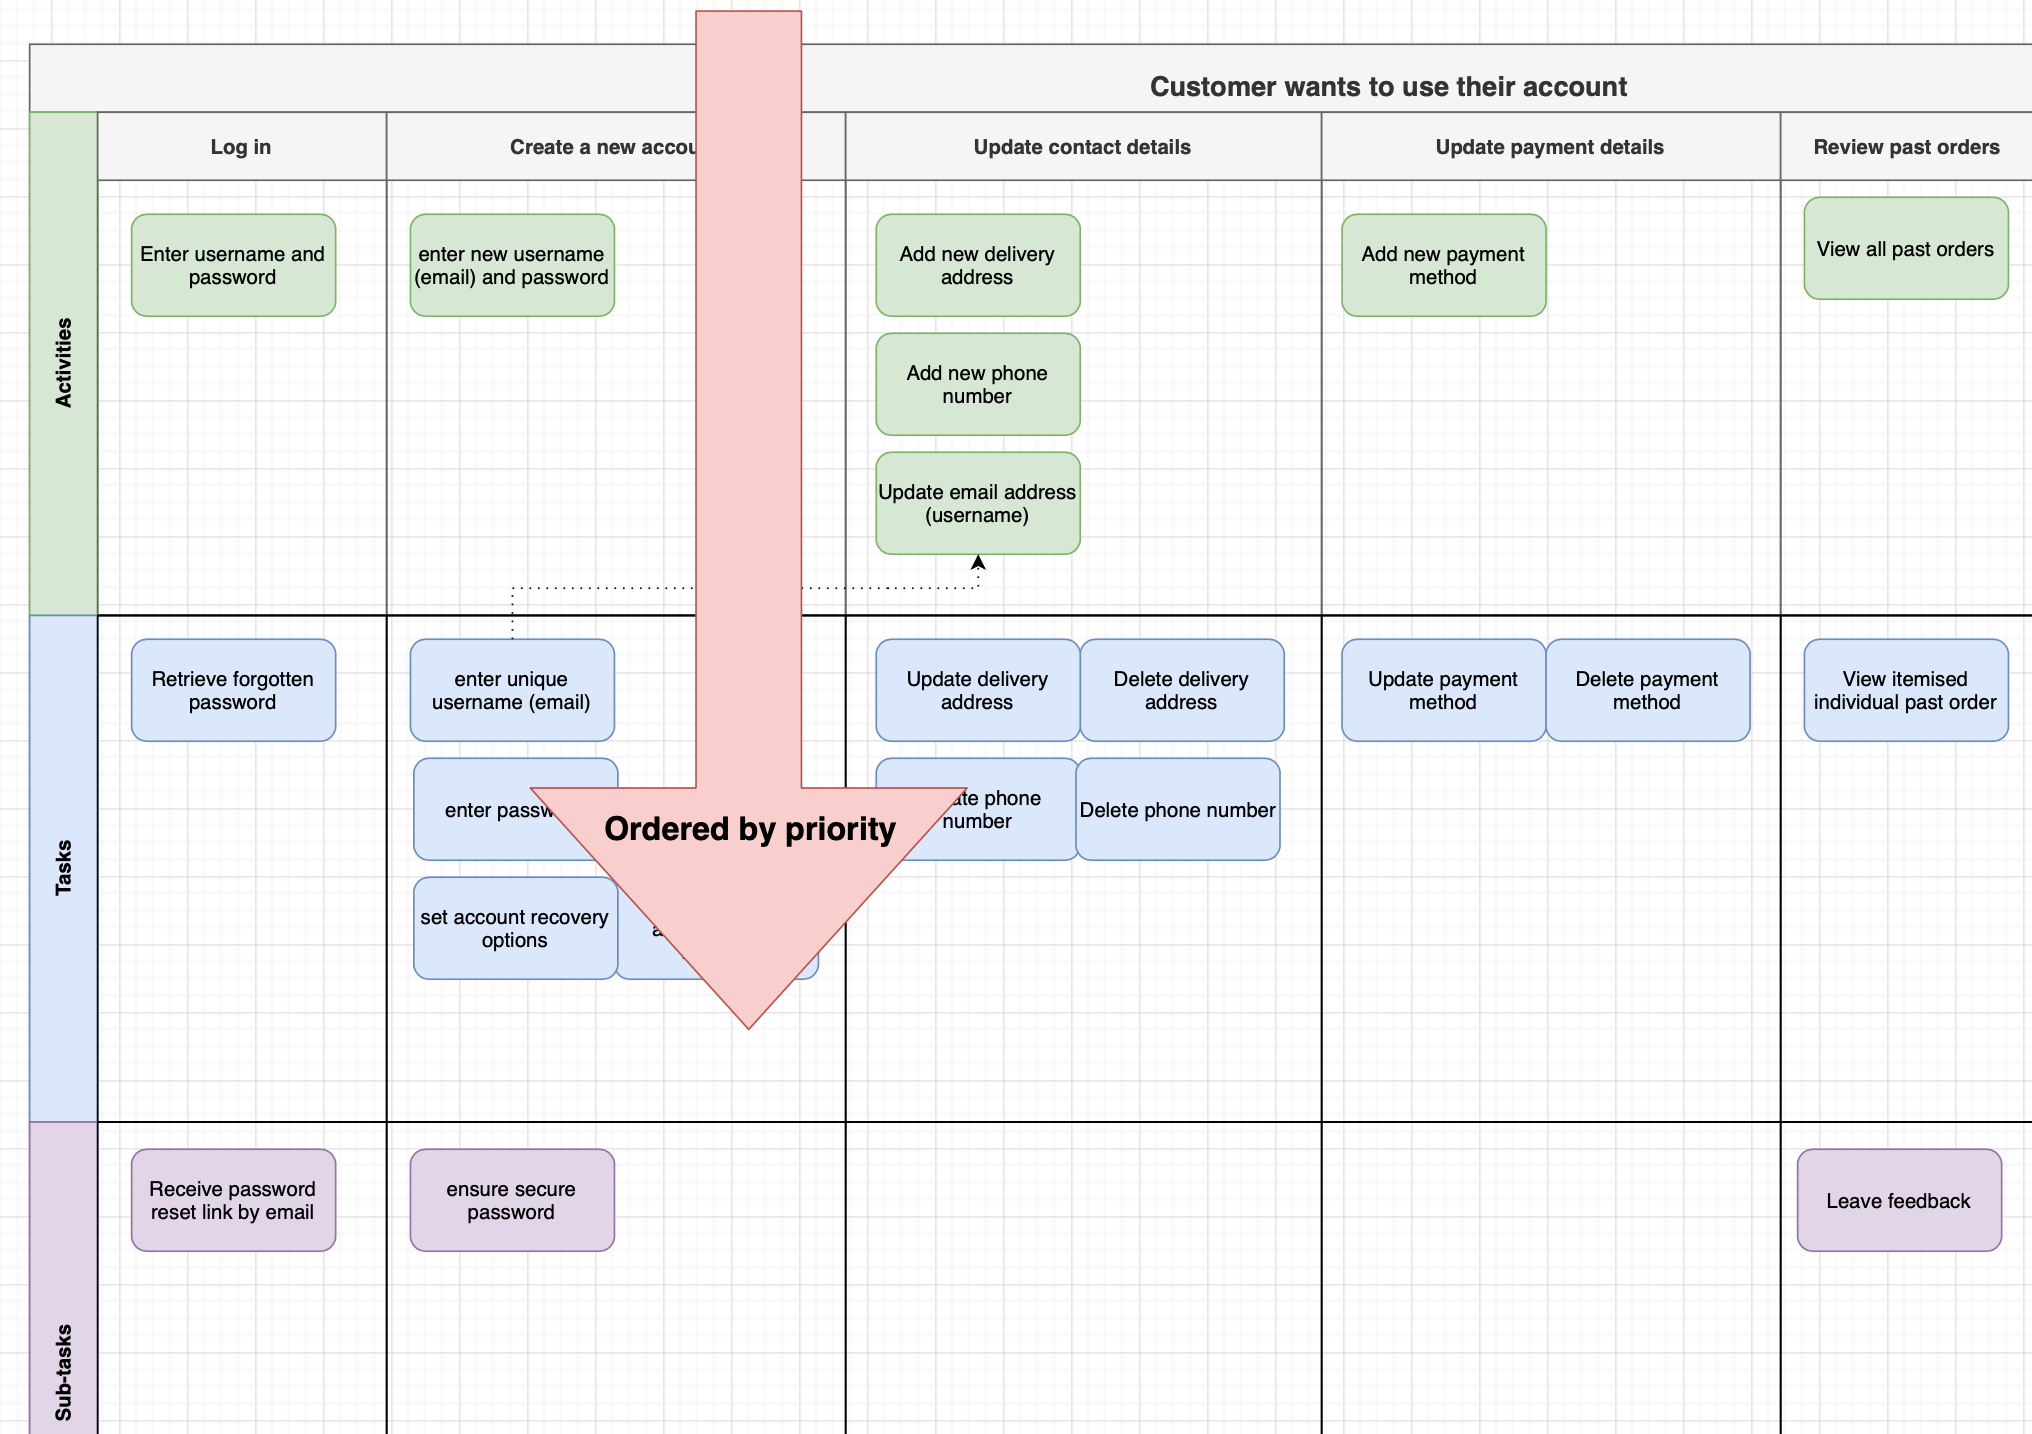
Open this story map in our diagram viewer
Story mapping an activity that the customer wants to complete (update their account) should not include the technical details. This story map is constructed in a cross-functional flowchart shape.
How to structure a story map
Understand your customers
Identify their goals and the broad activities they want to do to reach their goals. These activities top of your map are the big stories - main actions that have many steps. Put them in the top row of a table shape or cross-functional flowchart with swimlanes from the Advanced shape library.
For example, As a [customer], I want to [order groceries online].
Break activities into smaller steps
Customers must complete these smaller tasks to achieve their goal: browse products, add product to shopping cart, select delivery window, enter payment details, and so on. There may or may not be a definite workflow, and tasks can be broken down into smaller sub-tasks when they are too large.
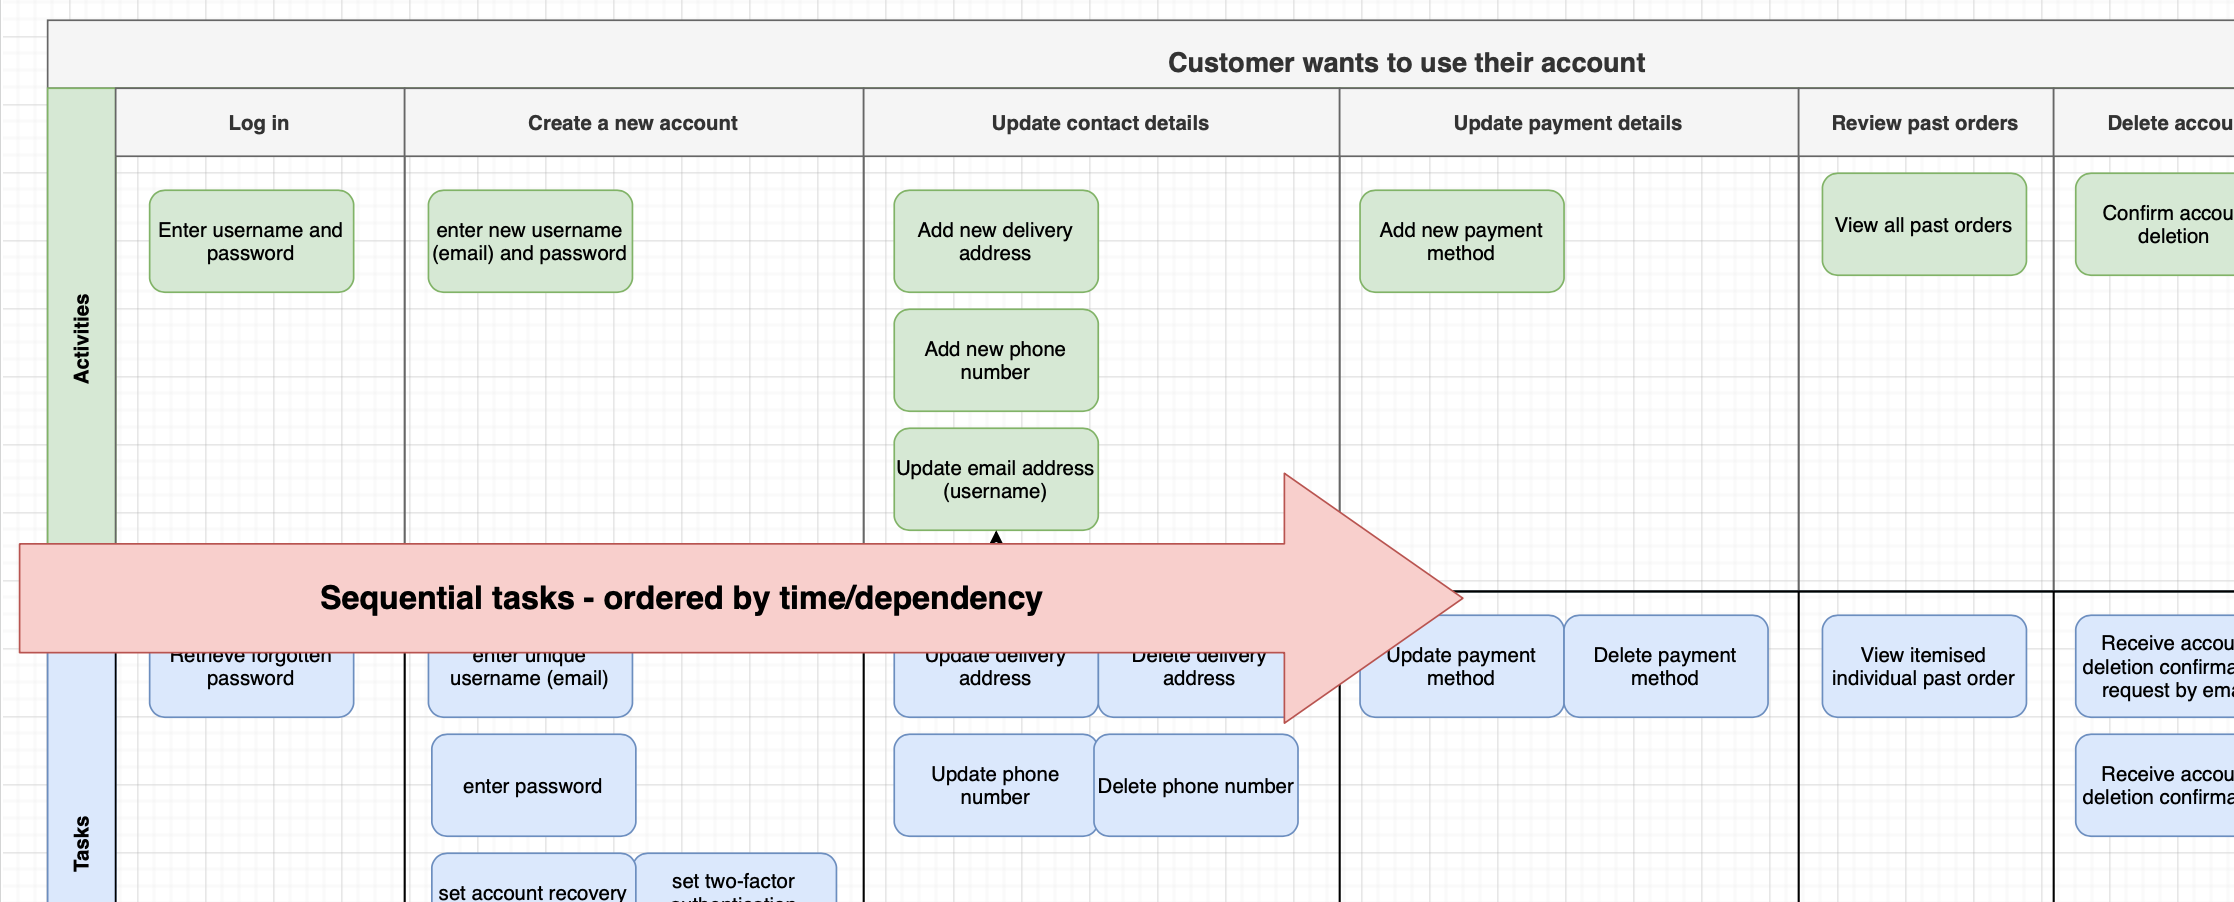
Organise the tasks and subtasks sequentially
Arrange the smaller tasks and sub-tasks sequentially underneath their activities in order from left to right (or whichever way you prefer to read your diagrams). This can show the order in which your customer completes the activities and tasks.
Prioritise the tasks and subtasks
Indicate the priority of the tasks/subtasks by arranging them vertically - more important tasks are higher in the story map.
Tips for useful story maps
- Tasks that don't need to be performed in any order or those which have an equal priority can be organised in the way that makes the most sense to you and your team.
- Keep the technical details out of your diagram though - technical details are better documented in UML or other more detailed diagrams.
- The simpler the shapes you use in your story map, the easier it will be to create and use.
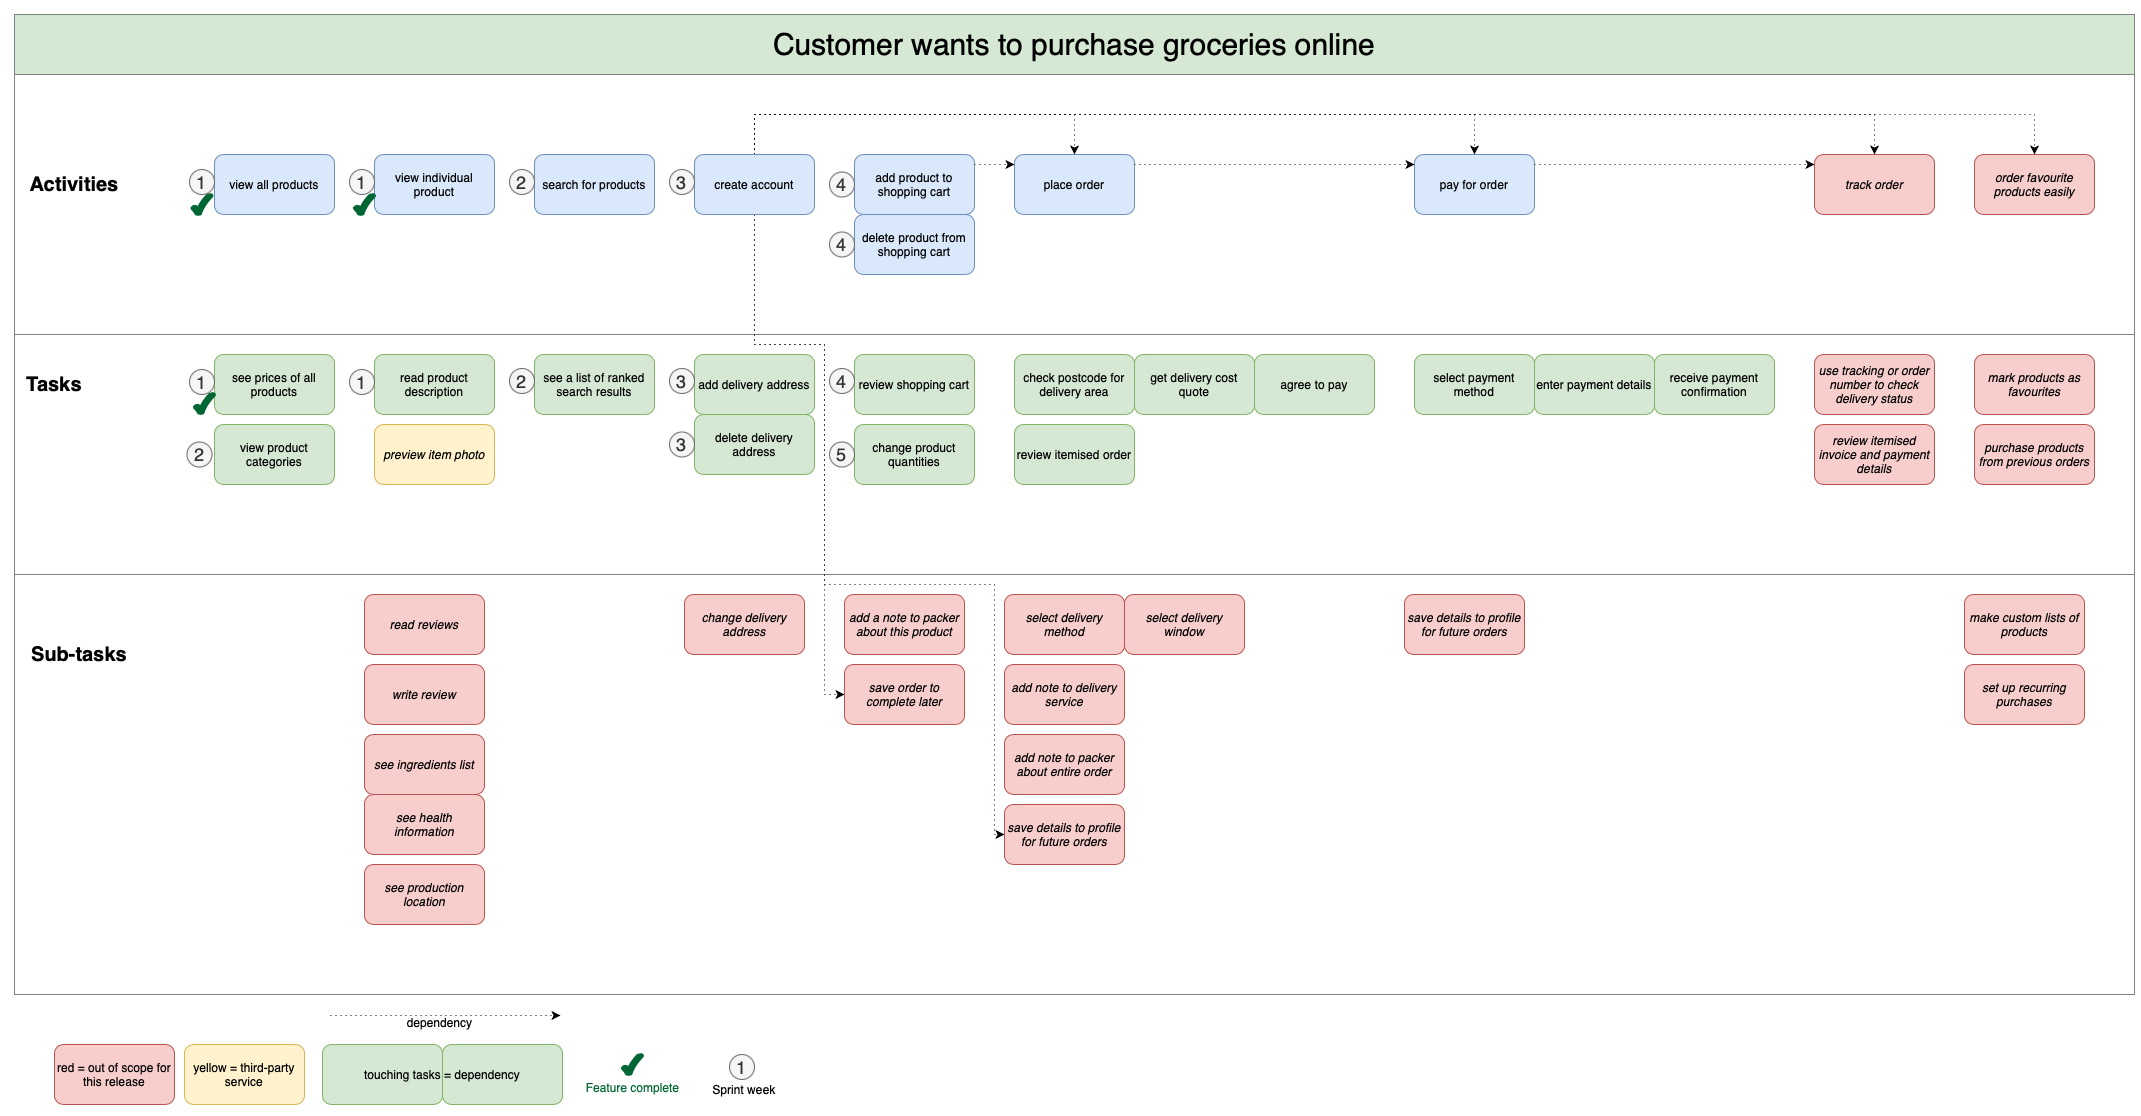
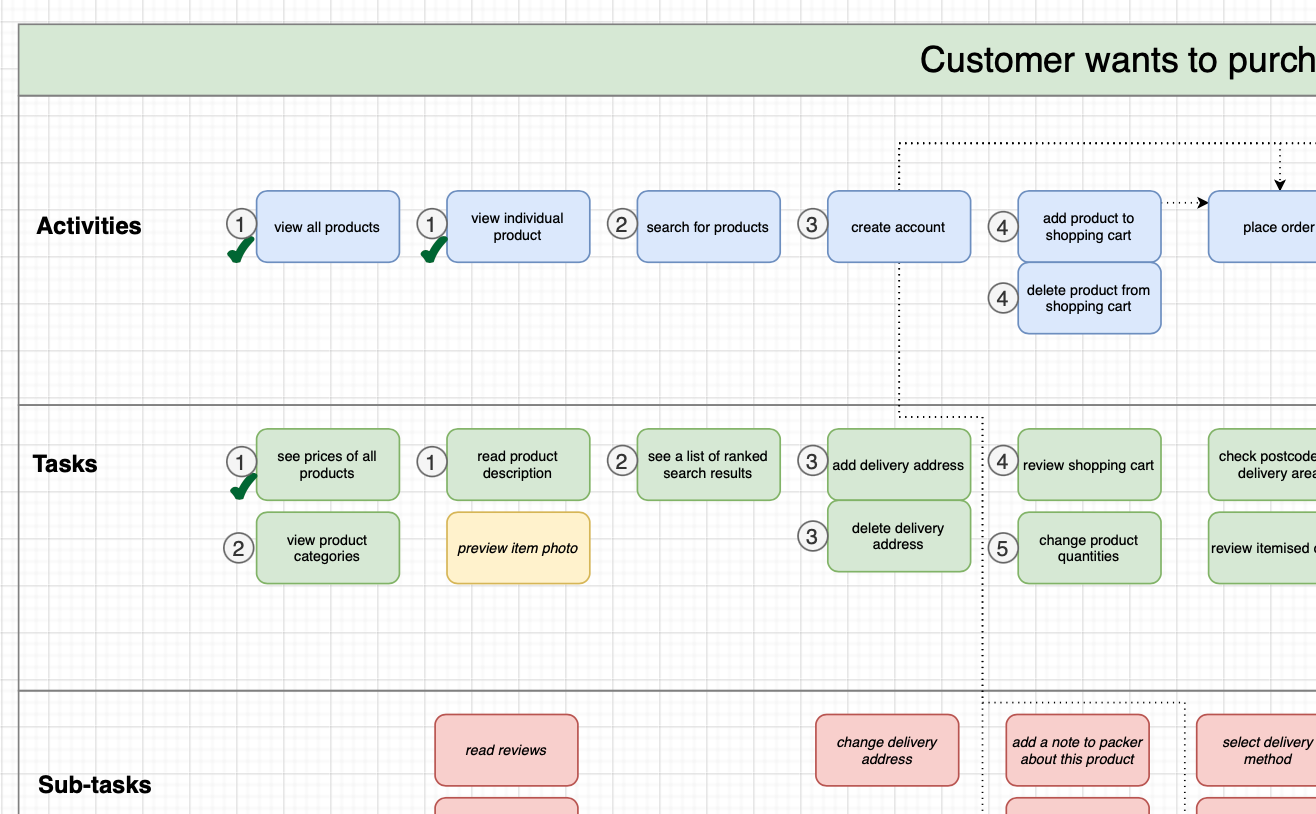
Open this story map in our diagram viewer
This story map of a customer who wants to purchase groceries online uses simple shapes from the General shape library.
Update your story map throughout development
Your story map can work as a visual roadmap showing both the work you have completed, what is remaining and planned and what is out of scope.
Take the unimplemented tasks and subtasks and distribute them into releases, iterations and sprints in your story map, noting dependencies indicated by their left-right position or dependency arrows, and their priority by their vertical position.
Re-prioritise by dragging the tasks and subtasks into new positions within their table rows or swimlanes.
Track development in your story map, just as you planned your project using it. As you complete the implementation of each task, add a shape, tooltip, colour or label, to show that a task is complete (or being tested, documented, etc.)
Indicate tasks that are out of scope for the release with a specific colour, add a shape to indicate the planned sprint and whether a task has been implemented.
Walk through your story map with your customers
You can easily share your draw.io story map from Google drive with your customers to support communication, provide a shared understanding, and generate new ideas.
Walk through the story map with them to check activity details and gain insights from your customers.