Concept maps in draw.io
Concept maps are a broad category of diagrams that are useful for brainstorming with teams, learning and training, showing hierarchical information, planning events or product campaigns, and exploring solutions to problems. They are widely used throughout all industries, especially in medicine and education.
What is a concept map?
Any type of diagram that shows relationships between concepts in a branching structure falls under the concept map umbrella. That includes mind maps, org charts, tree diagrams, cluster diagrams, thinking maps, and more.
Originally developed to support the learning process, they are now also one of the most commonly used types of diagrams in the working world.
Components of a concept map
-
One central topic or idea into sub-topics and closely related ideas.
-
Shapes like ovals, circles or rectangles for parent ideas and key sub-topics. Underlined text is often used in mindmaps for the end 'leaf' topics.
-
A top-down tree structure or radial branches out from one central idea.
-
Connectors to link related topics - these may include arrows and connector labels to show how one topic contributes or relates to another.
Create a concept map in draw.io
- Identify your main topic or root node in your concept map either at the top or center of your diagram.
- Add the related main sub-topics or key ideas around the main topic and draw a connector to them from that main topic shape.
- Keep breaking down the sub-topics into small topics or ideas, and draw connectors to show their hierarchy.
- (Optional) Style connectors in different ways to show how sub-topics and ideas relate to those in other areas of the concept map.
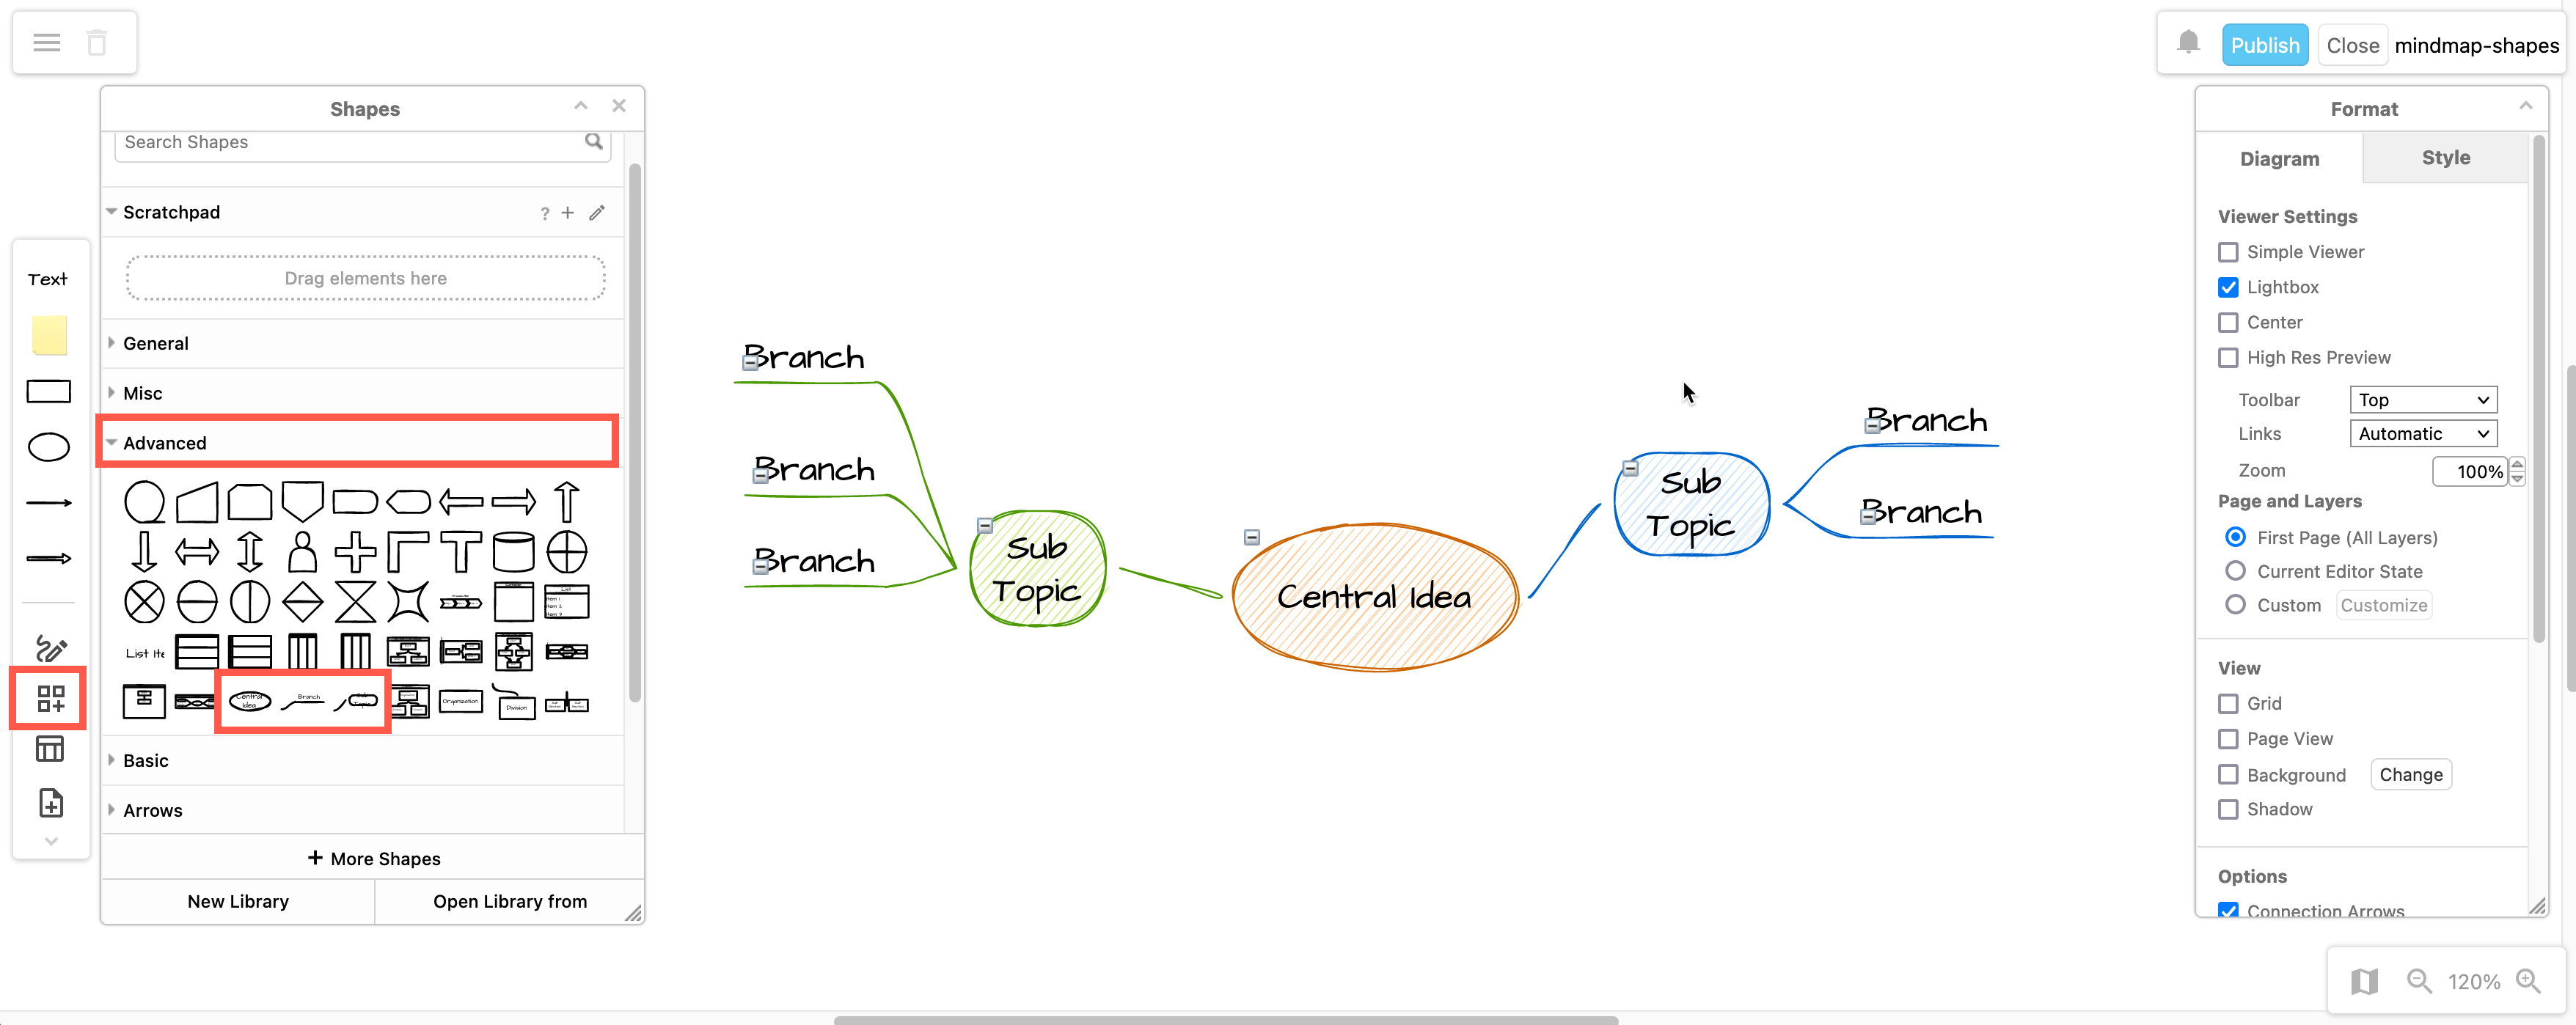
Most concept maps will use shapes from General shape library, or the Advanced shape library for specialised mindmap shapes. If you'd like to use different shapes, use the search field at the top of the shapes panel to search for shapes, clipart and icons by name.
Concept map templates
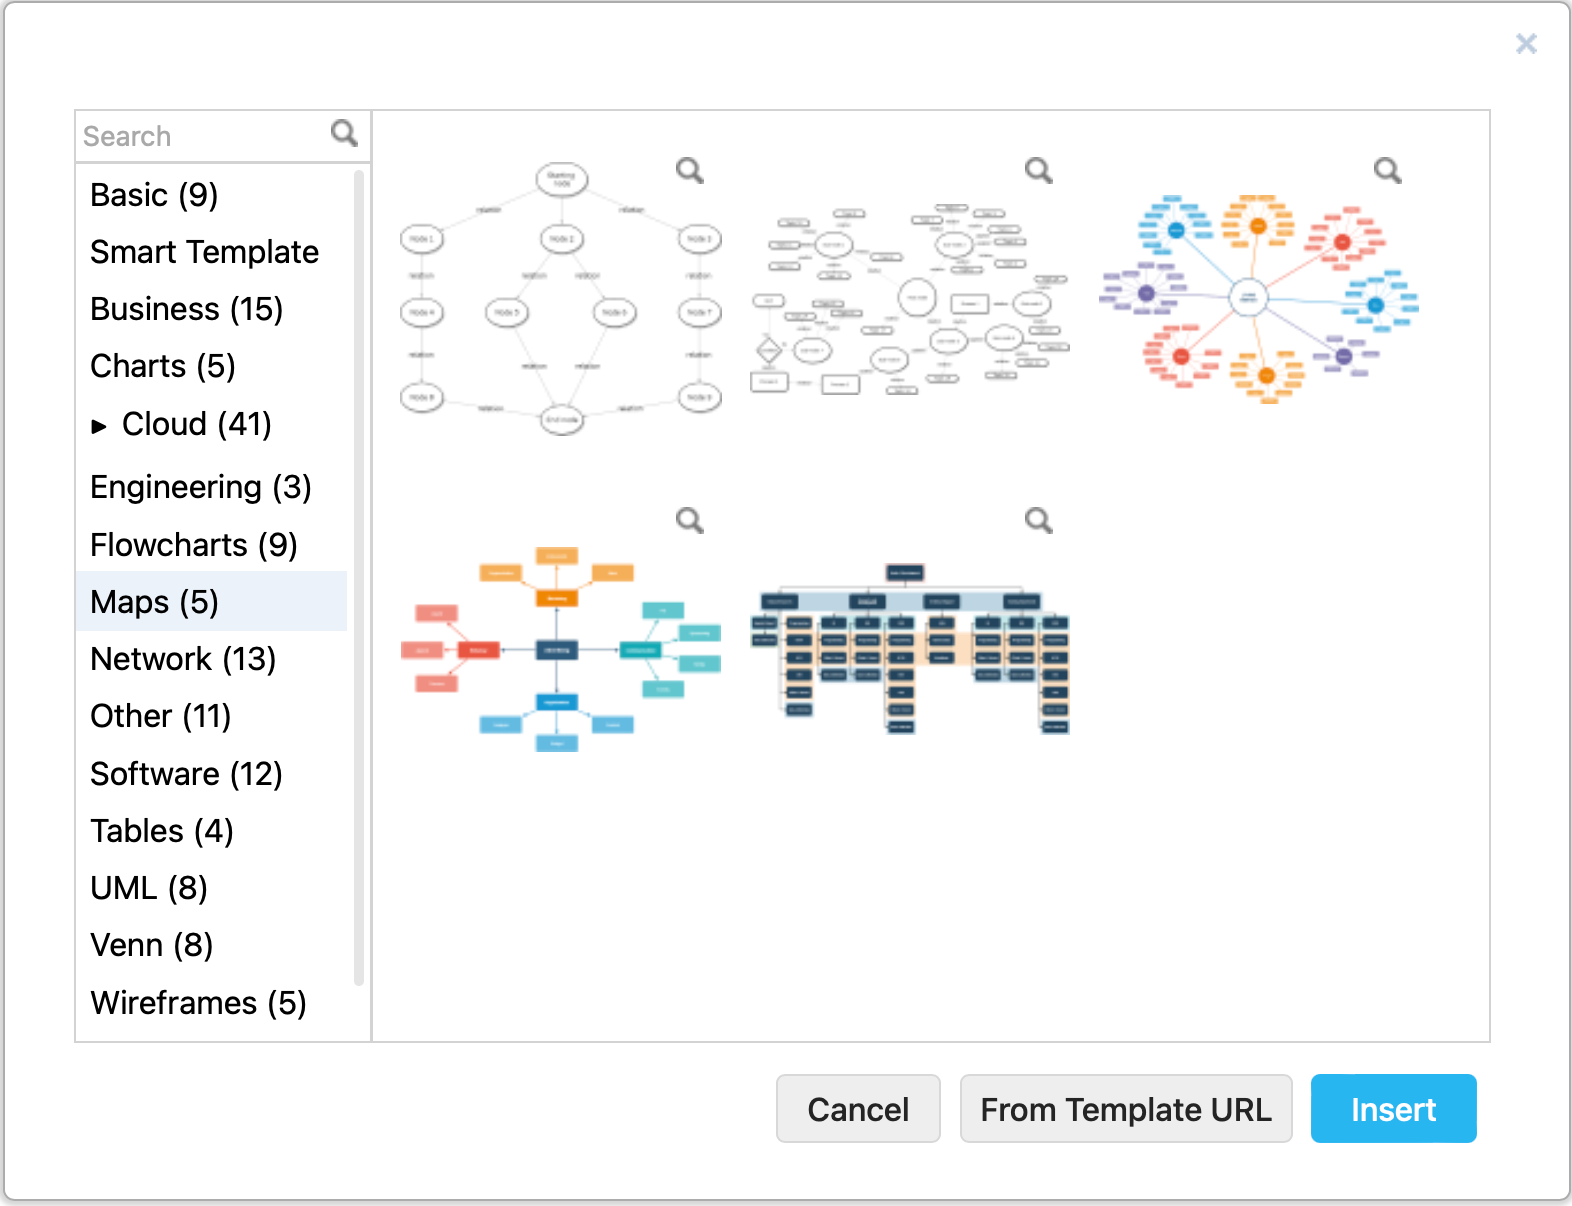
You'll find many concept map templates in the Charts template library (org charts and work breakdowns), and the Maps template library (concept maps, mindmaps and sitemaps).
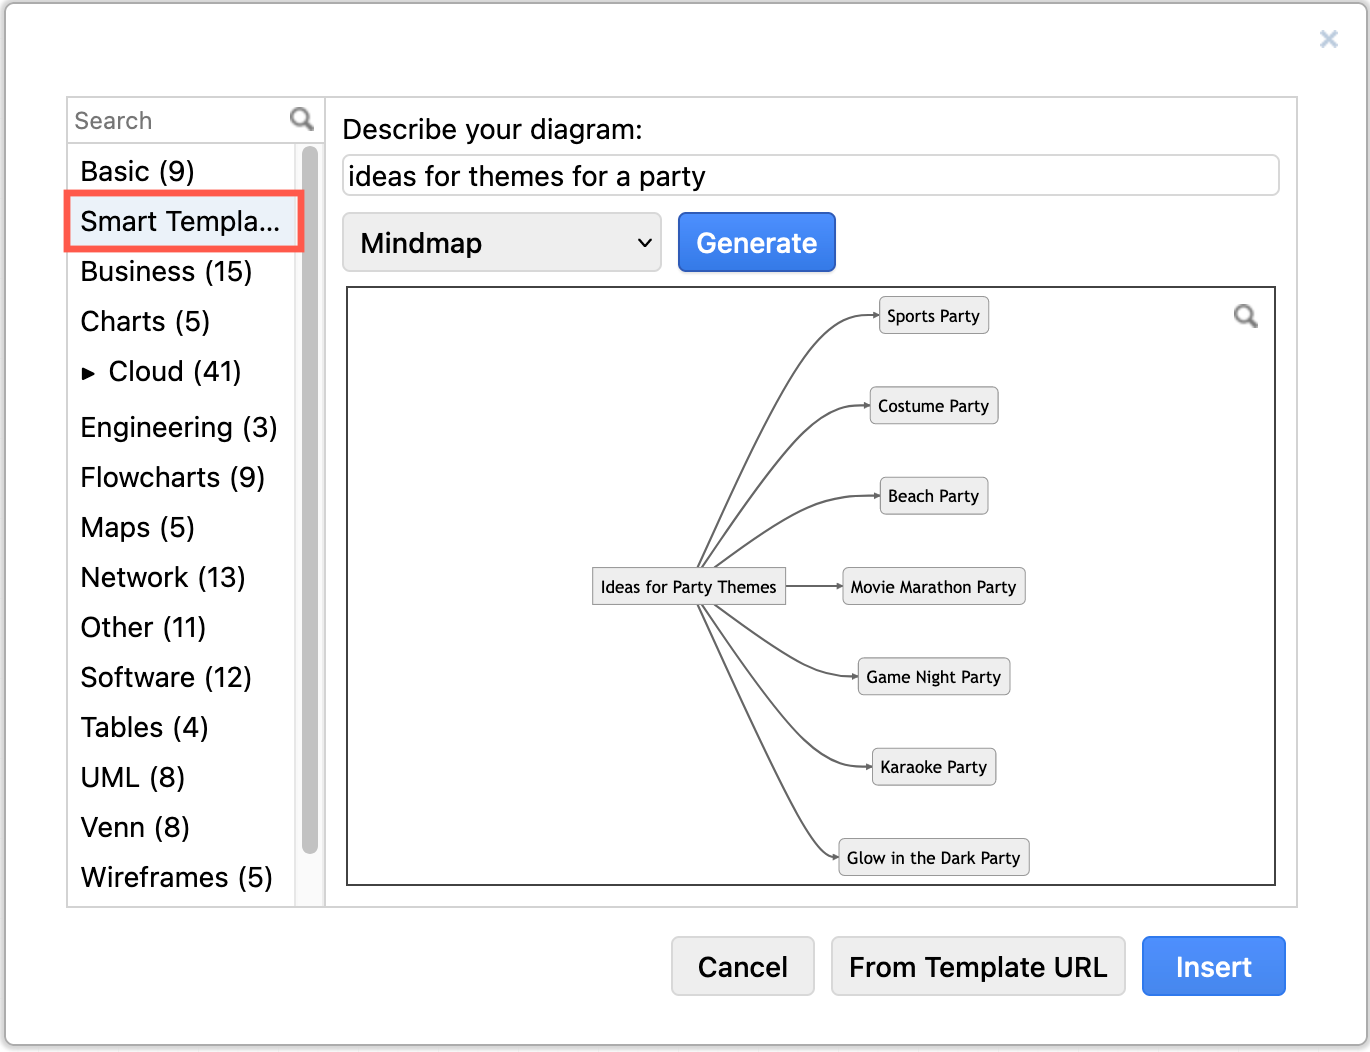
Alternatively, use the diagram generator to generate a mindmap from a short text description.
- Type
mindmapand continue to describe your diagram in text in the search omnibox in the Shapes panel. - Select Generate from the list that appears below the search field. This will open the Generate dialog.
- Once you're happy with the preview, click + under the thumbnail to add it to the drawing canvas.
Concept map examples and use cases
Here are several examples of concept maps and their use cases. Click on any of the diagrams to open them in draw.io's online viewer.
Many of these concept maps show hierarchy and explicitly relationships between concepts.
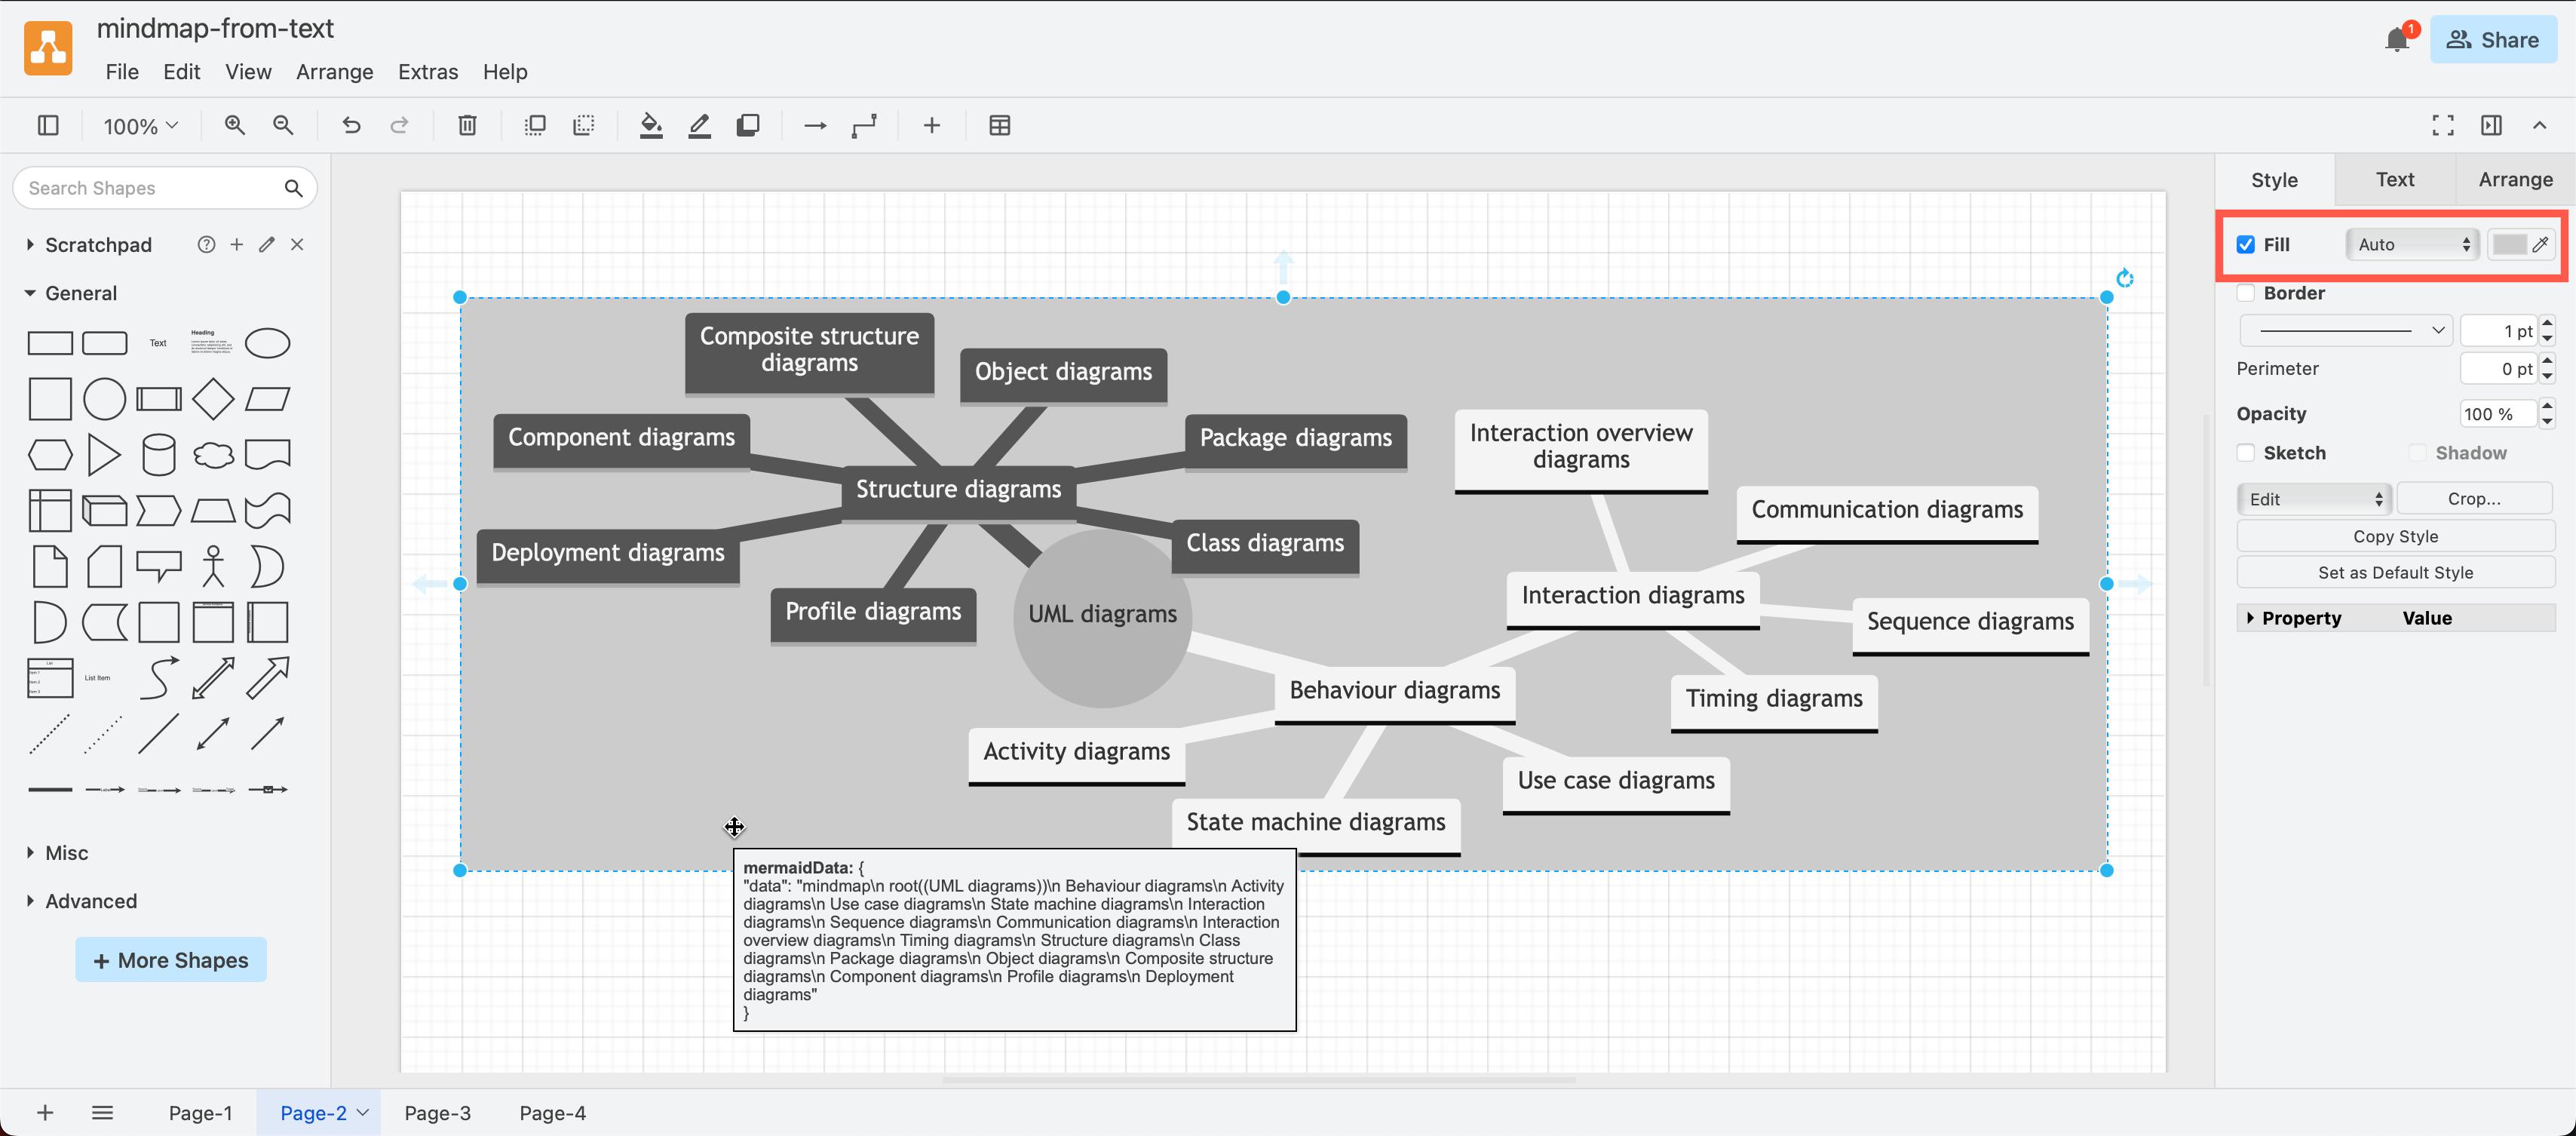
This simple concept map explains how the various types of UML diagrams are related. This diagram was created in draw.io from a text description by importing Mermaid code.
Concept mapping is taught in most medical degrees as a tool to use when making a differential diagnosis. By mapping a patient's symptoms, their test results and likely ailments, they can more accurately diagnose the underlying cause. In the example below, you can see how tests and treatments are related to causes, and which symptoms strongly suggest either a mechanism or underlying cause.
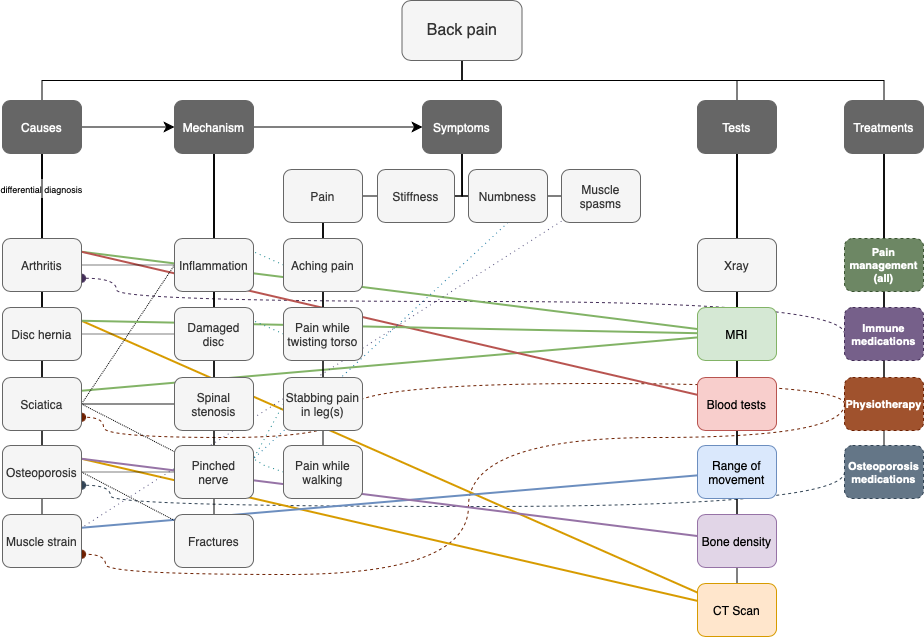
Use this same concept mapping approach to diagnose problems and investigate solutions in many other industries.
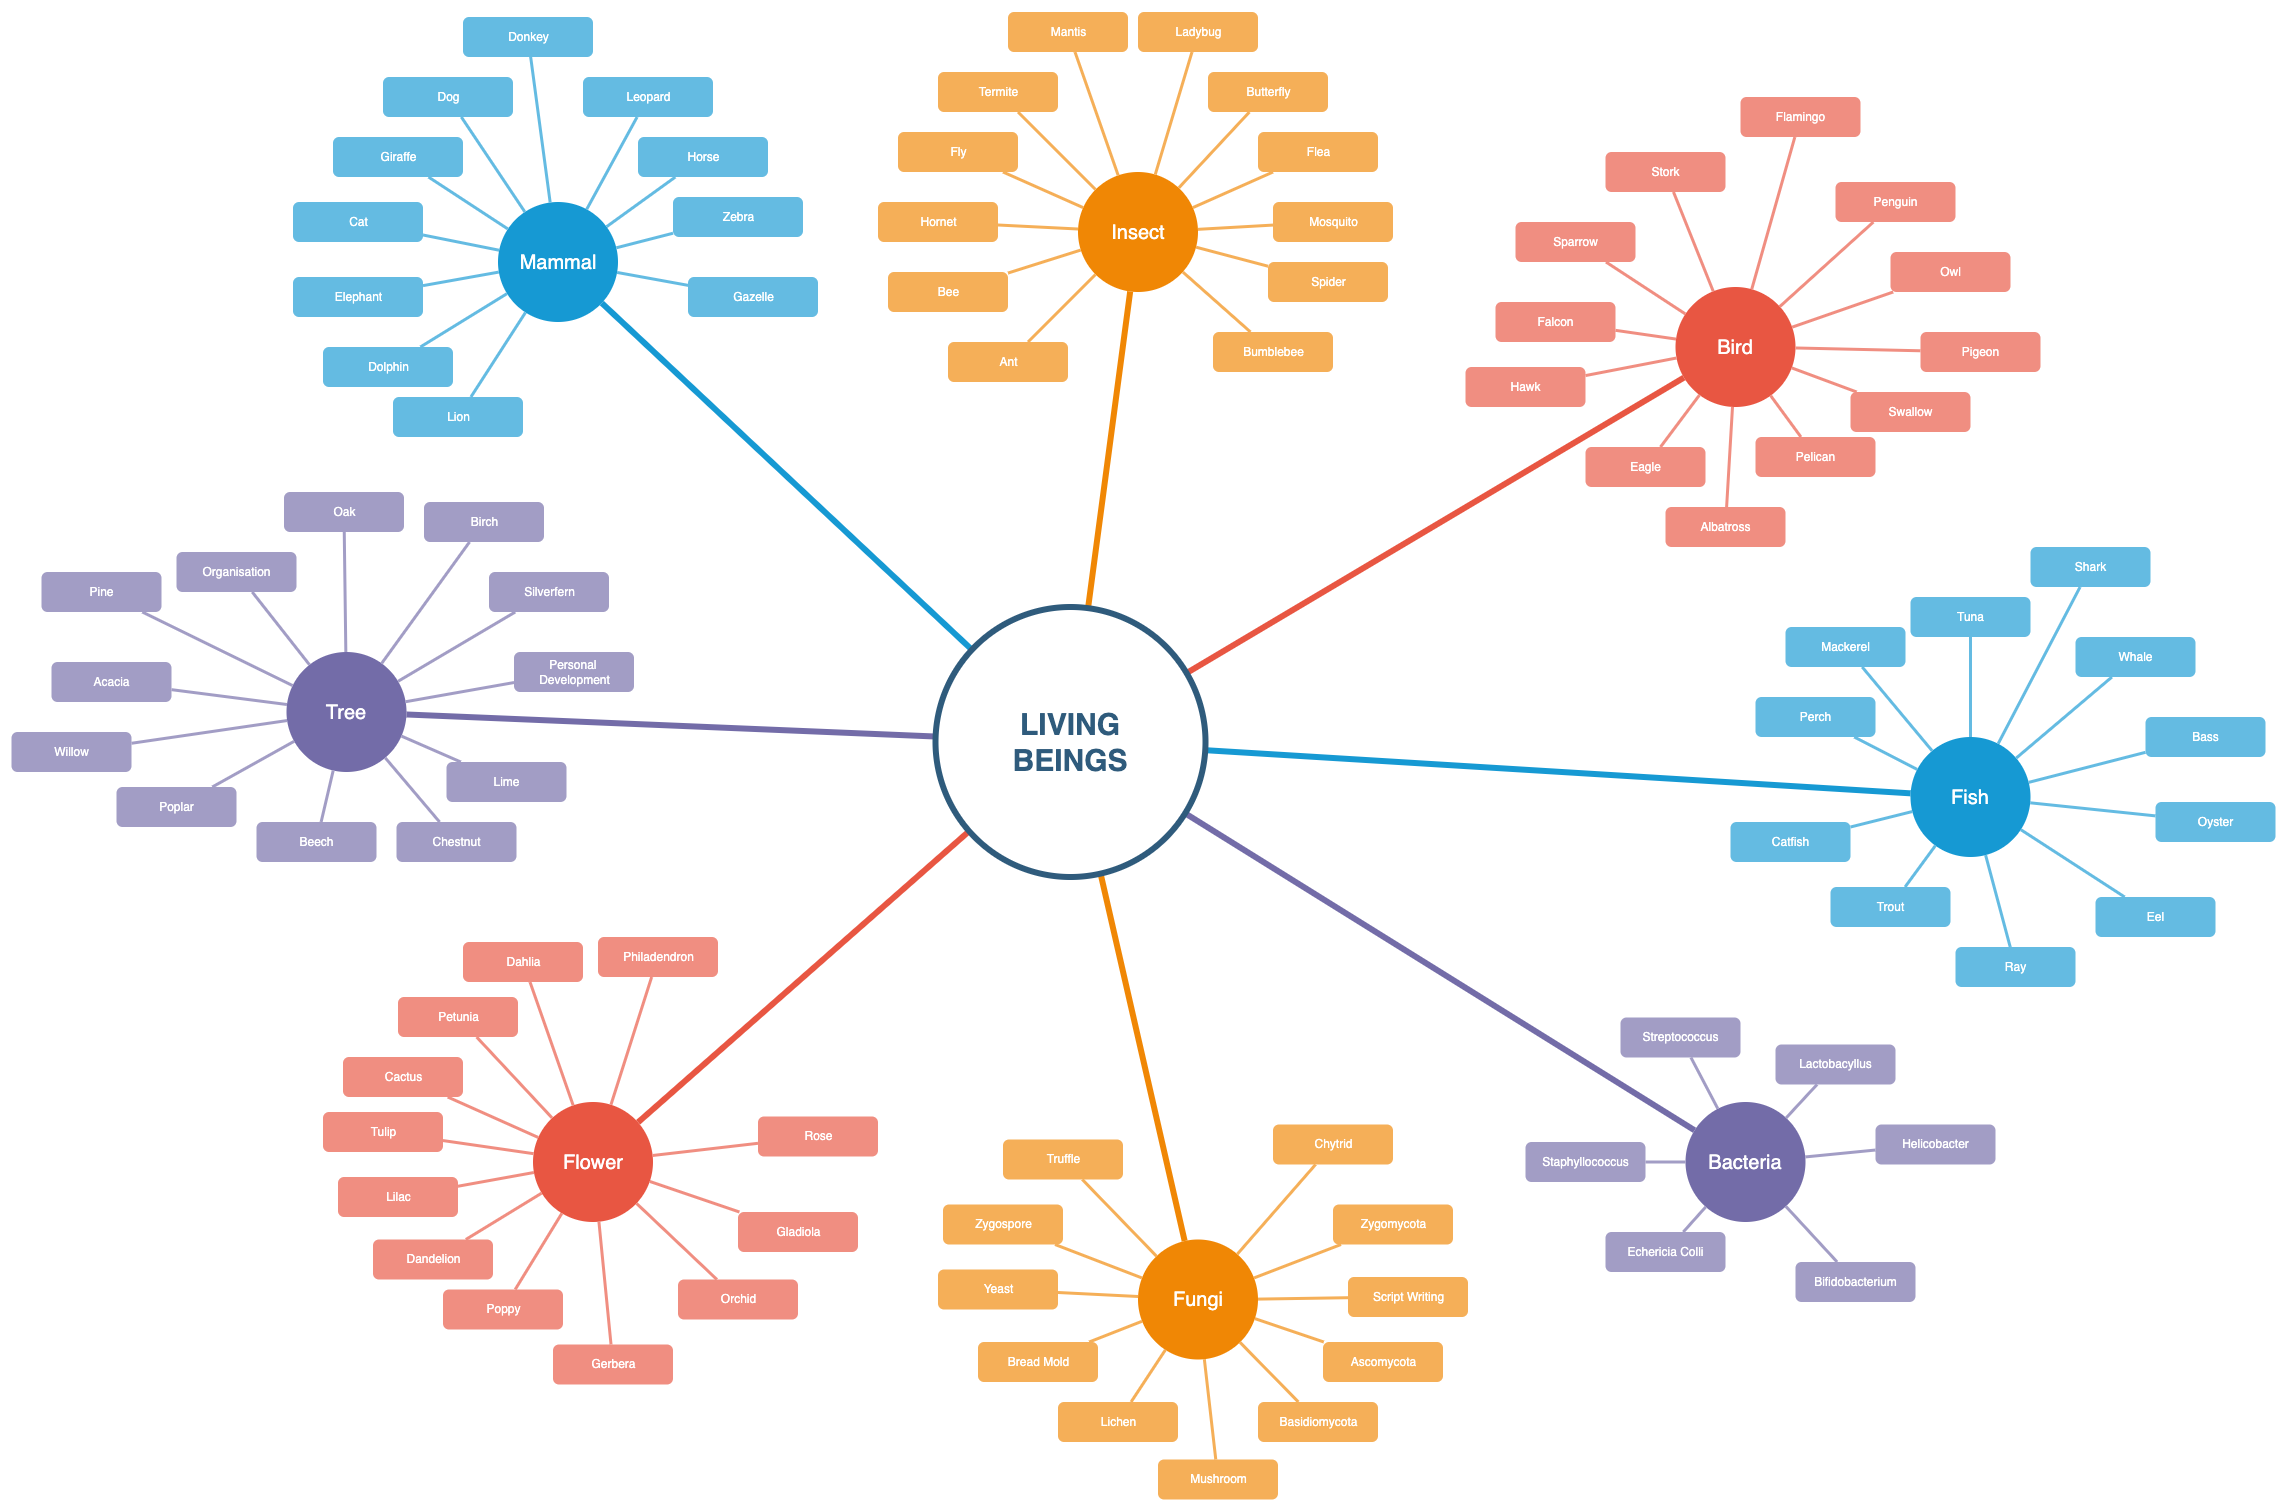
The following concept map (cluster map) is available as a template in the Maps category in the draw.io template library.
Organisation charts
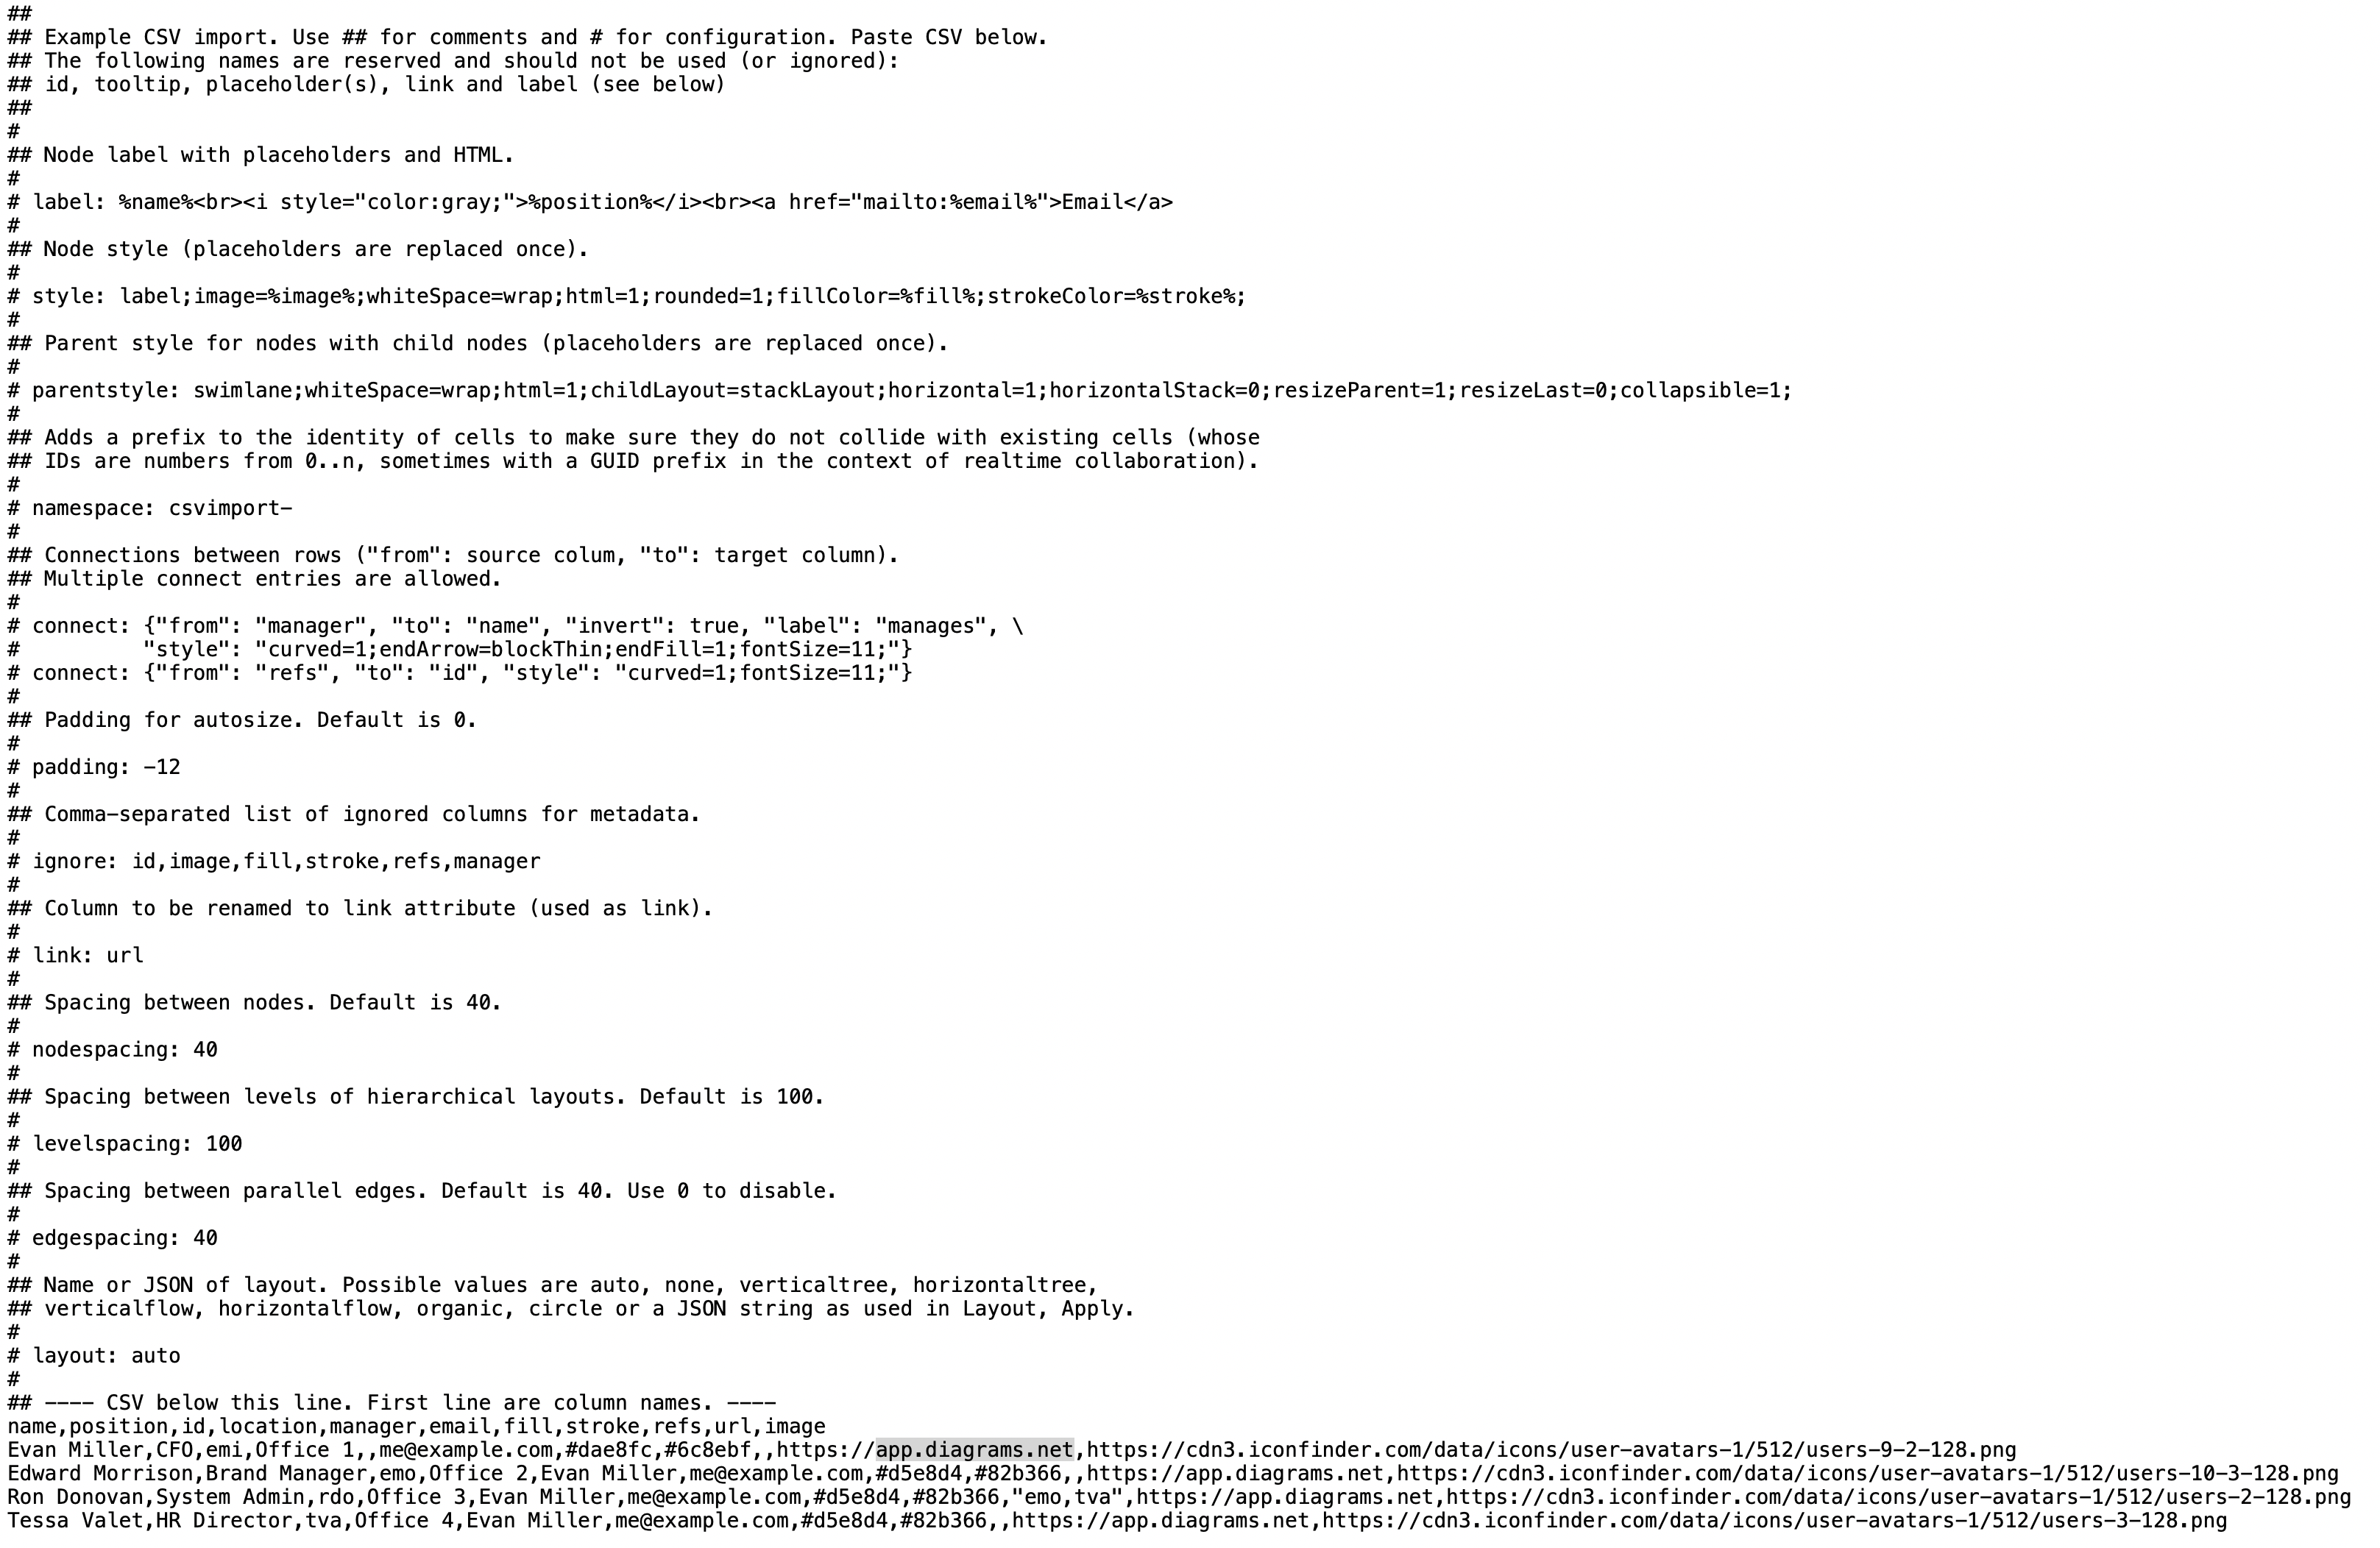
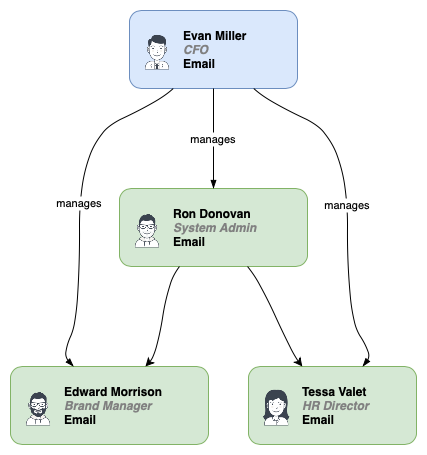
Org charts are another type of concept map which can show both hierarchy and relationships across roles or teams. This particular org chart was generated from CSV spreadsheet data with additional formatting information via Arrange > Insert > CSV in the draw.io menu.
Concept maps in marketing and development
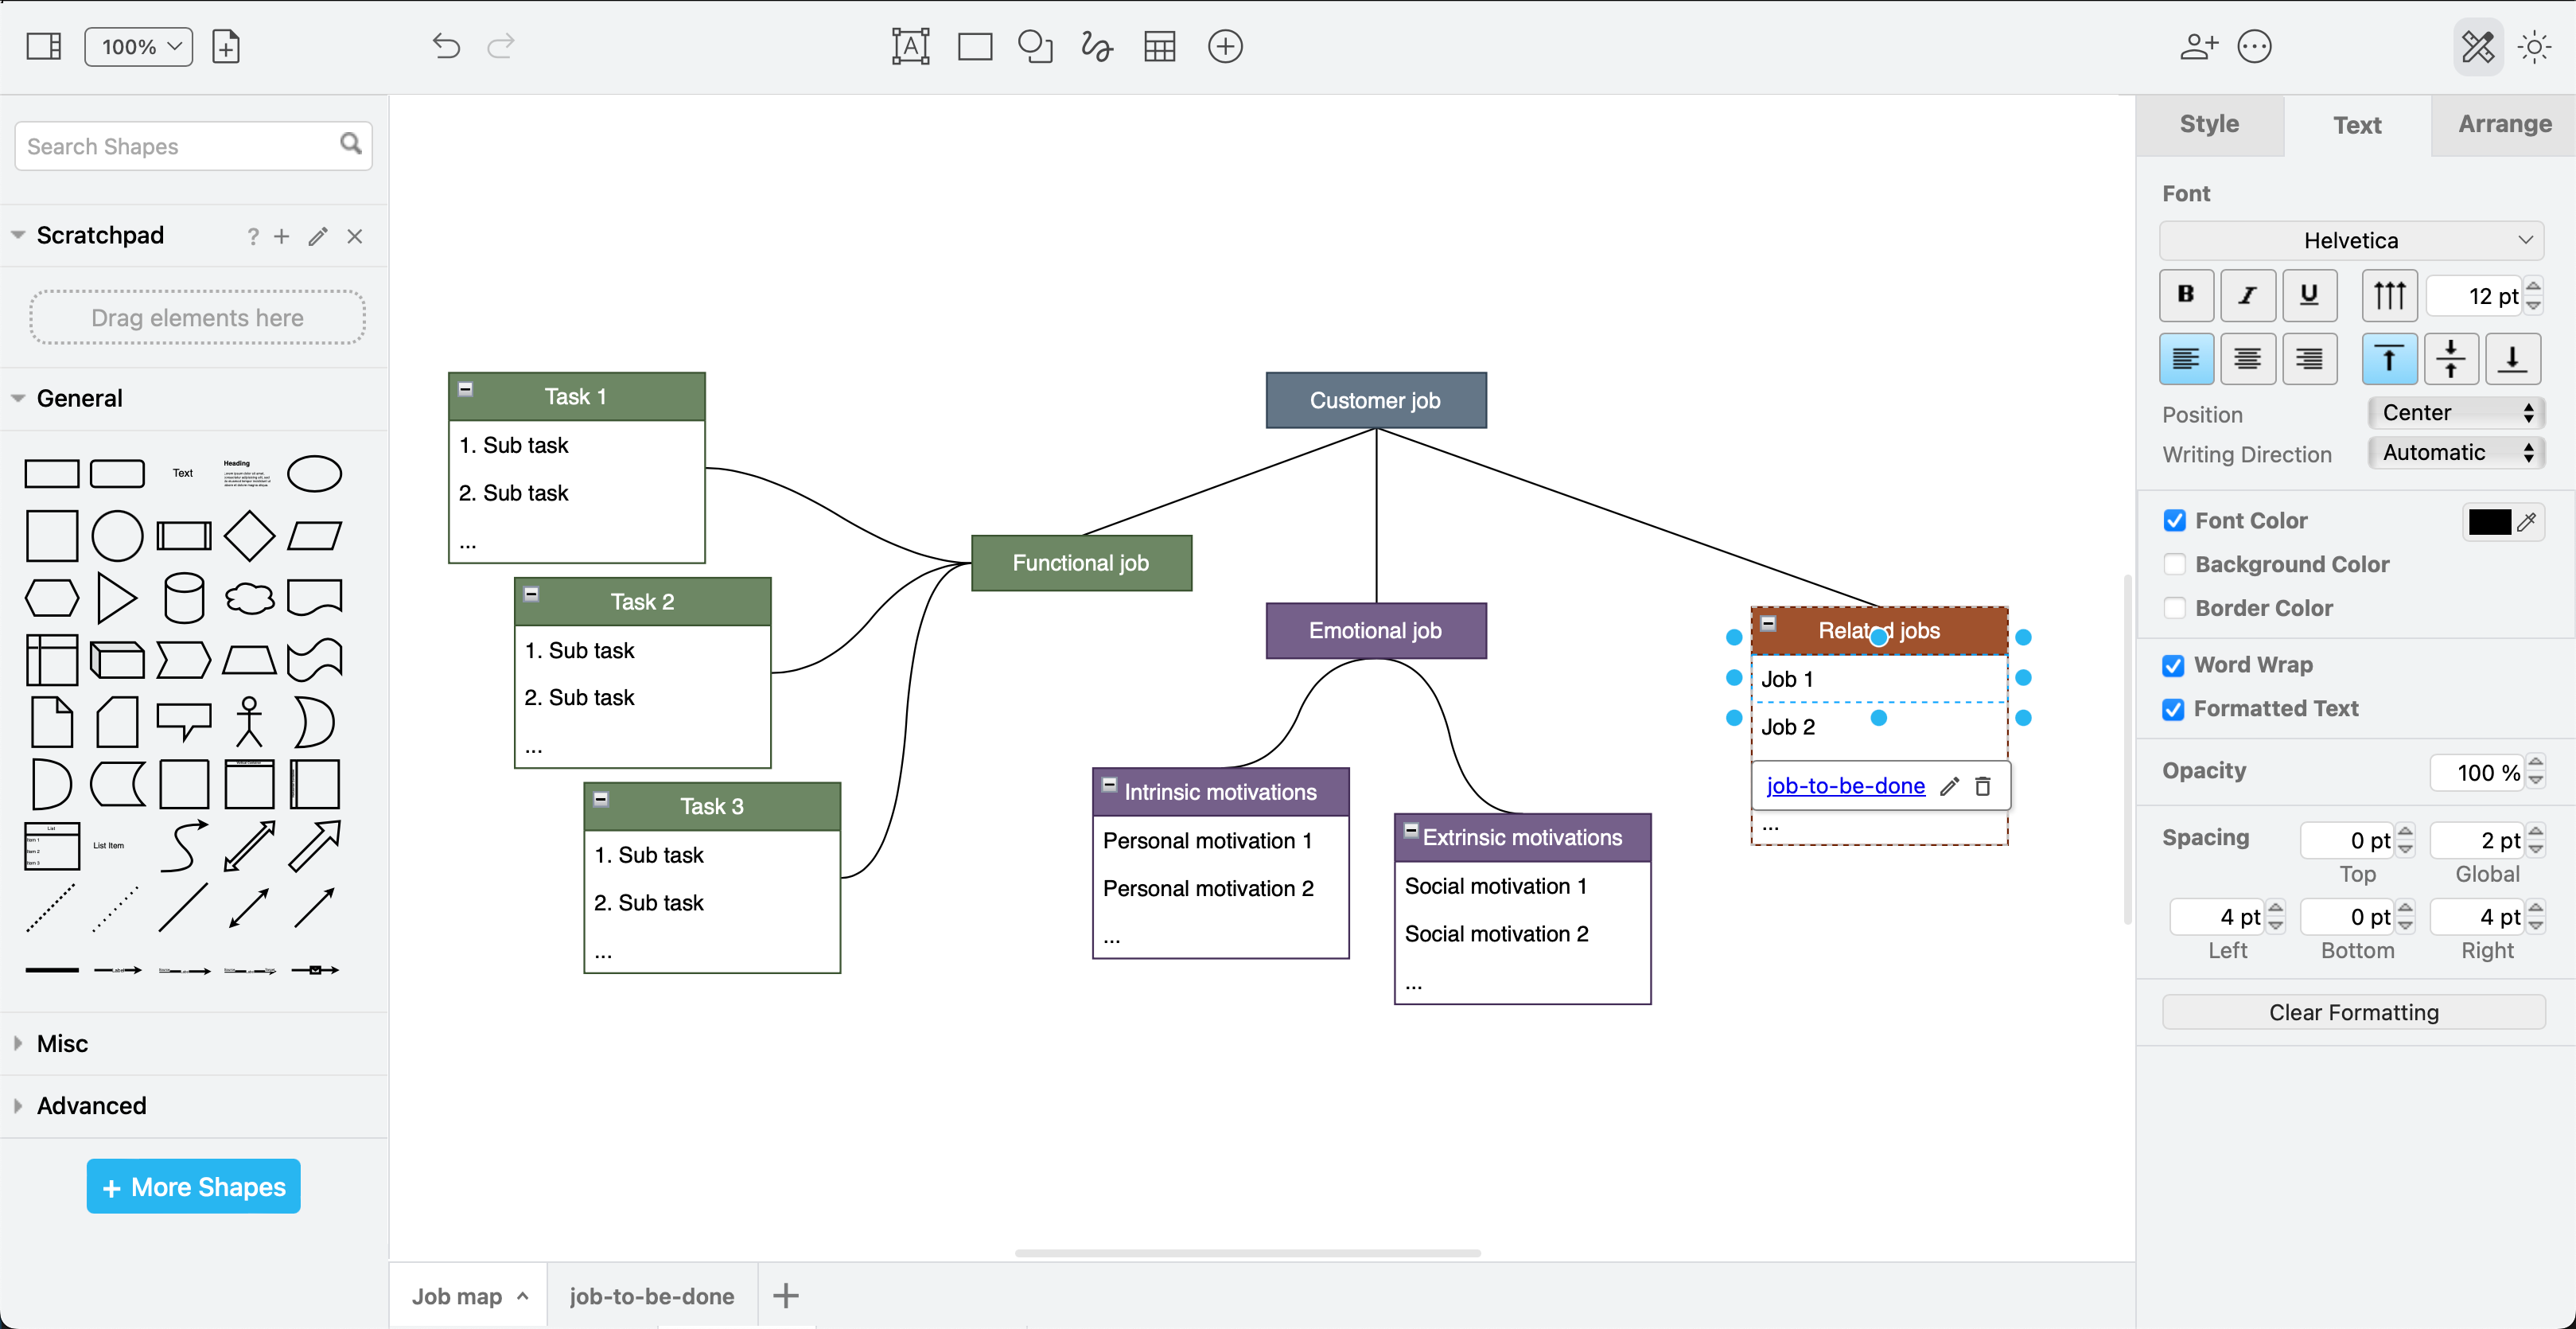
You can use concept maps in a number of ways to identify customers' needs. One approach uses the Jobs to be Done method to identify customer needs and motivations, detailed in job maps. This example uses link shapes for the leaf nodes in the concept map, and links to related jobs on other pages in this multi-page diagram.
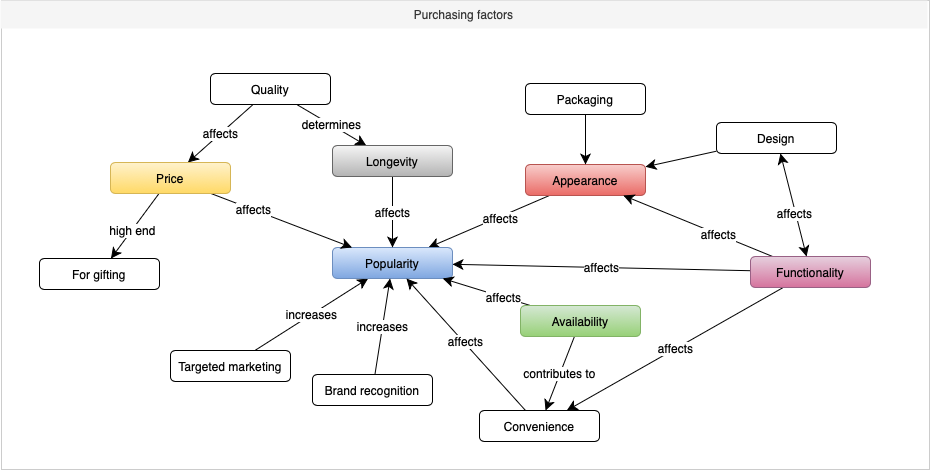
There are many interrelated factors that influence the sales and success of a product or service. Here's a concept map that your development and marketing teams can use as a template to discuss options for your products or services.
Concept maps in teaching and learning
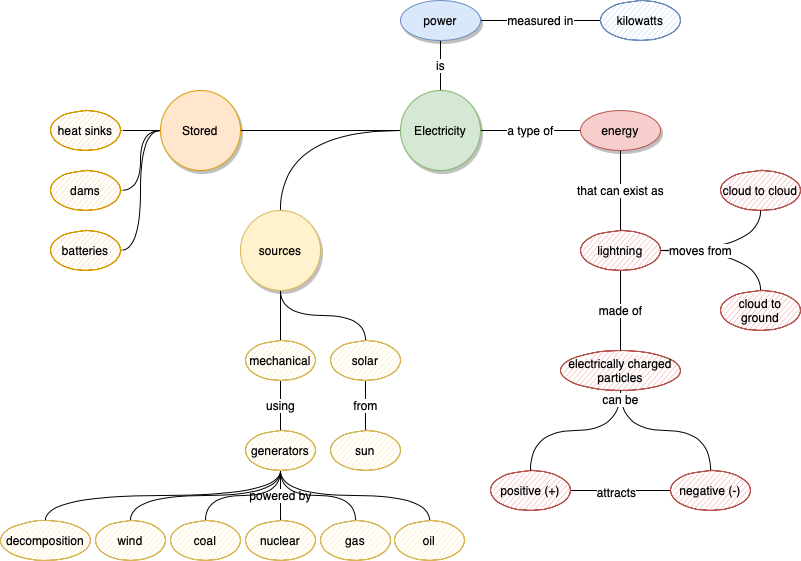
A thinking map relates one concept to many others, and notes the relationships between sub-concepts on the connectors.
If you want to show more context visually around a concept, the more artistic sketch notes approach to concept mapping uses various icons, text, and layouts to help the viewer understand a concept.
See more diagrams used in education
Business concept maps for managers
The following large mindmap details all the factors that impact or influence the ISO standards organisation. This example is available from our draw.io Diagrams repository on GitHub.
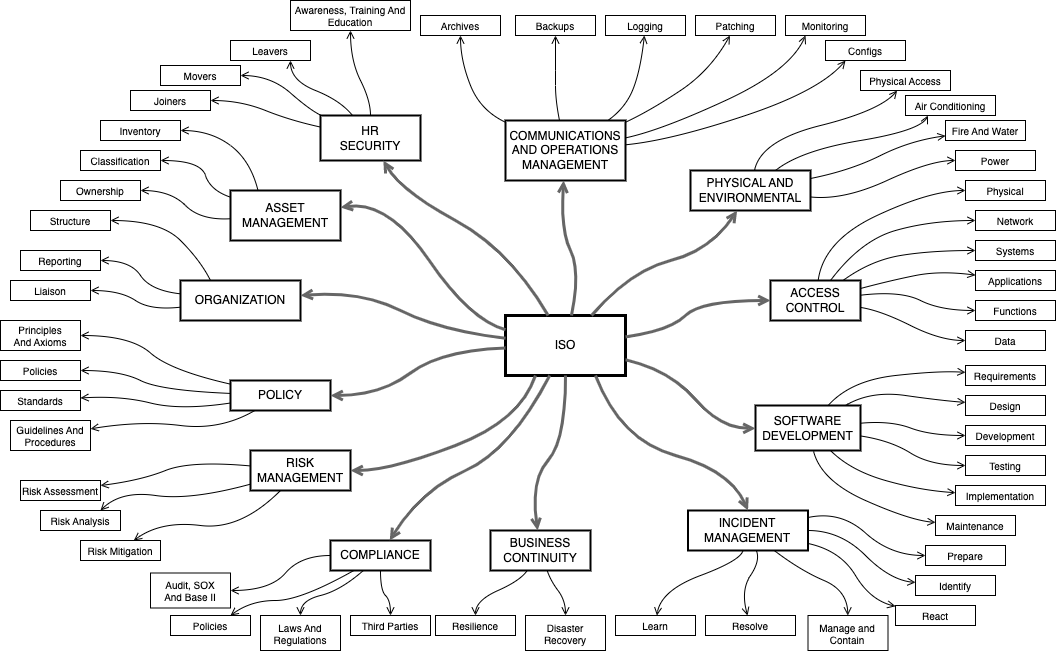
Edit this diagram to show the various factors that influence or affect your organisation or team.
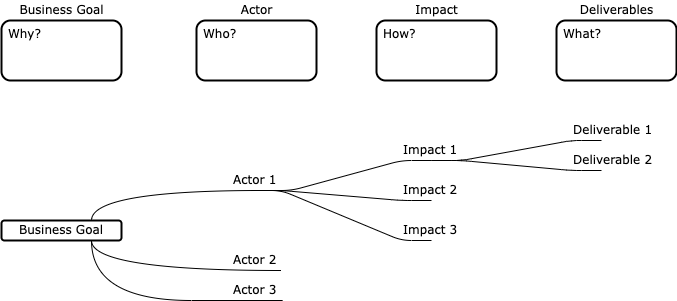
The following impact map template is useful for detailing business goals with the actors that contribute to them, as well as the deliverables that impact those actors. This template is from our draw.io Diagrams repository on GitHub.