Diagrams for teachers
Diagrams are an effective way of teaching and learning because we all understand complex information more easily when it is visualised. Graphic organisers, mindmaps, timelines, cause and effect charts, Venn diagrams, flowcharts, scientific illustrations - all of these can created in draw.io.

With its vast shape libraries, teachers can create a wide range of diagram resources for their students and prepare handouts quickly, and students can take visual notes and draw the diagrams they need for assessment tasks.
Types of diagrams to support learning
When students draw diagrams, this helps them organise new or complex information and make connections between topics. They are an invaluable learning tool.
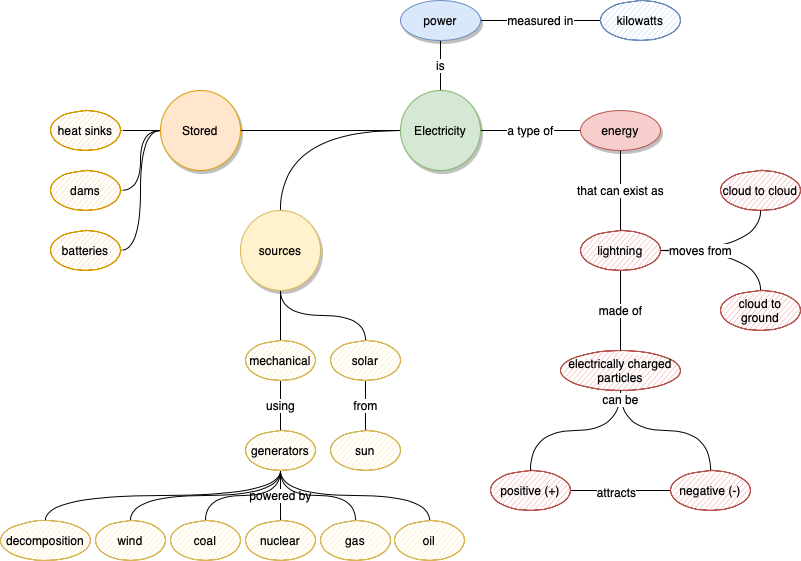
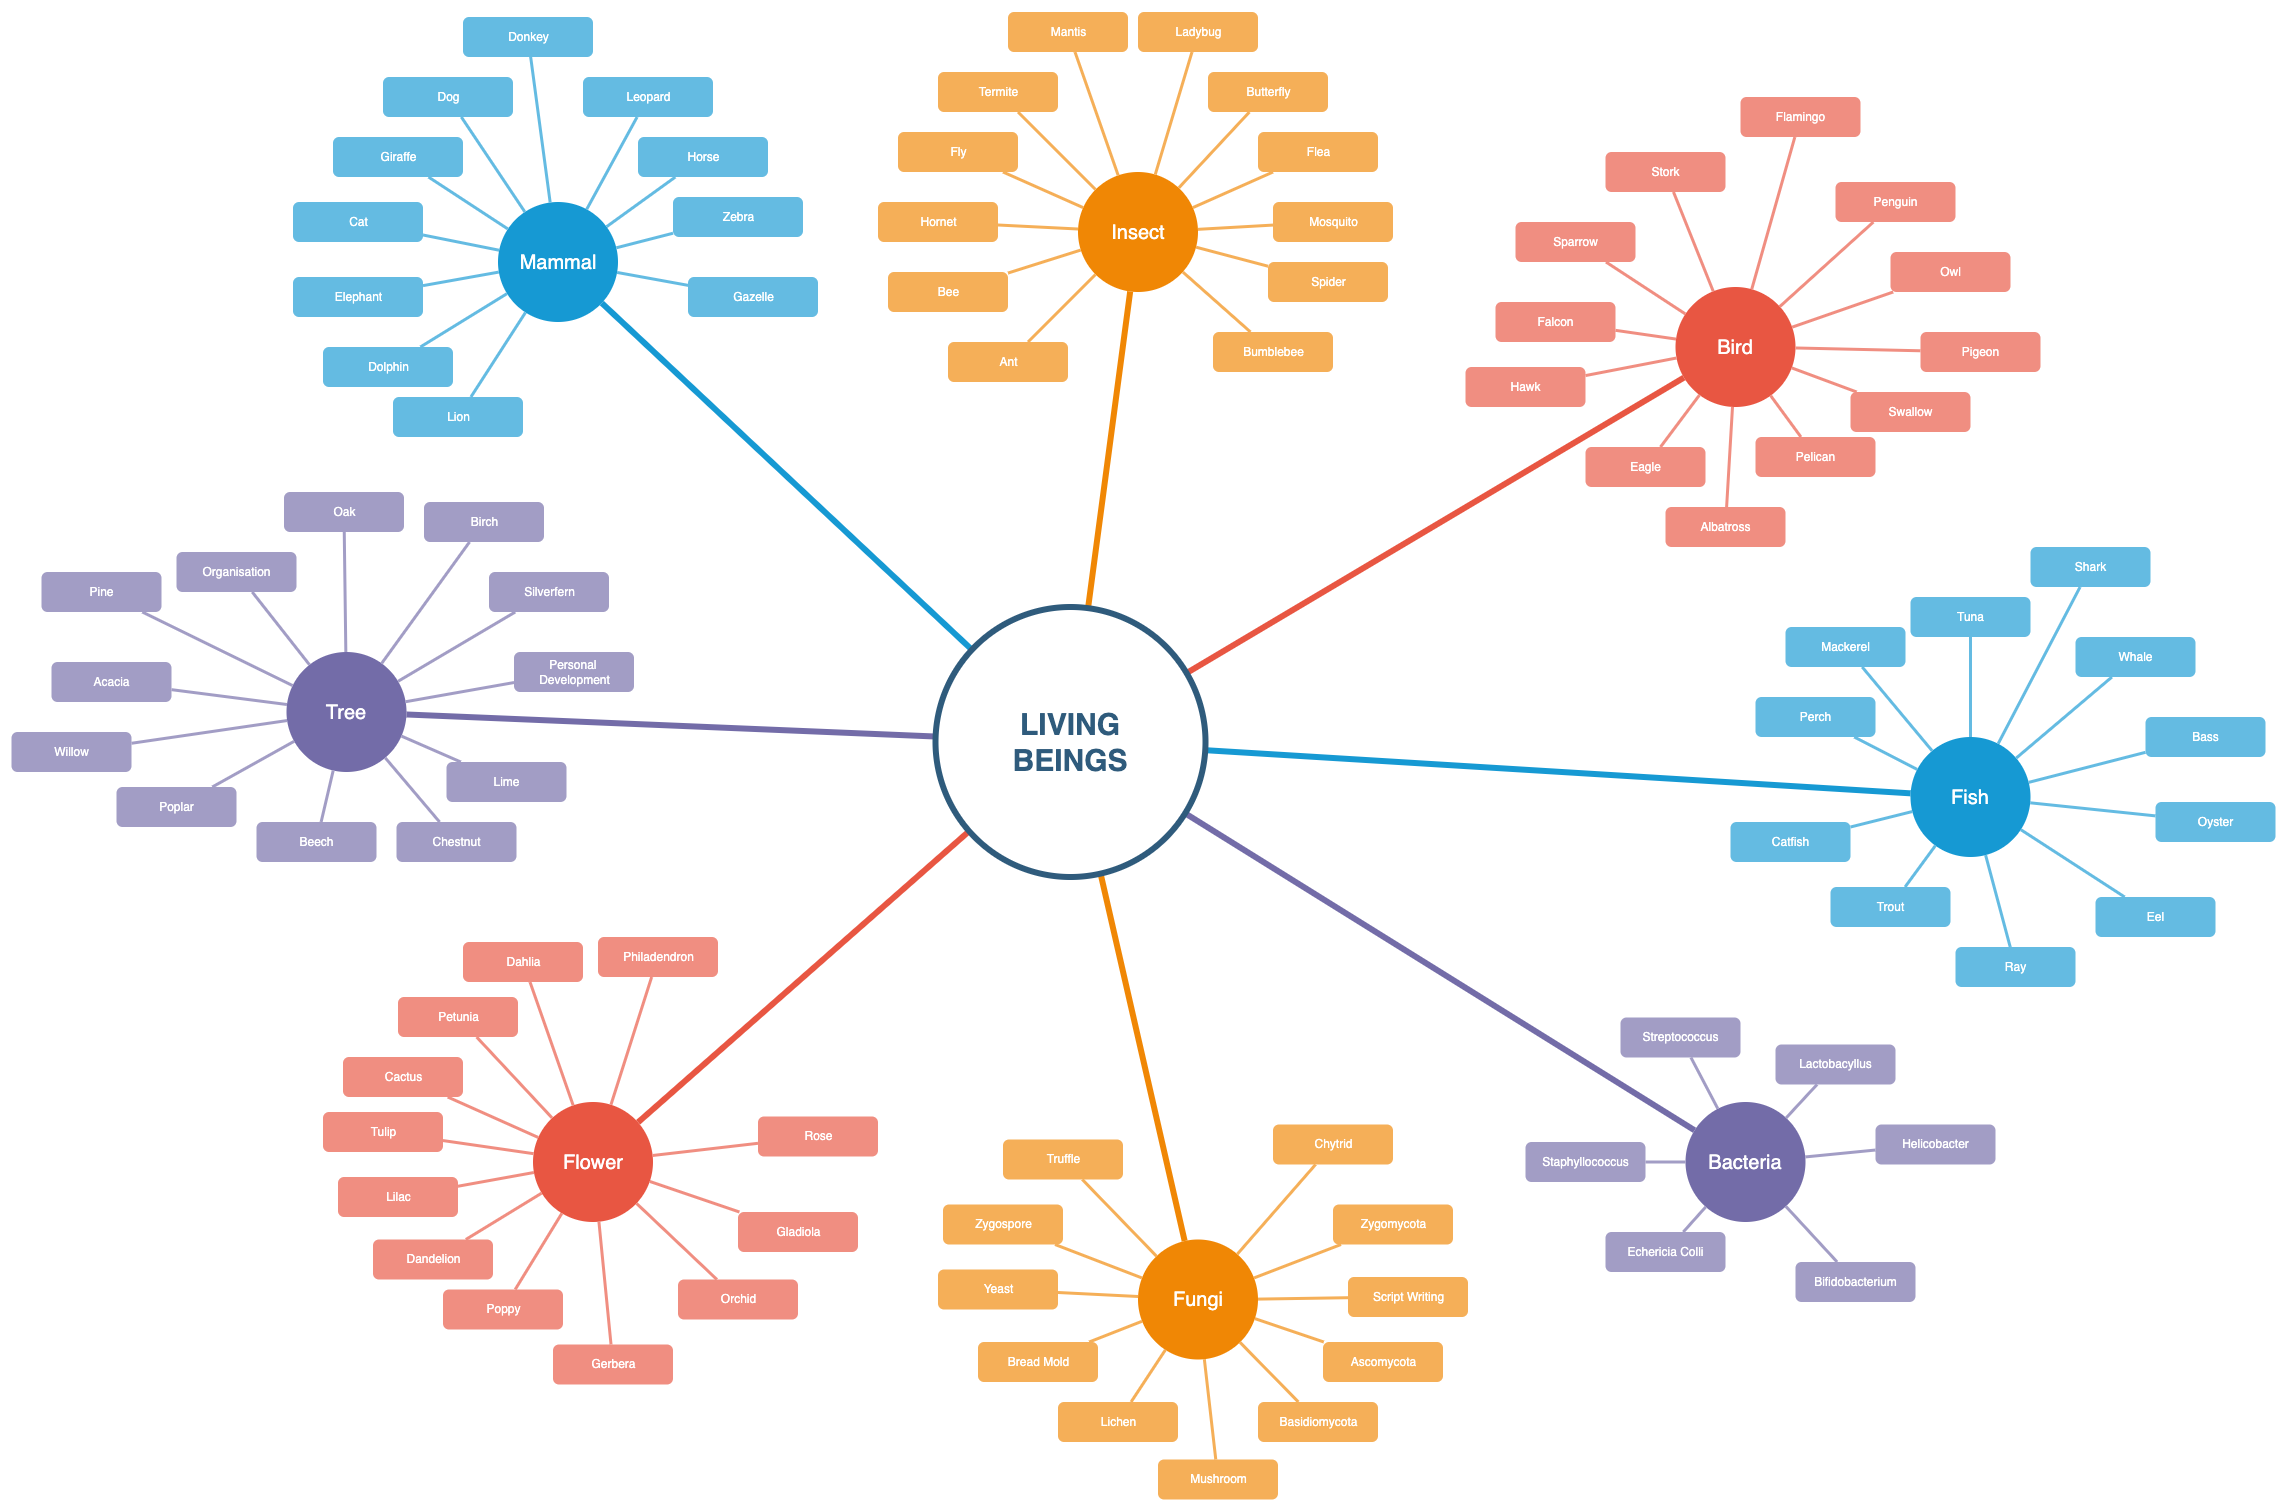
Graphic organisers and thinking maps
These are diagrams that show connections and relationships between topics, terms, events, ideas and facts. Most types of diagrams fall into these superclasses, including the simple concept map below.
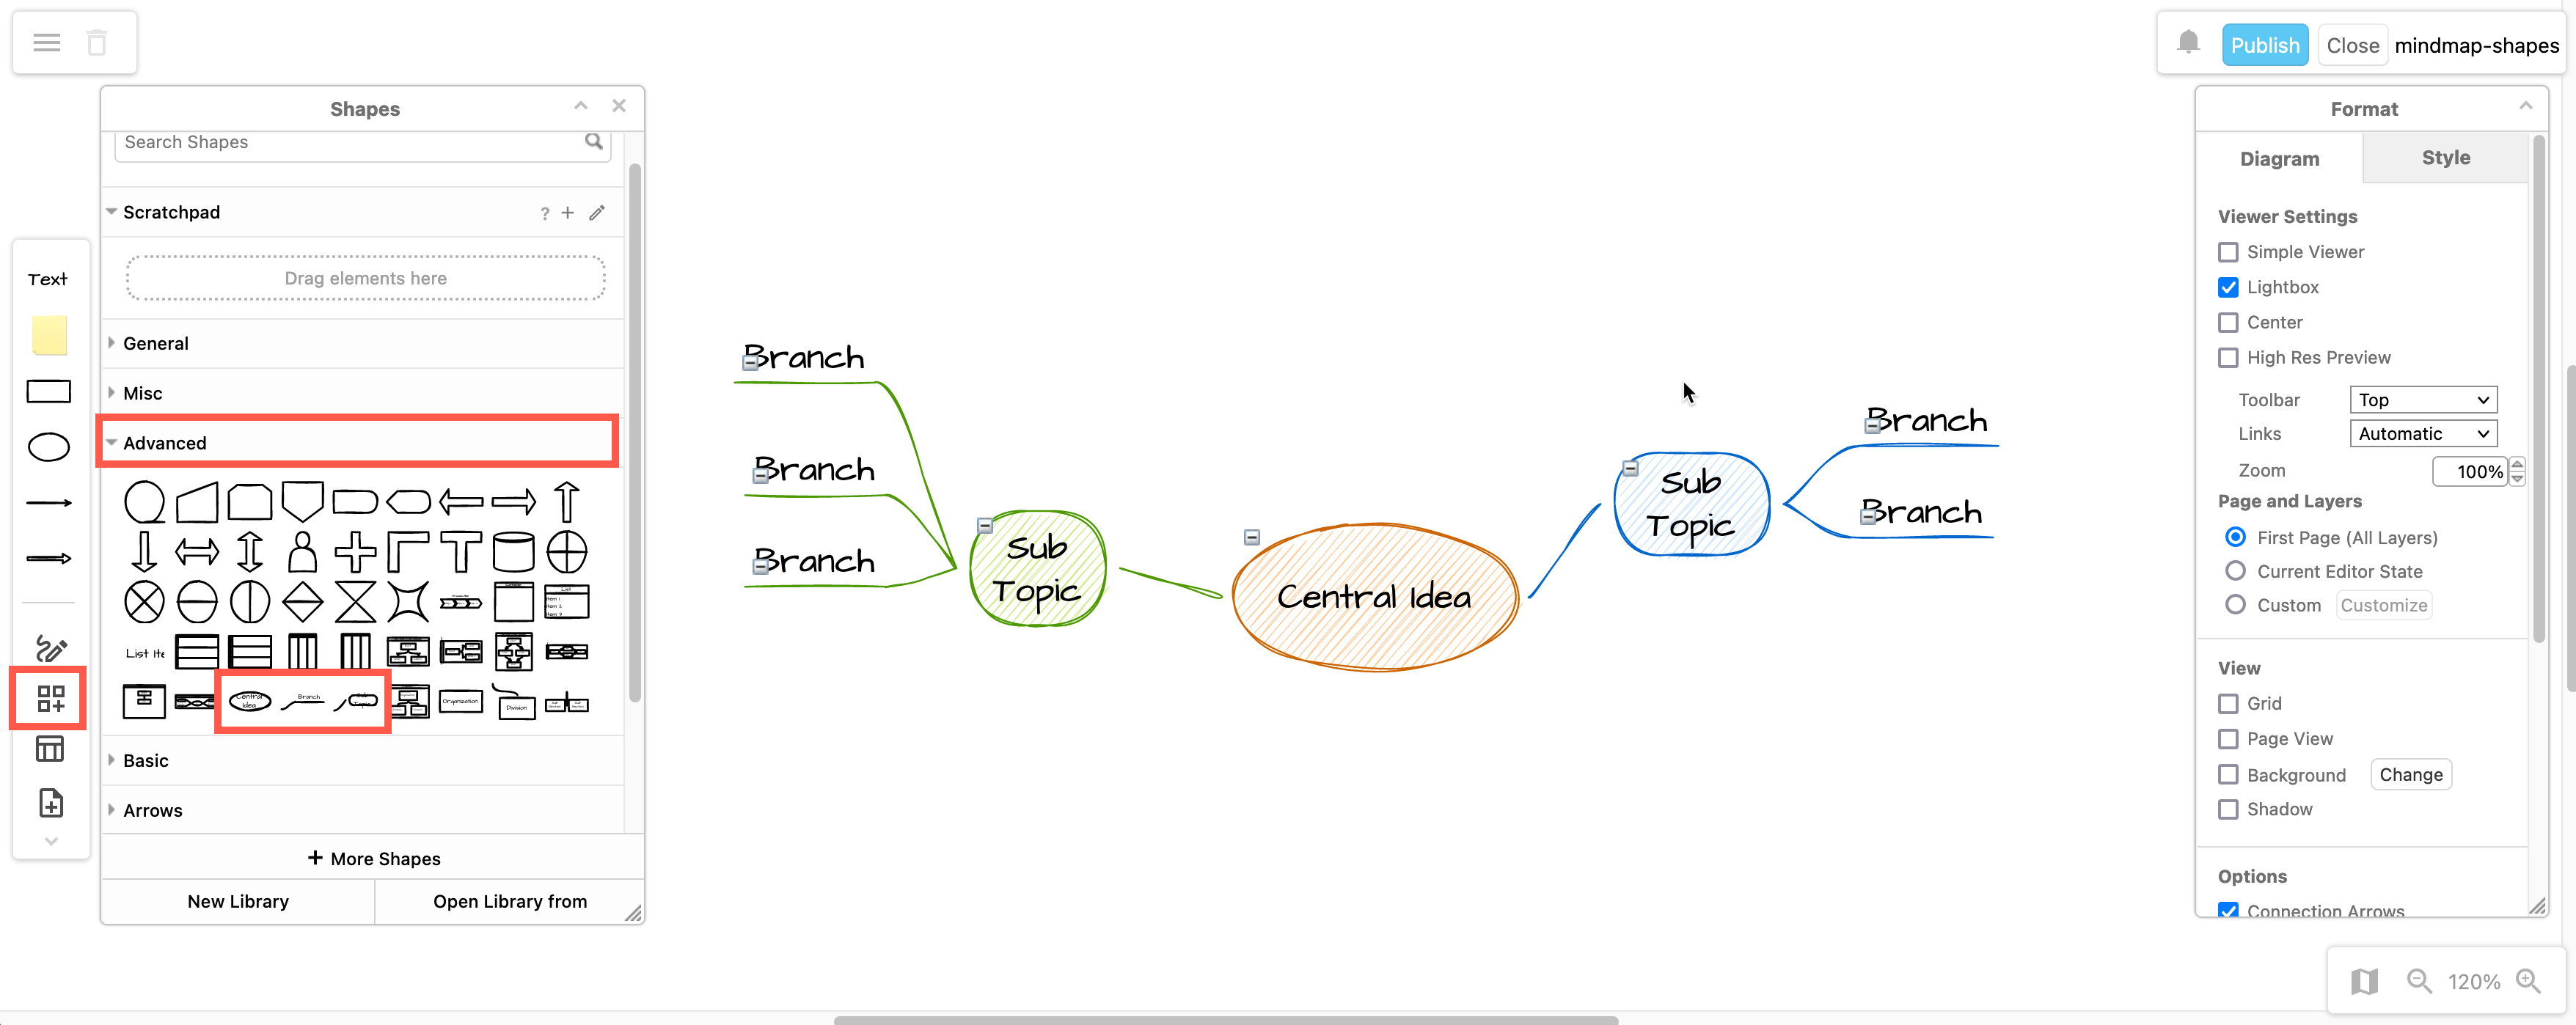
Mindmaps
Mindmaps are similar to concept maps, and often used to brainstorm topics or ideas prior to a writing task or discussion. They can also be used to improve reading comprehension when analysing texts.
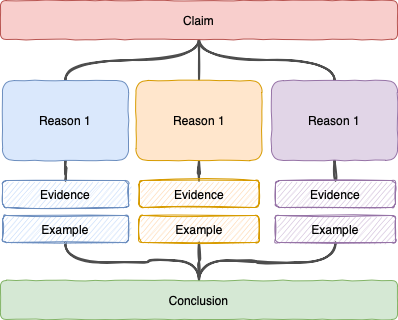
Persuasion diagrams
Use persuasion diagram to write persuasive essays and prepare for debates. Start with a claim or what you want to convince the reader of, note two or three main reasons to support that claim, add supporting facts or examples for each of the reasons, and end with a conclusion.
Sequences and timelines
These types of diagrams are necessary in history classes or when discussing any sequence of events or roadmap.
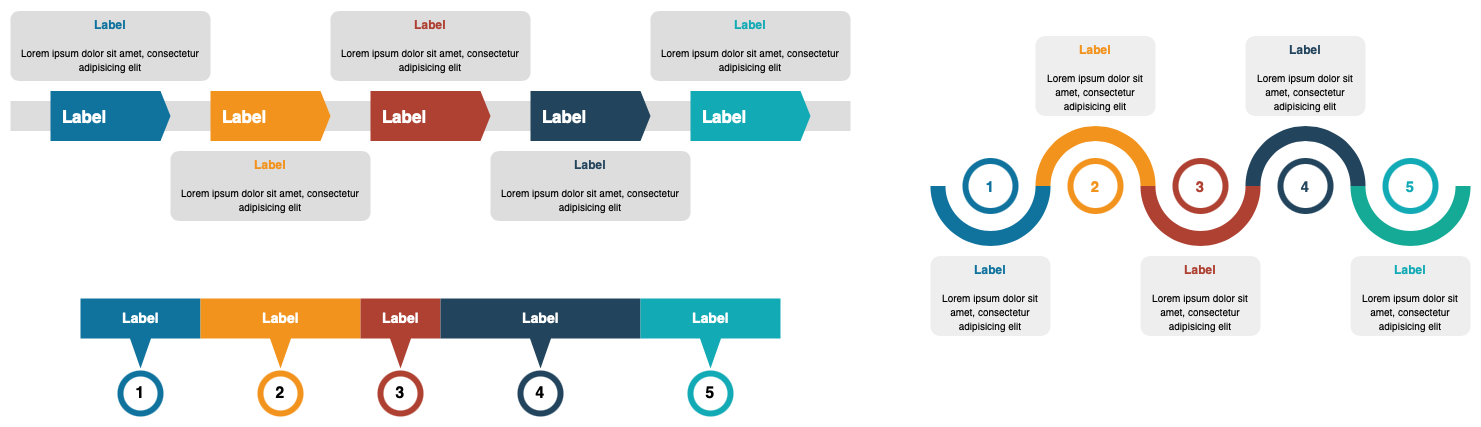
Some of the timelines in the Infographics shape library
KWL charts
KWL charts are popular tools both for school and in the workplace for professional development. They visually organise text and goals into three columns: current Knowledge, what you Want to know, and what you will have Learned afterwards.
This chart can be extended with additional columns as needed, such as topics for Further exploration, or notes about How you will gain the information you need.
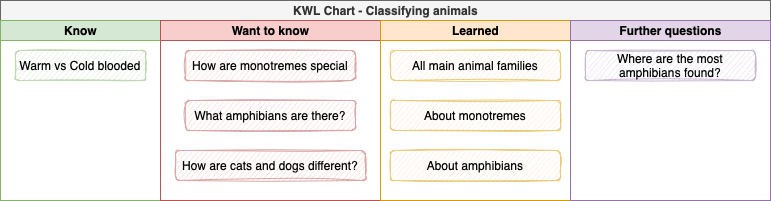
Tip: Use list shapes to enter text quickly, or the pool shapes in the Advanced shape library (as in the example), into which you can drop text and other shapes.
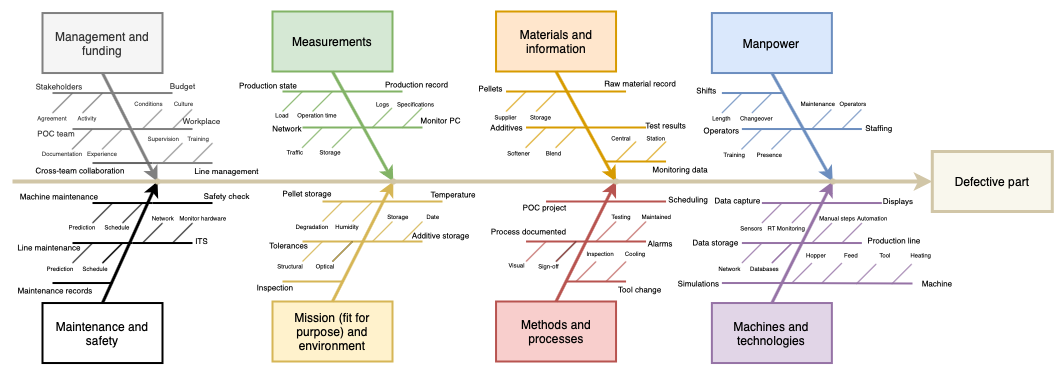
Cause and effect
Also known as fishbone diagrams. these are used extensively in industry as well as at school. It's a a popular type of diagram to explore problems, their potential causes and brainstorm solutions.
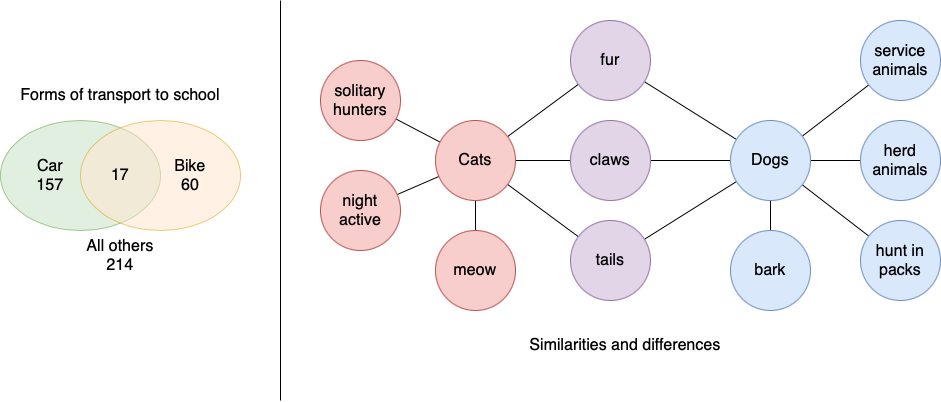
Venn diagrams and bubble maps
Venn diagrams are used to compare and contrast things organised into two or more categories.
Cluster diagrams
Information is grouped together into related clusters, and contrasted with other clusters in the diagram. These types of diagrams are used extensively in the workplace too: network diagrams, system context diagrams, size comparisons, UML diagrams, relationship graphs, and more.
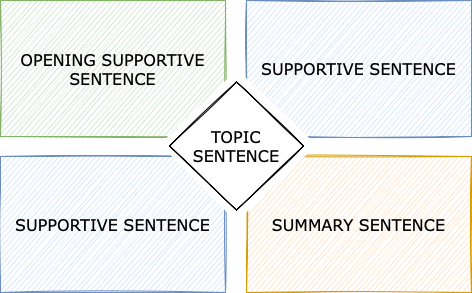
Four square writing method
This grid of four squares is often used to teach writing skills to younger children to help them formulate and order ideas before writing an essay.
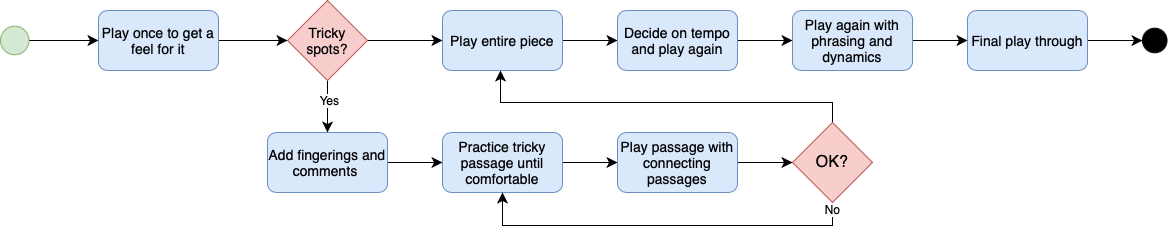
Flowcharts
Flowcharts are are probably the most common type of diagram you will draw, both at school and at work. They are used to visualise all types of processes.
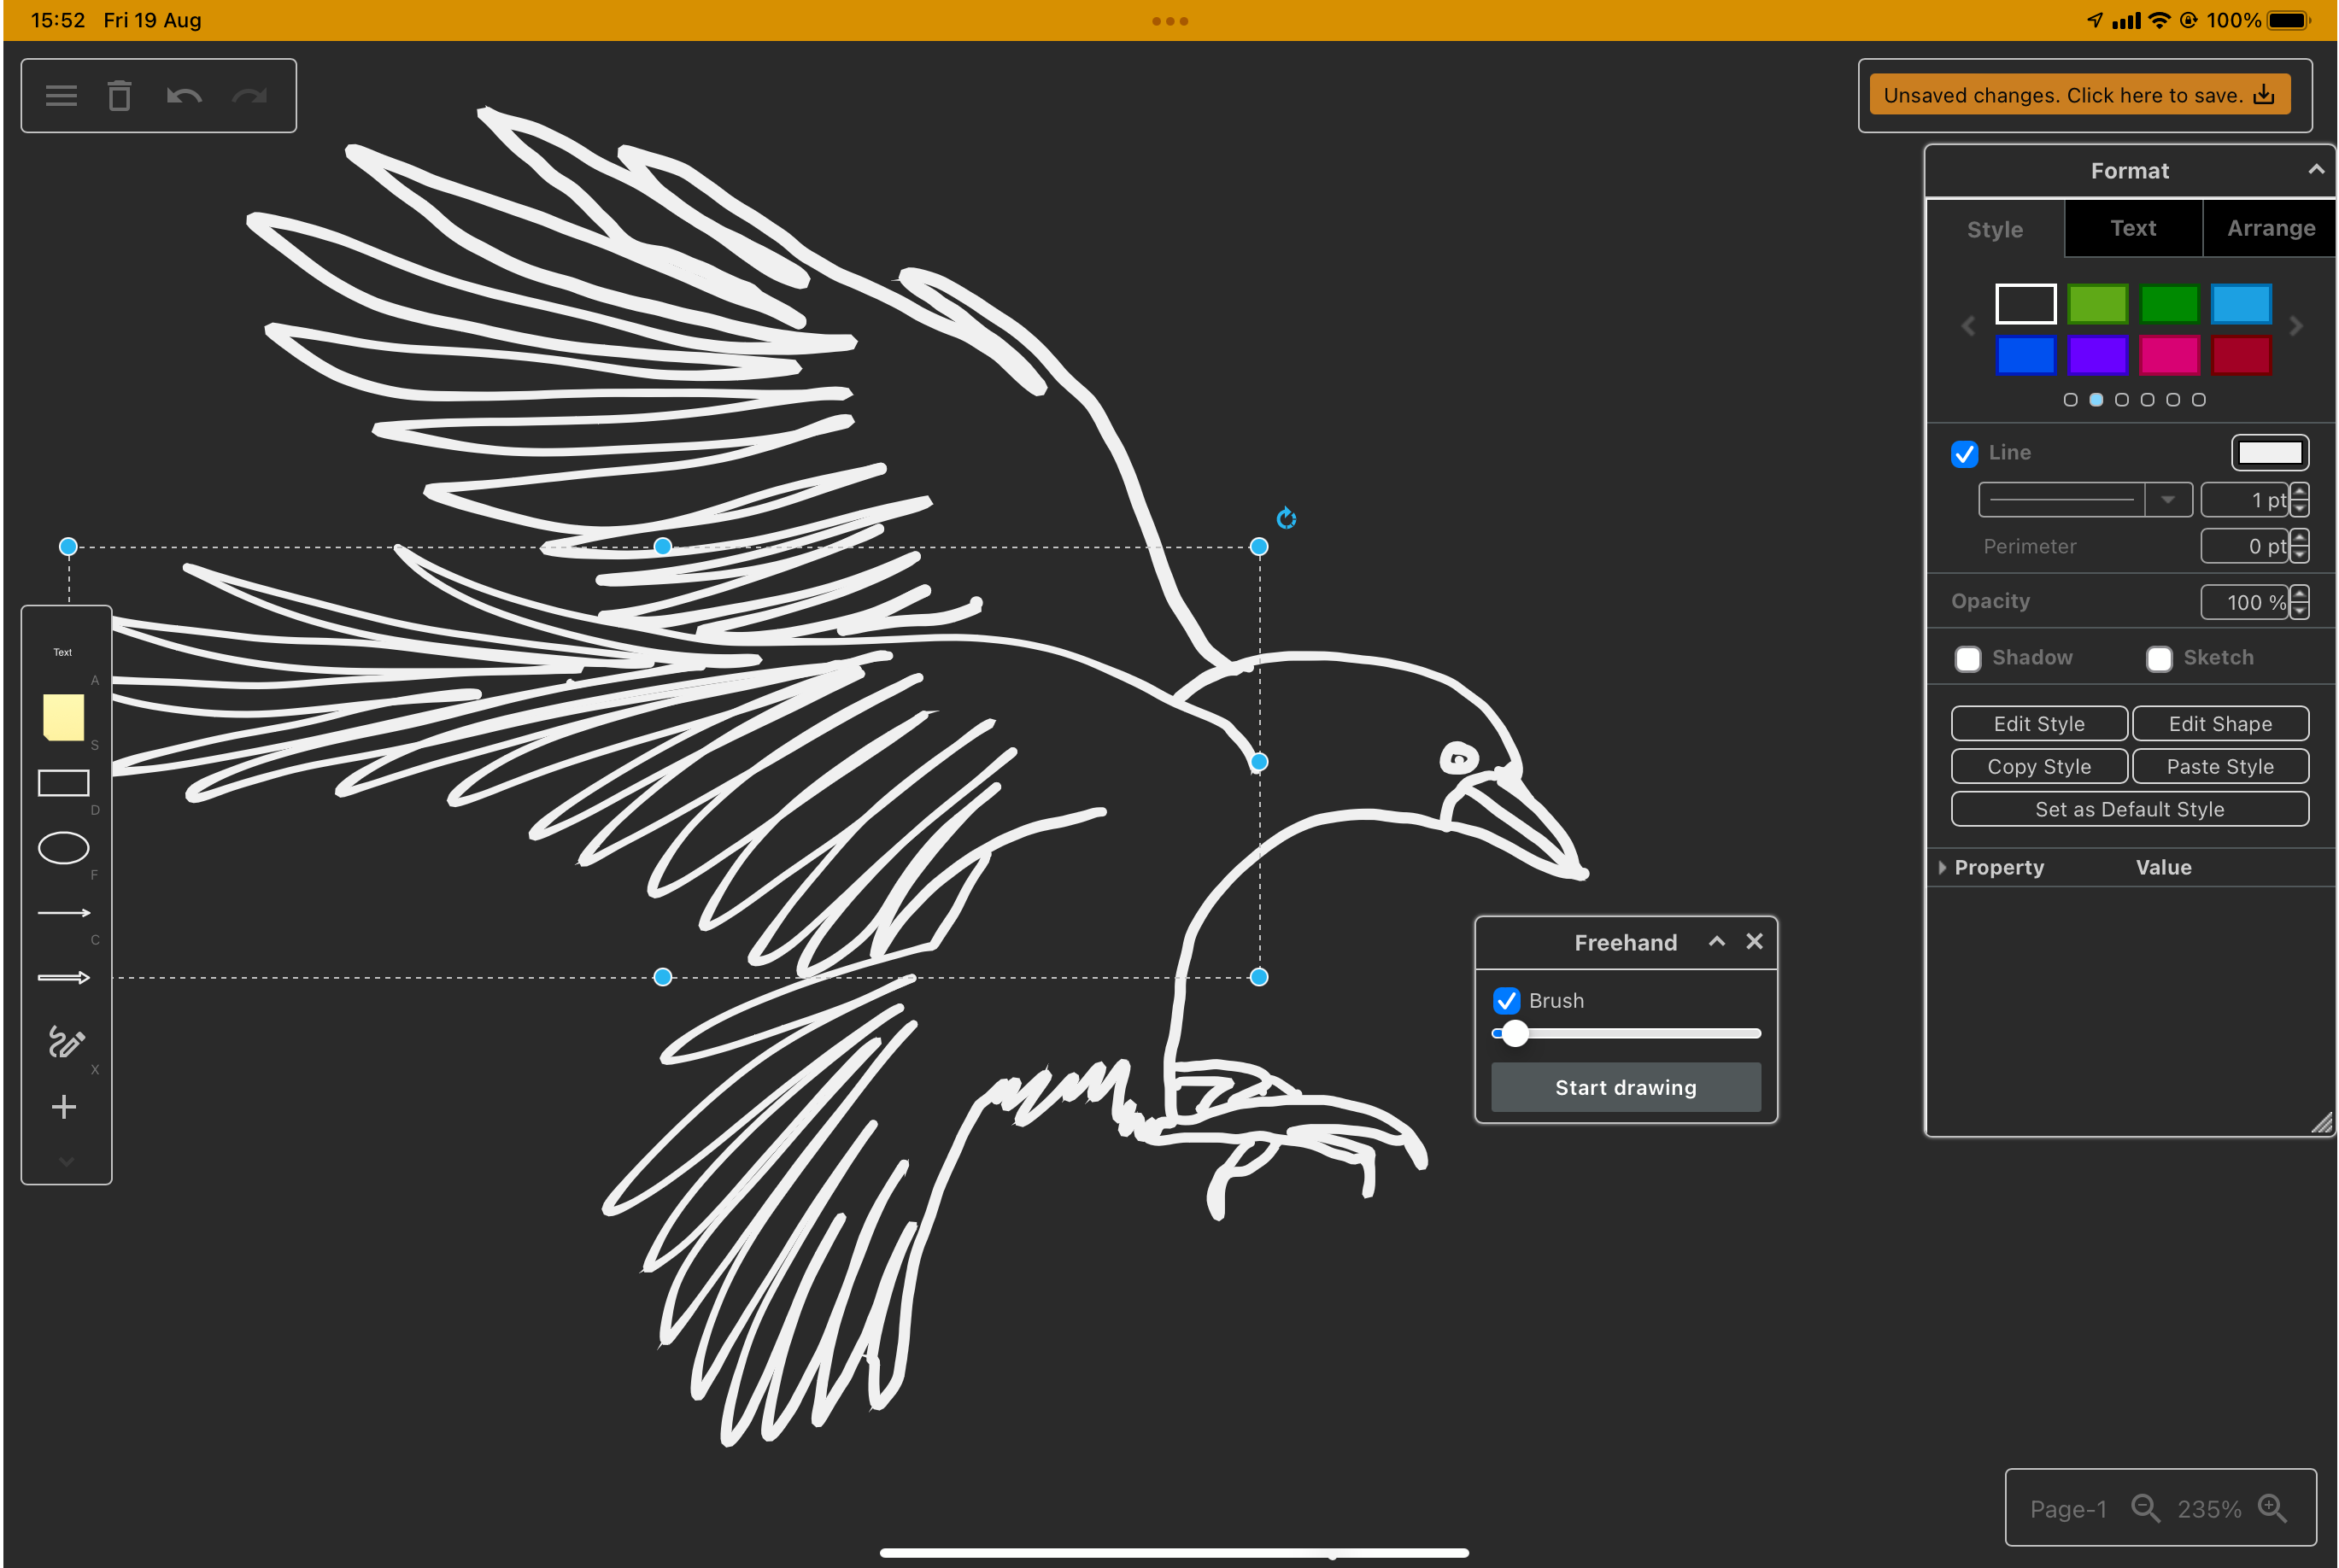
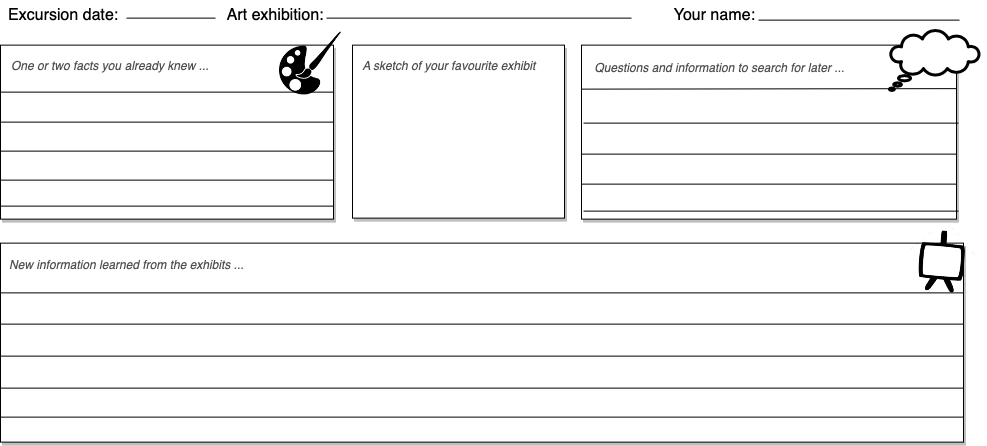
Visual note taking
Also called sketch notes, these are often used to prepare attractive doodled summaries of presentations and workshops. As they are a good way to maintain attention, aid critical thinking, and remember the information that was presented, encourage students to doodle their notes so they can learn better.
Using the freehand brush and draw.io on a tablet, you can doodle easily - even quite complex shapes like the crow below.
Tip: Multiple students can work on the same visual notes and see each others' cursors in real time, if they store the diagram file in Google Drive or Microsoft OneDrive - great for group work.
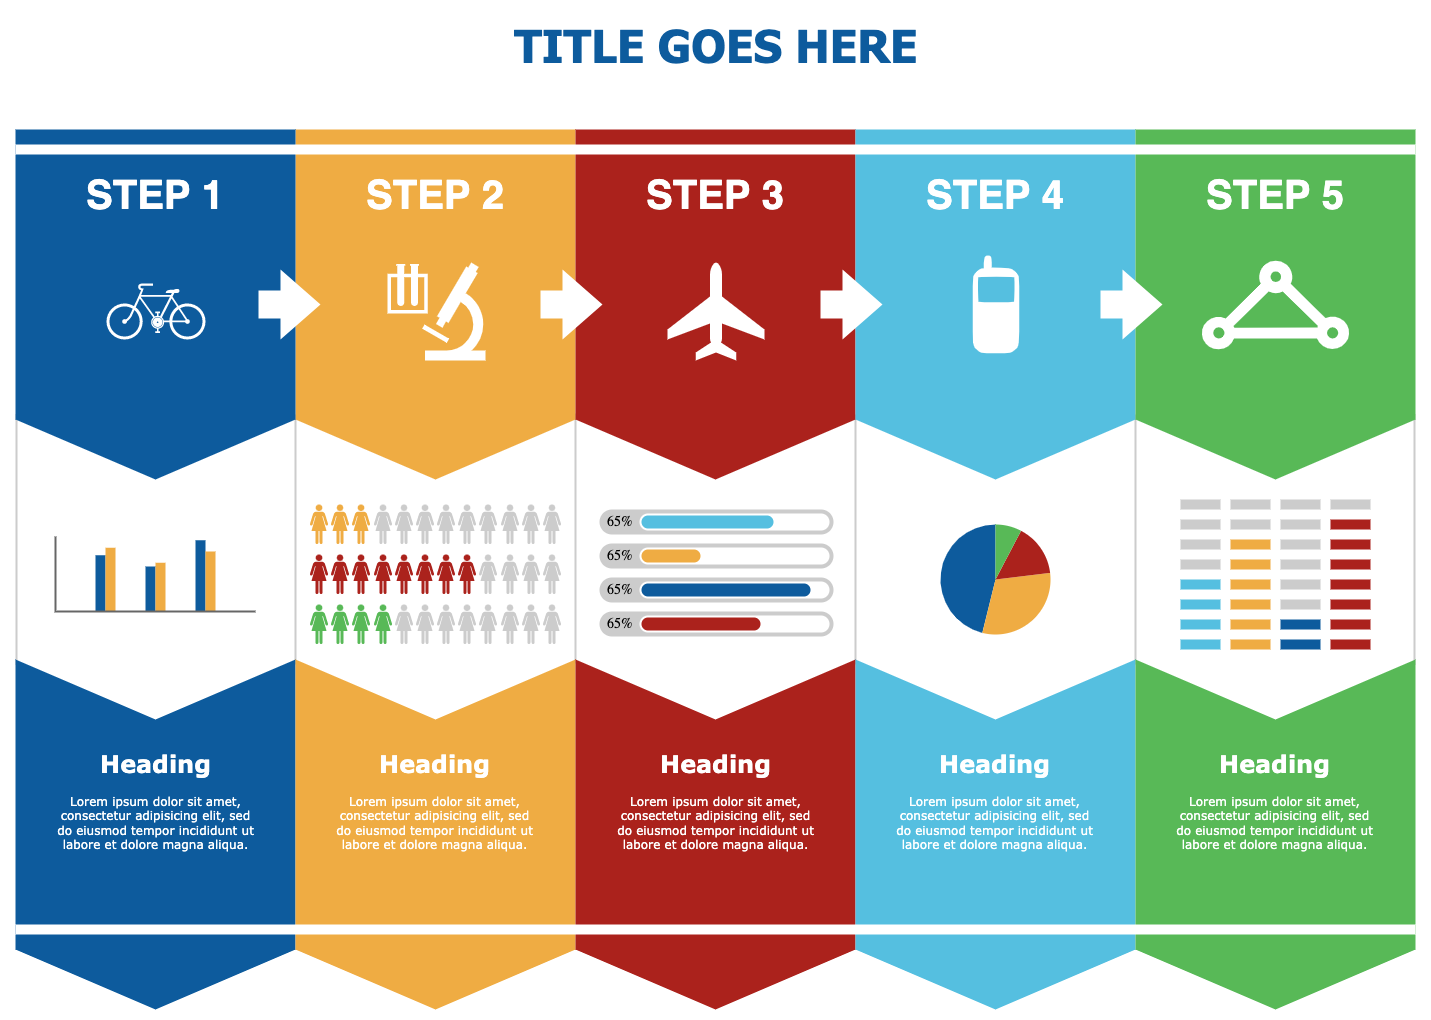
Infographics and handouts
Most often used as posters or slides, infographics combine multiple diagrams and visual elements to explain different aspects of a more complex topic. The infographic shape library in draw.io contains many templates such as those used below.
Need more shapes? Here's how to search for icons and shapes.
Handouts are easy and fast to prepare in draw.io. You can export a diagram to a PDF file, or export it to an image file that you can then import into a document.
Scientific illustrations
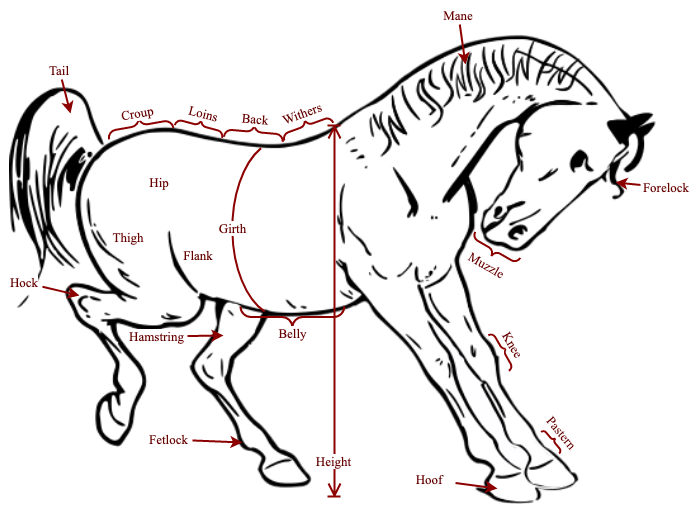
You can create almost any type of illustration in draw.io, either without or on top of an image.
For example, this labelled diagram was created with bracket shapes, connectors and text over the background image of a horse.
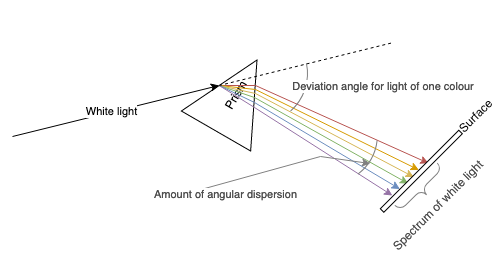
This prism illustration was created with basic shapes, connectors and text from the default shape libraries.
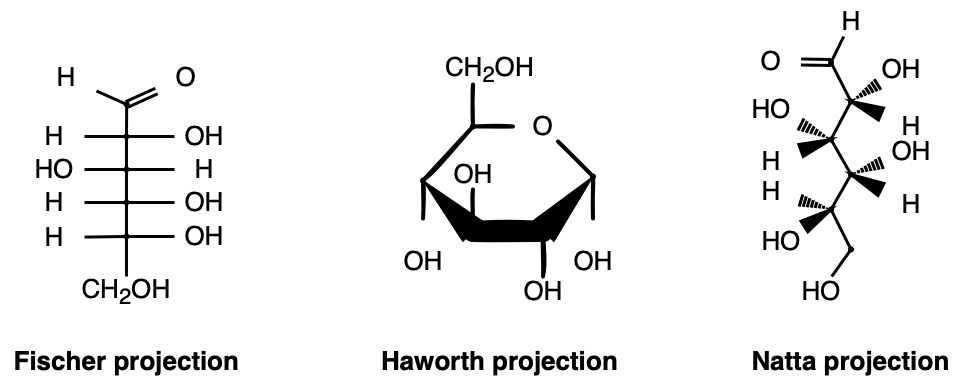
These structural formulas for chemistry classes use shapes from the Arrows shape library.
Many people have made custom shape libraries available on the web, like the Bioicons used below, that will help you draw diagrams for handouts and assignments.
Start diagramming today
Start diagramming now with our online version of draw.io. You get to choose where you want to store your diagram files, and it's free - no account is needed.
Follow our step by step tutorial for creating a simple flow chart to get used to the diagram editor.
Embed diagrams in Google and Microsoft applications
The draw.io editor is more powerful than the built-in diagramming tools in office applications letting you create more complex diagrams and draw faster.
With the draw.io Google Drive and Workspace apps, diagrams can be embedded in Google Classroom pages and discussions, and in Google Docs, Slides and Sheets. Our Microsoft add-ons work similarly OneDrive and Office 365 applications.