UML state machine diagram
The concept of state diagrams or state machine graphs has been around since the mid 1900s, long before David Harel modified them into the form used today as part of the UML standard.
UML state diagrams, also called state machine diagrams, complement process flows:
- each node in a flowchart or a UML activity diagram is an action in a process.
- each node in a state diagram shows a system state, and the connectors show the triggers that force a change to another state.
Noting system states and the transitions (processes) that trigger another state can help you define and program complex systems with interconnected components. State diagrams can be used to clearly document failed states and the recovery from those states, in case of liability or to highlight a problem with an existing system.
Use state diagrams to analyse problems
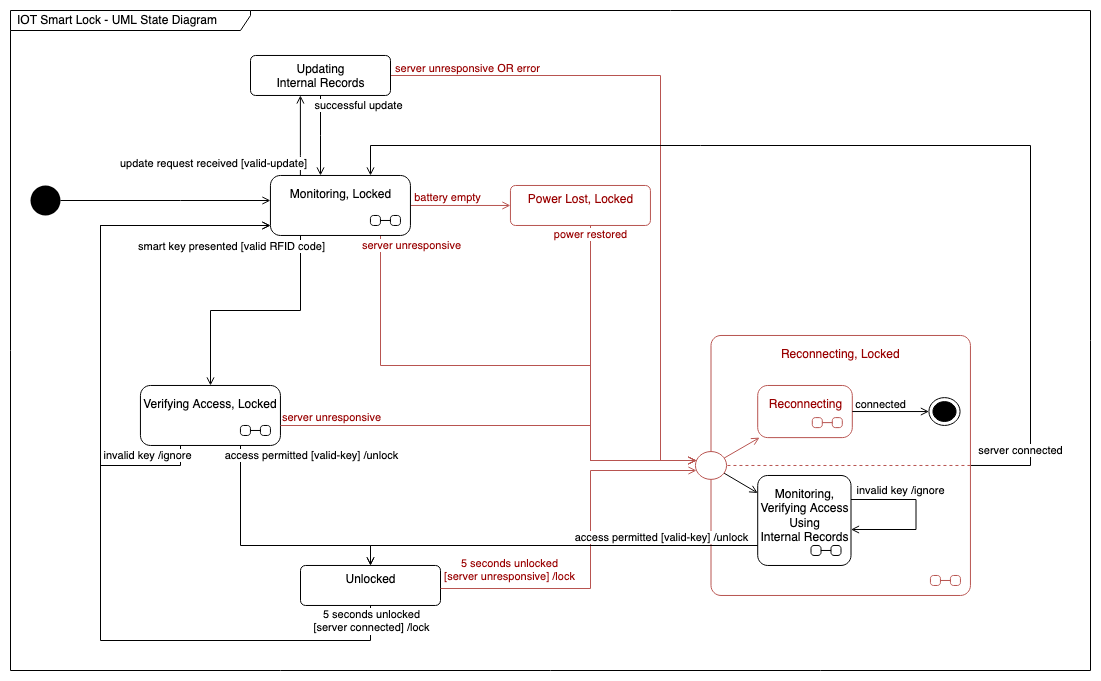
In the example at the top of the page, the colour red indicates an error state. You can clearly see there is a problem when the smart lock's battery is empty - the door stays locked.
Draw state machine diagrams
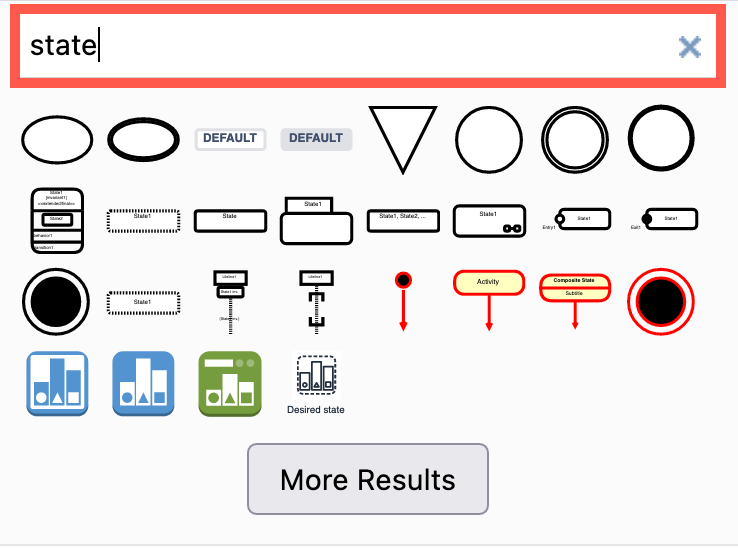
Enable the UML 2.5 shape library: Click on More Shapes at the bottom of the Shapes panel, enable the UML 2.5 shape library in the Software section, and click Apply.
You can also find most of them by searching for state in the Search Shapes field in the Shapes panel.
State diagrams are built from three types of shapes - states, pseudo-states, and transitions.
States
Simple states and composite states that contain one or more regions, or entire sub-states (containing an entire state diagram).
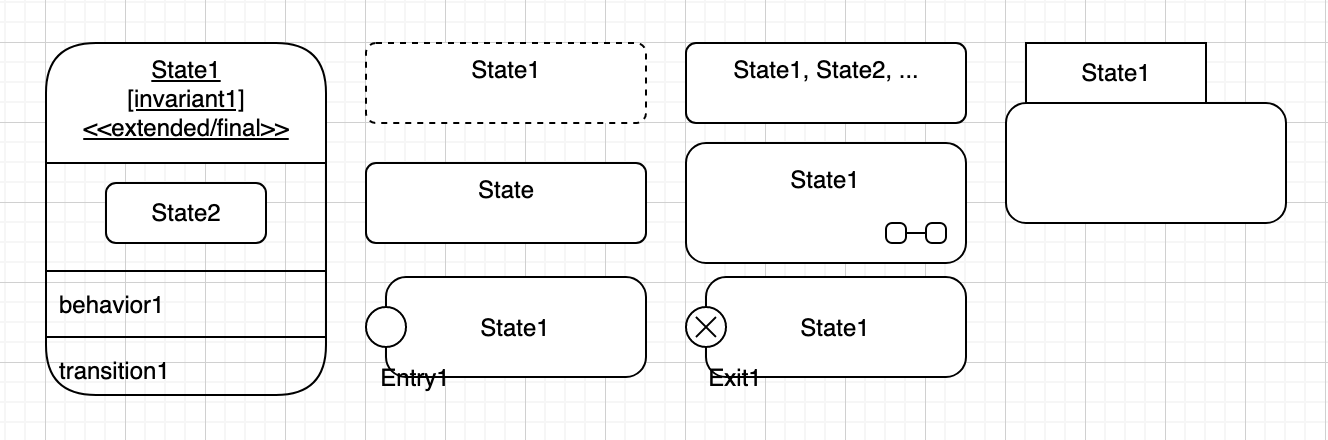
There are several styles for the state shapes - use whichever style you prefer. If you want to define the activities (behaviours) that occur while the system is in that state, use the more detailed state shape.
Composite states can be shown at a high level with an icon in the lower right representing two horizontally linked states.
Pseudo-states
There are several transient pseudo-states you can include in your diagram.
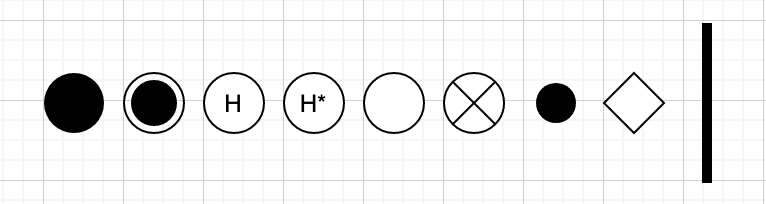
- The initial state is a filled circle.
- An entry point is an empty circle on the side of a state.
- An exit point is a circle with a cross on the side of a state.
- A shallow history is a circle with a
Hin it, and is used to represent an entry point to the most recently active sub-state within that state. The entry action to that sub-state is then performed. - A deep history is a circle with
H*inside, and is used to represent the entry point where the most recently active configuration of the composite state is recalled - entry actions for each of the remembered active sub-states are performed. - A choice is indicated with a diamond, just like in a flowchart. Use the diamond shape in the General shape library.
- A fork is a solid bar which splits a transition into two more more transitions. This is often implied (not drawn) when documenting composite states with multiple regions.
- A join is a solid bar that has transitions from two or more sources coming in, and one transition out.
- A junction is a small, solid circle that can be used to merge or split transitions with different guard conditions.
- The final state is a solid circle inside a larger circle, and indicates the enclosing region is completed.
The most common pseudo states you will use are the initial and final states.
Transitions
The transitions are the connectors between states.
The label on the connector / transition usually follows the format trigger [guard conditions] /actions. The trigger should generally be defined, but the guard condition and action can be omitted if they are not required.
![Transitions in UML state diagrams will generally have a trigger [guard conditions] and /actions on their labels](/img/blog/uml-state-diagram-transitions.png)
Sub-states, regions and containers
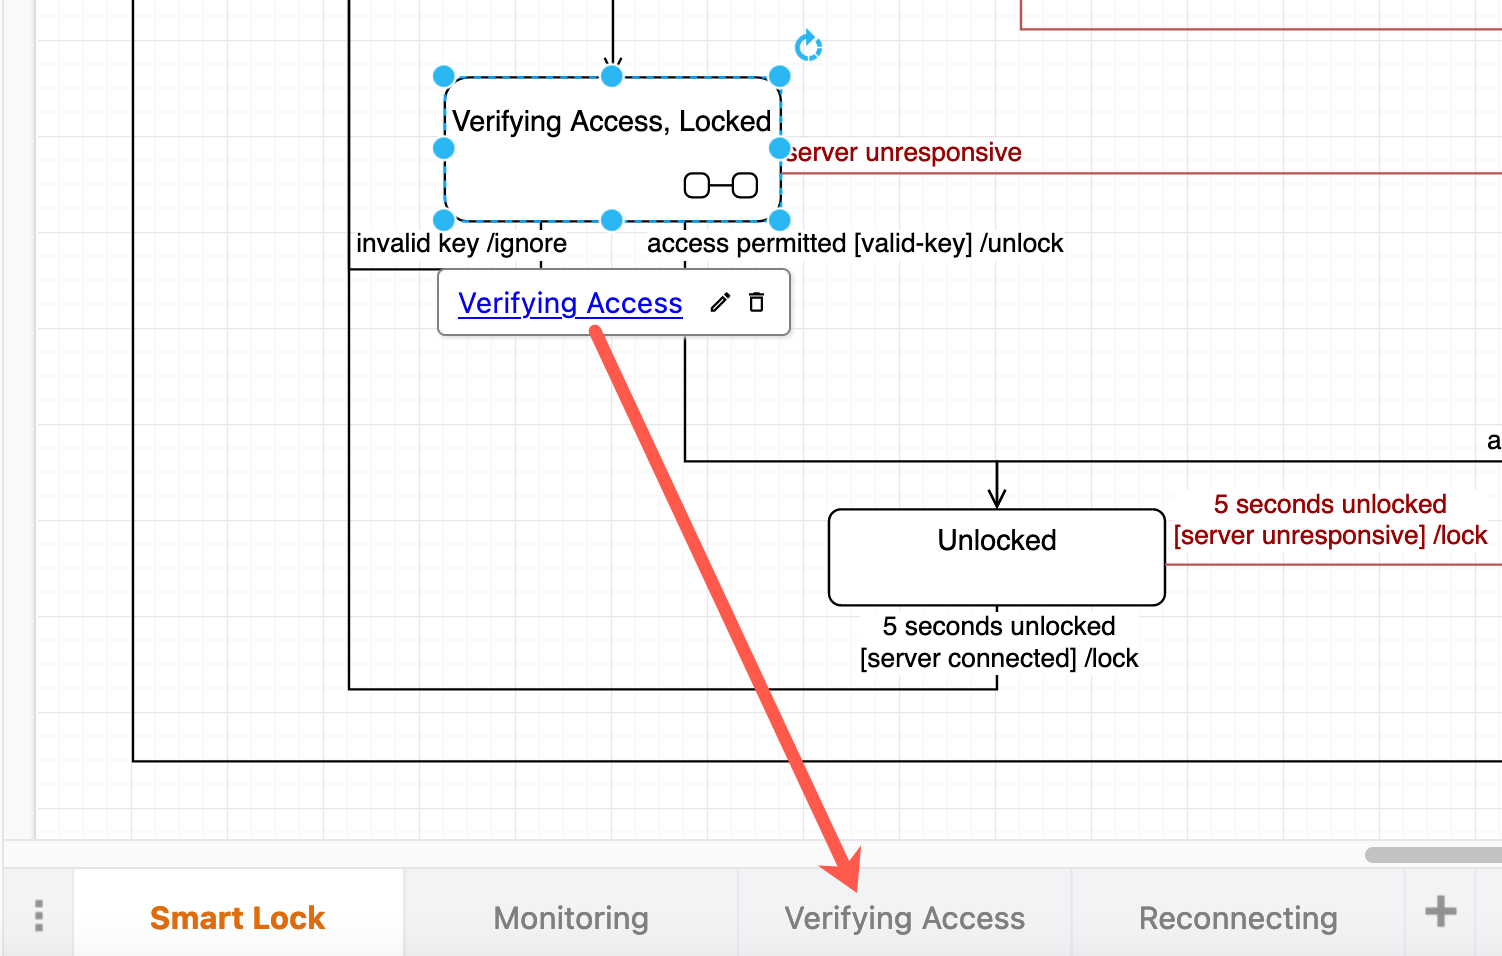
Link composite shapes to diagram pages
Add a link on the high level composite state shape to another diagram page containing the diagram of the sub-state. Right-click on the shape, select Edit Link, then select which diagram page to link to, and click Apply.
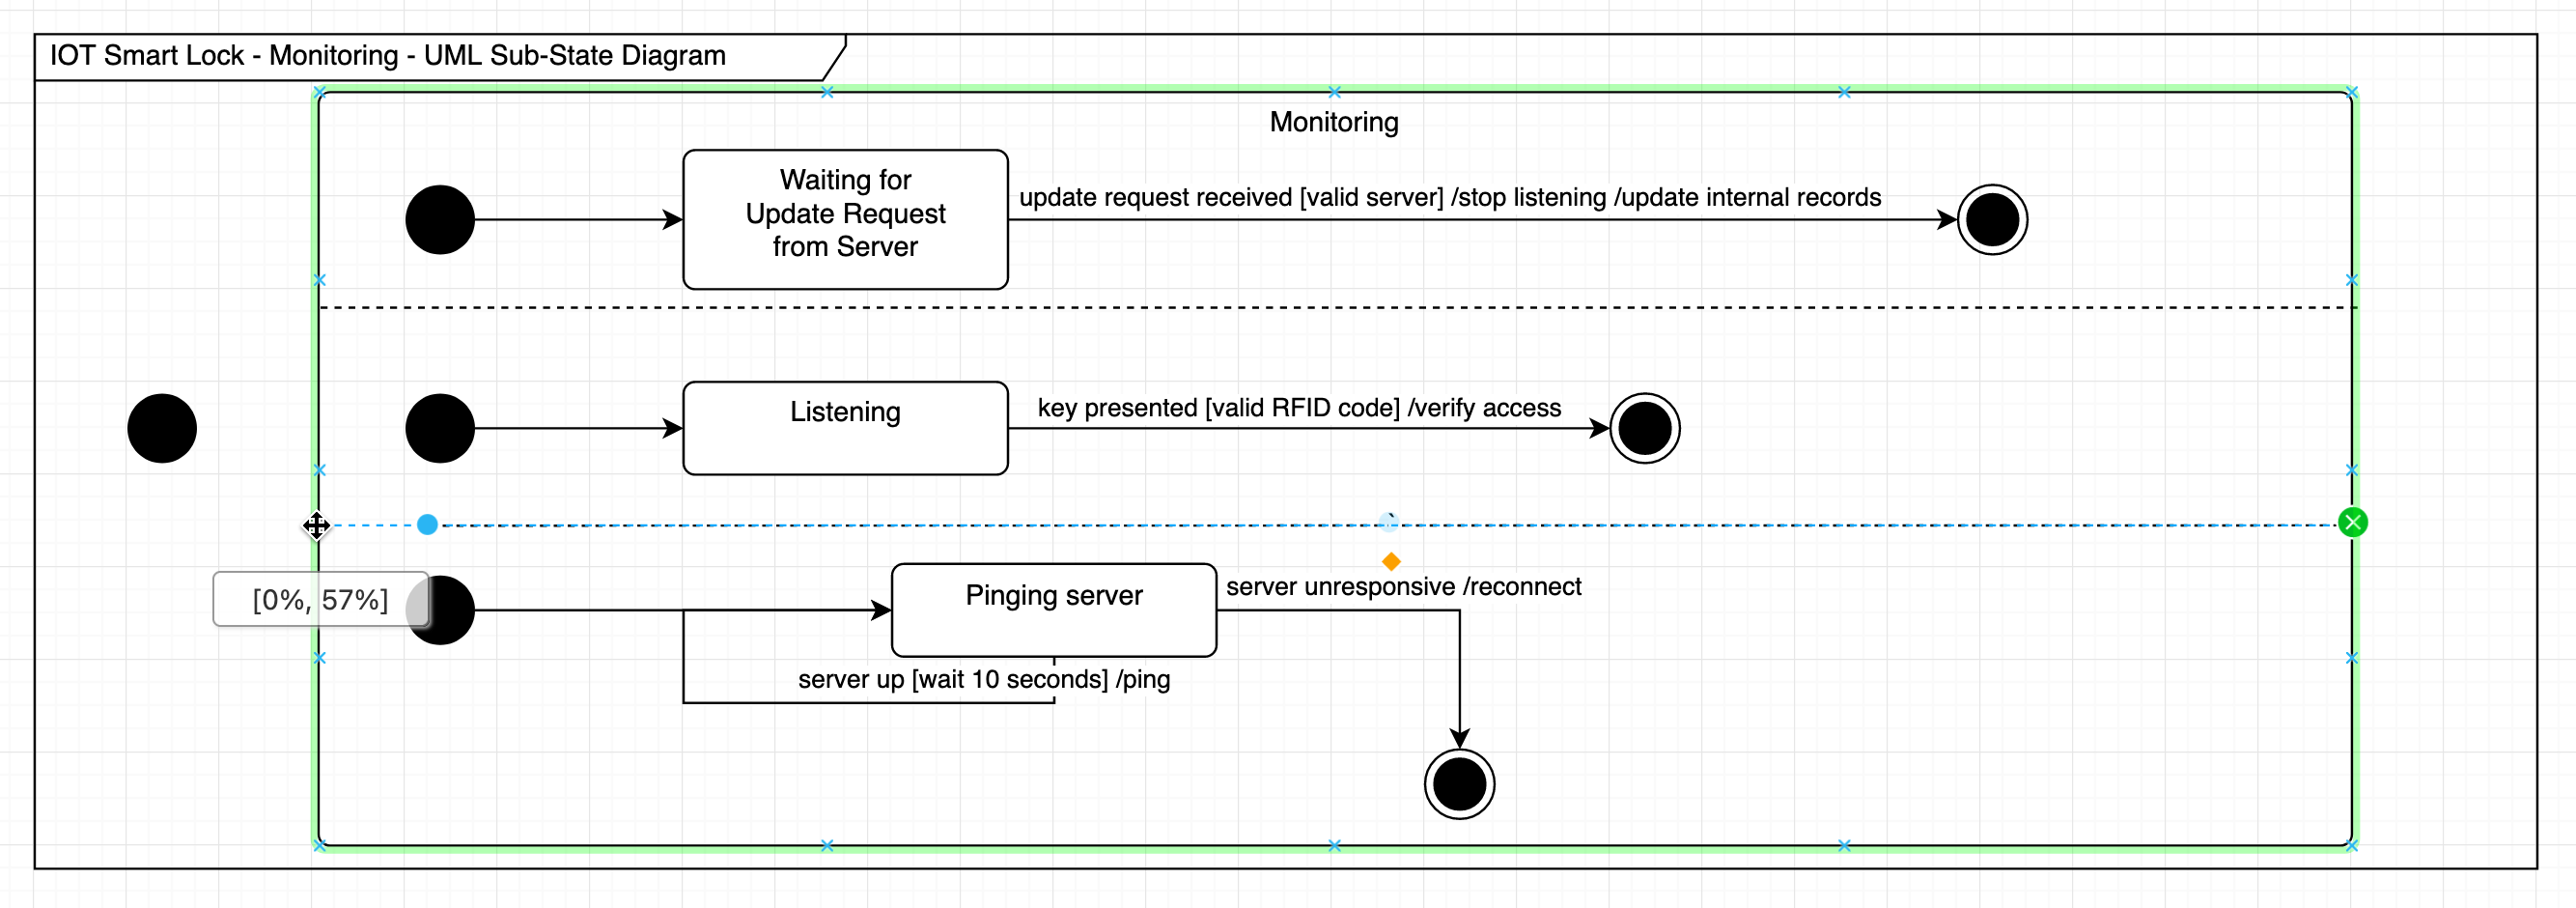
Draw regions
States can contain concurrent regions, also known as orthogonal regions. These are indicated with a dashed horizontal or vertical line inside, to show that multiple state machines are active at the same time.
Use a dashed connector and attach it as a fixed connection to the state shape - drop the connector when the outline of the shape is green.
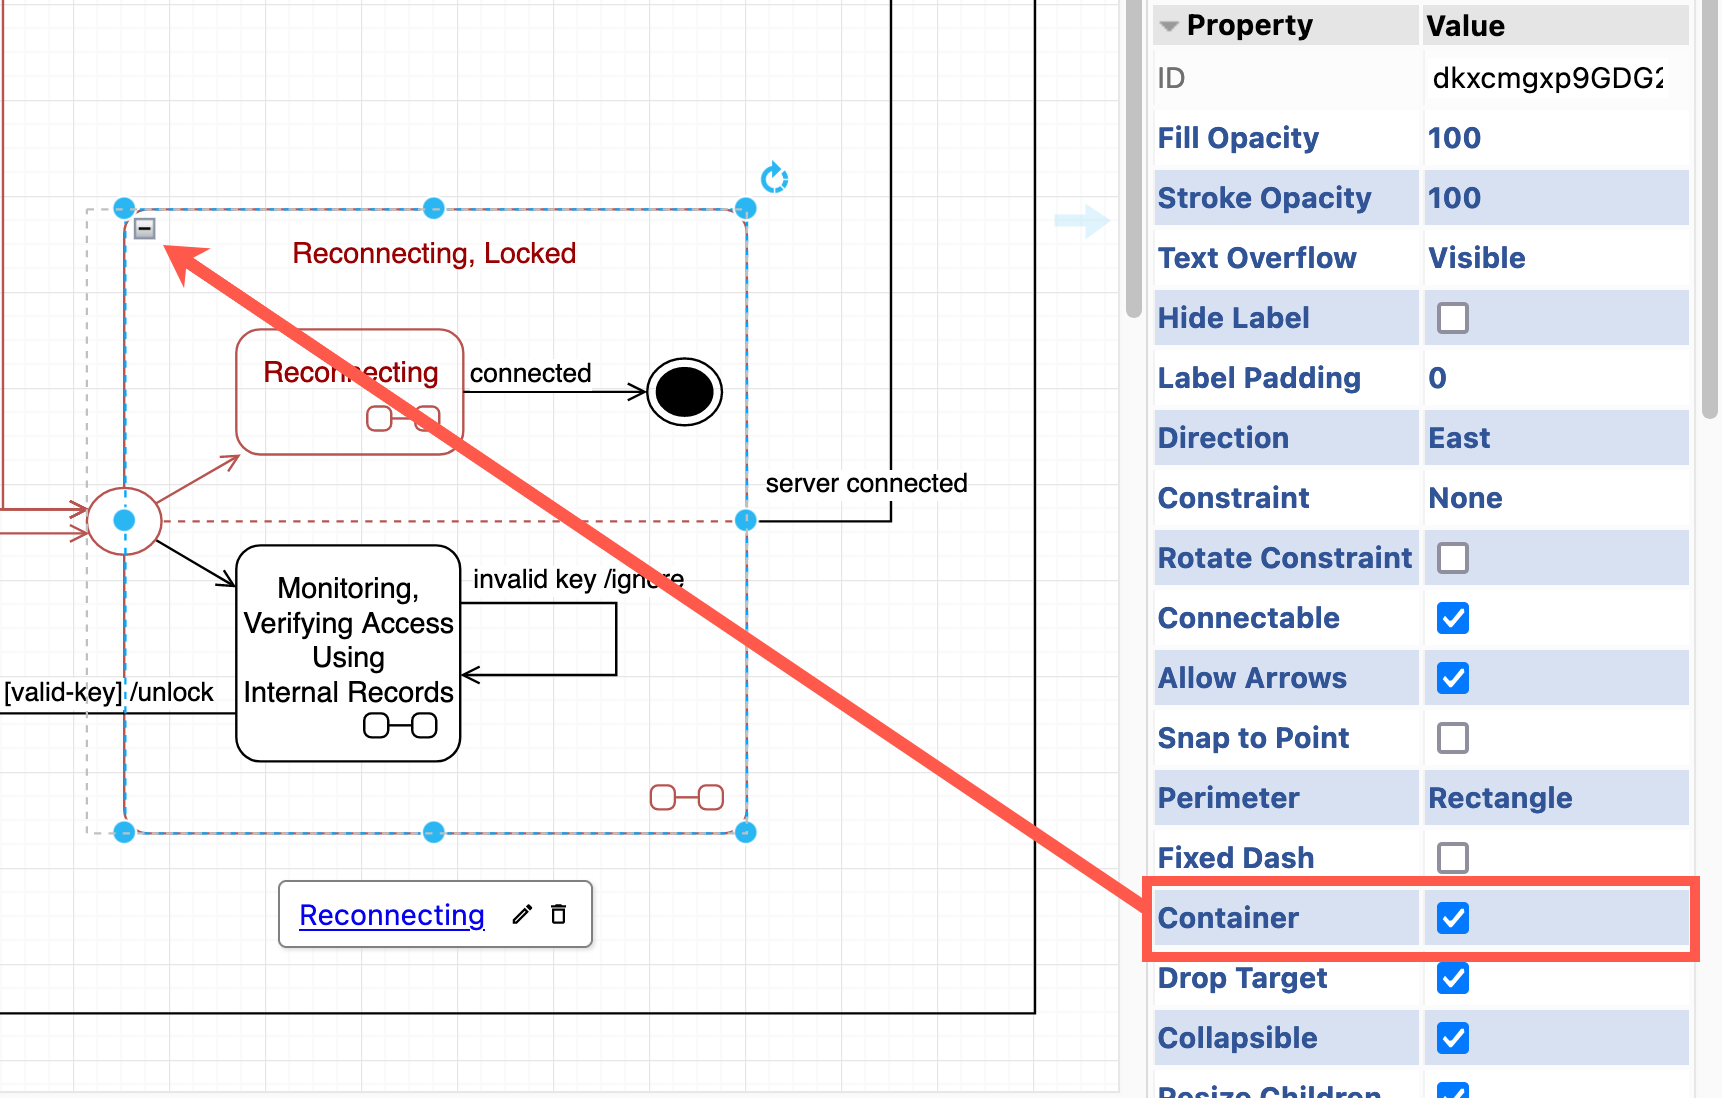
Turn a state into a container
You can also turn a state into a container shape where you can draw a sub-state diagram. This is useful because when you move the container state, the sub-state moves with it.
Select the shape, then open the Properties section in the Style tab of the format panel. Enable the Container checkbox.
Create a UML state diagram from text
You can define a state diagram in text using Mermaid syntax, and draw.io will generate the diagram for you.
- Click Arrange > Insert > Advanced > Mermaid to open the text entry.
- Enter the Mermaid description of your state machines in the textbox, and click Apply. The diagram editor will convert this to a SVG representation on the canvas. Double-click on this to edit the Mermaid again.
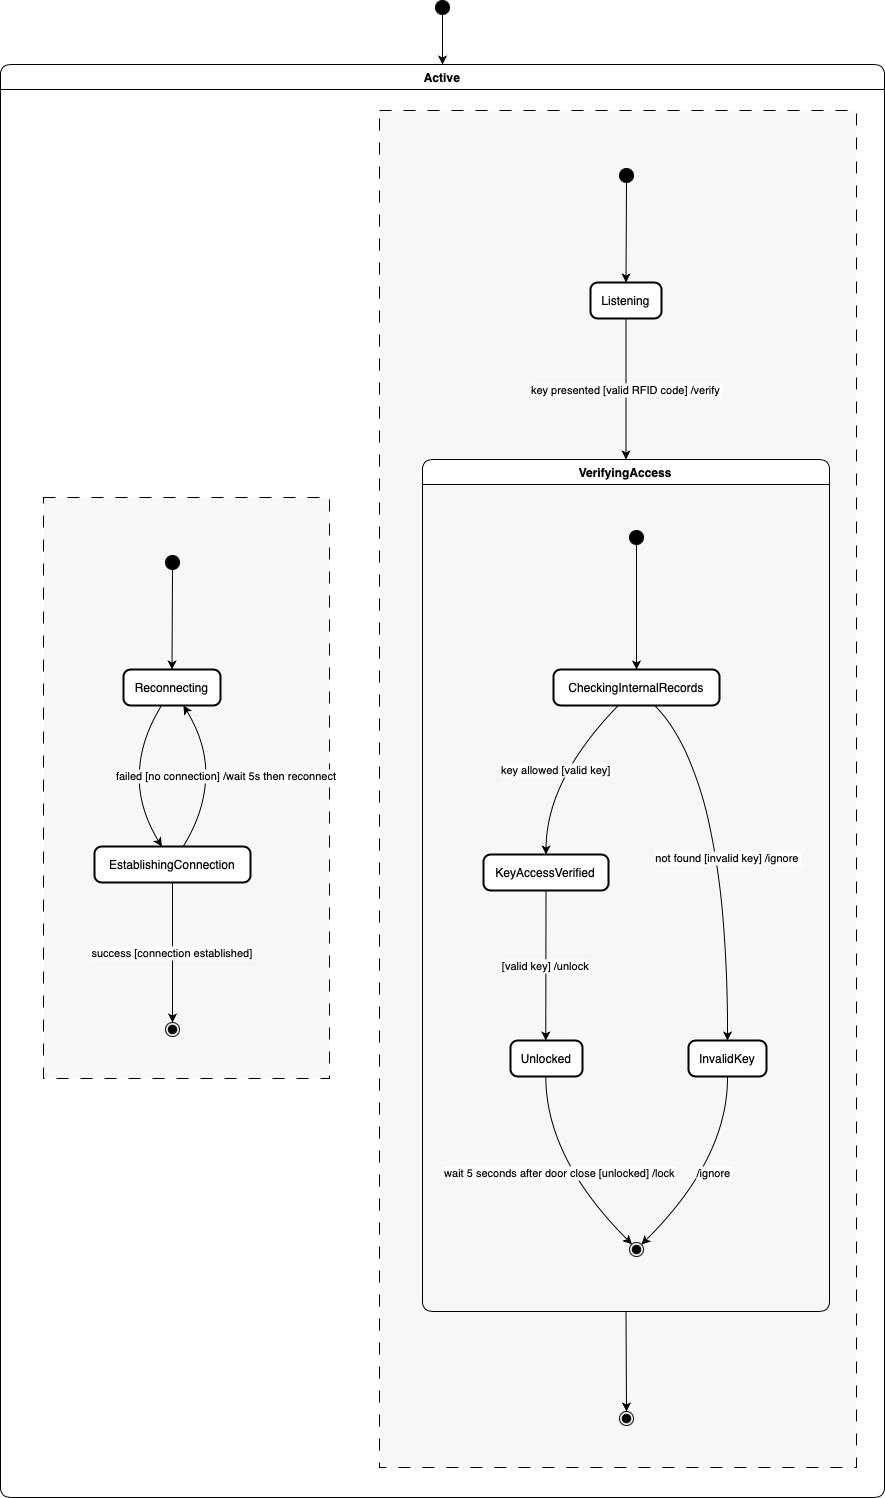
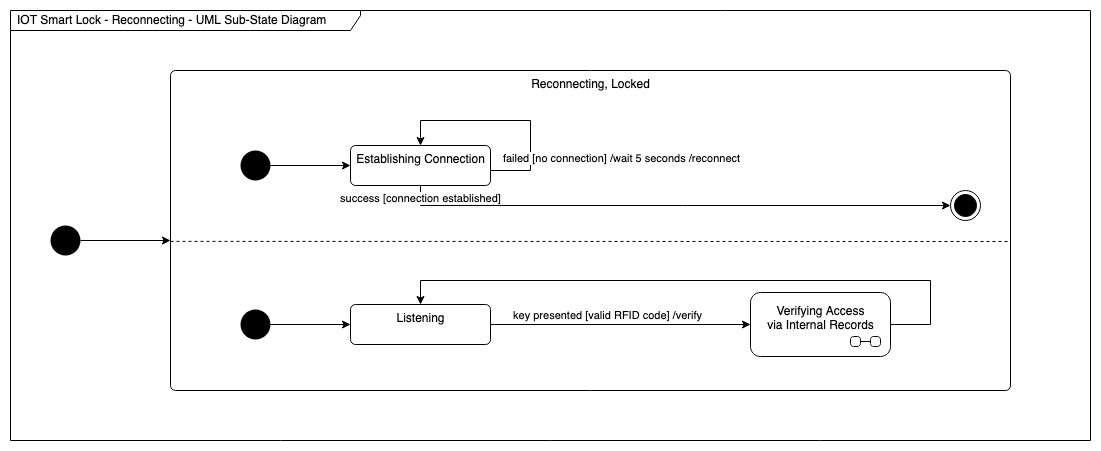
For example, turning the example of the composite Reconnecting state above into a Mermaid text description:
stateDiagram-v2
  [*] --> Active
  state Active {
    [*] --> Reconnecting
    Reconnecting --> EstablishingConnection
    EstablishingConnection --> Reconnecting : failed [no connection] /wait 5s then reconnect
    EstablishingConnection --> [*] : success [connection established]
  --
  [*] --> Listening
  Listening  --> VerifyingAccess : key presented [valid RFID code] /verify
  VerifyingAccess --> [*]
    state VerifyingAccess{
      [*] --> CheckingInternalRecords
      CheckingInternalRecords --> KeyAccessVerified : key allowed [valid key]
      KeyAccessVerified --> Unlocked : [valid key] /unlock
      Unlocked --> [*] : wait 5 seconds after door close [unlocked] /lock
      CheckingInternalRecords --> InvalidKey : not found [invalid key] /ignore
      InvalidKey --> [*] : /ignore
    }
  }
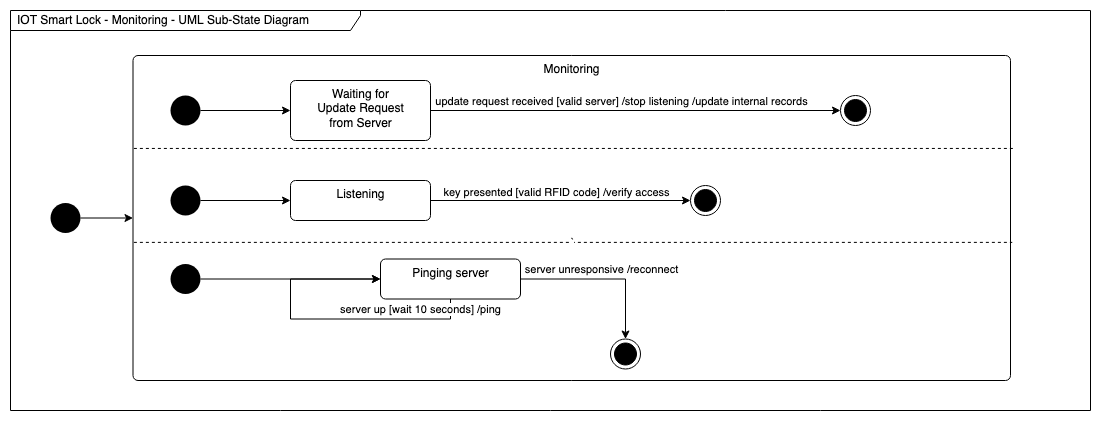
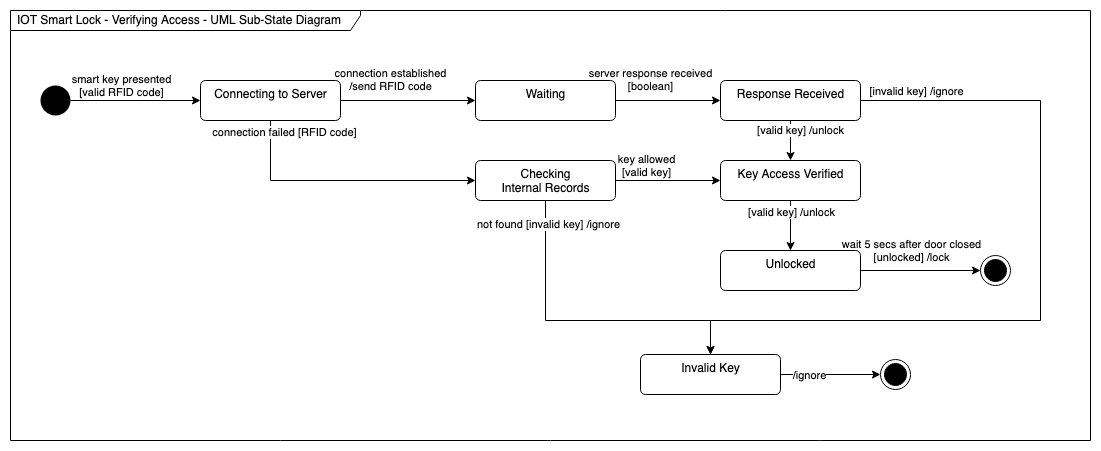
Example UML state diagrams - smart lock
The following state and sub-state diagrams document a smart lock system that relies on an internet connection to update their records (keys with RFID tags embedded in them). In this case, the system also uses the server's records unless the connection to the server is lost.
What problems can you discover by analysing these diagrams?
Open this example in our diagram viewer
More UML diagrams
The UML specification allows you to draw many different types of diagrams to model the behaviour and data of a system in different ways.
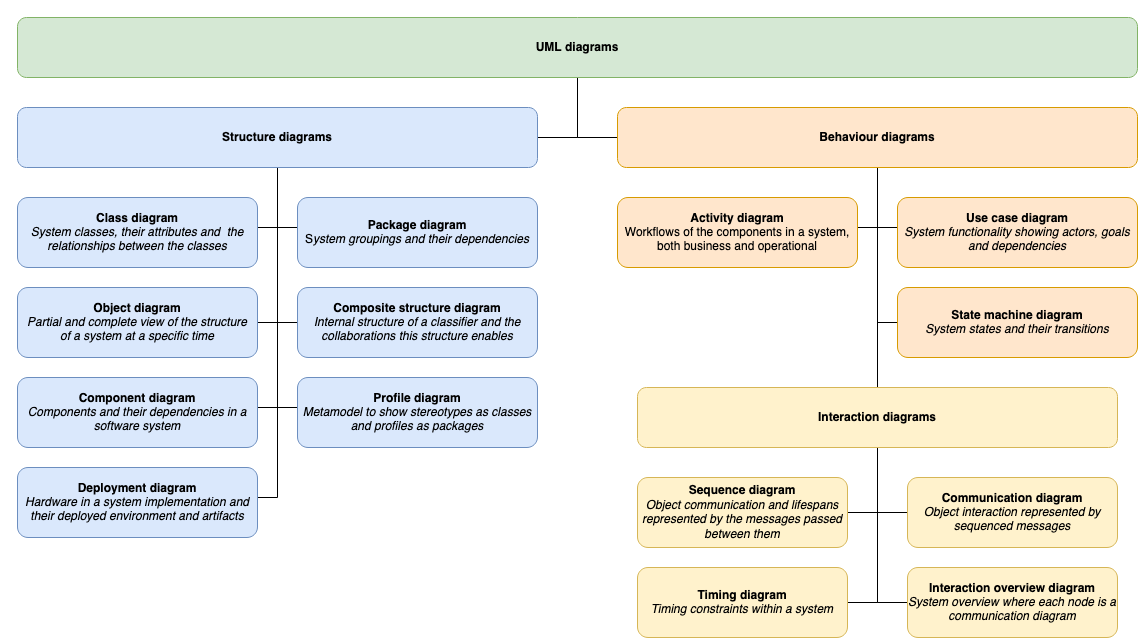
Refer to the UML diagram overview post for details of the many other types of UML diagrams.