Complex diagramming on an online whiteboard
Many people prefer a minimal interface for diagramming, as there are fewer distractions. While online whiteboard applications often have a limited set of available tools, draw.io lets you use its advanced features in a less cluttered diagram editor theme.
As the interface is simpler in our online whiteboard at sketch.diagrams.net the advanced diagramming tools are in less obvious places, but they are all still available.
Here's how to change and use the Sketch editor theme to use all of the draw.io tools and menus you normally see in the Classic editor theme and draw complex technical diagrams.
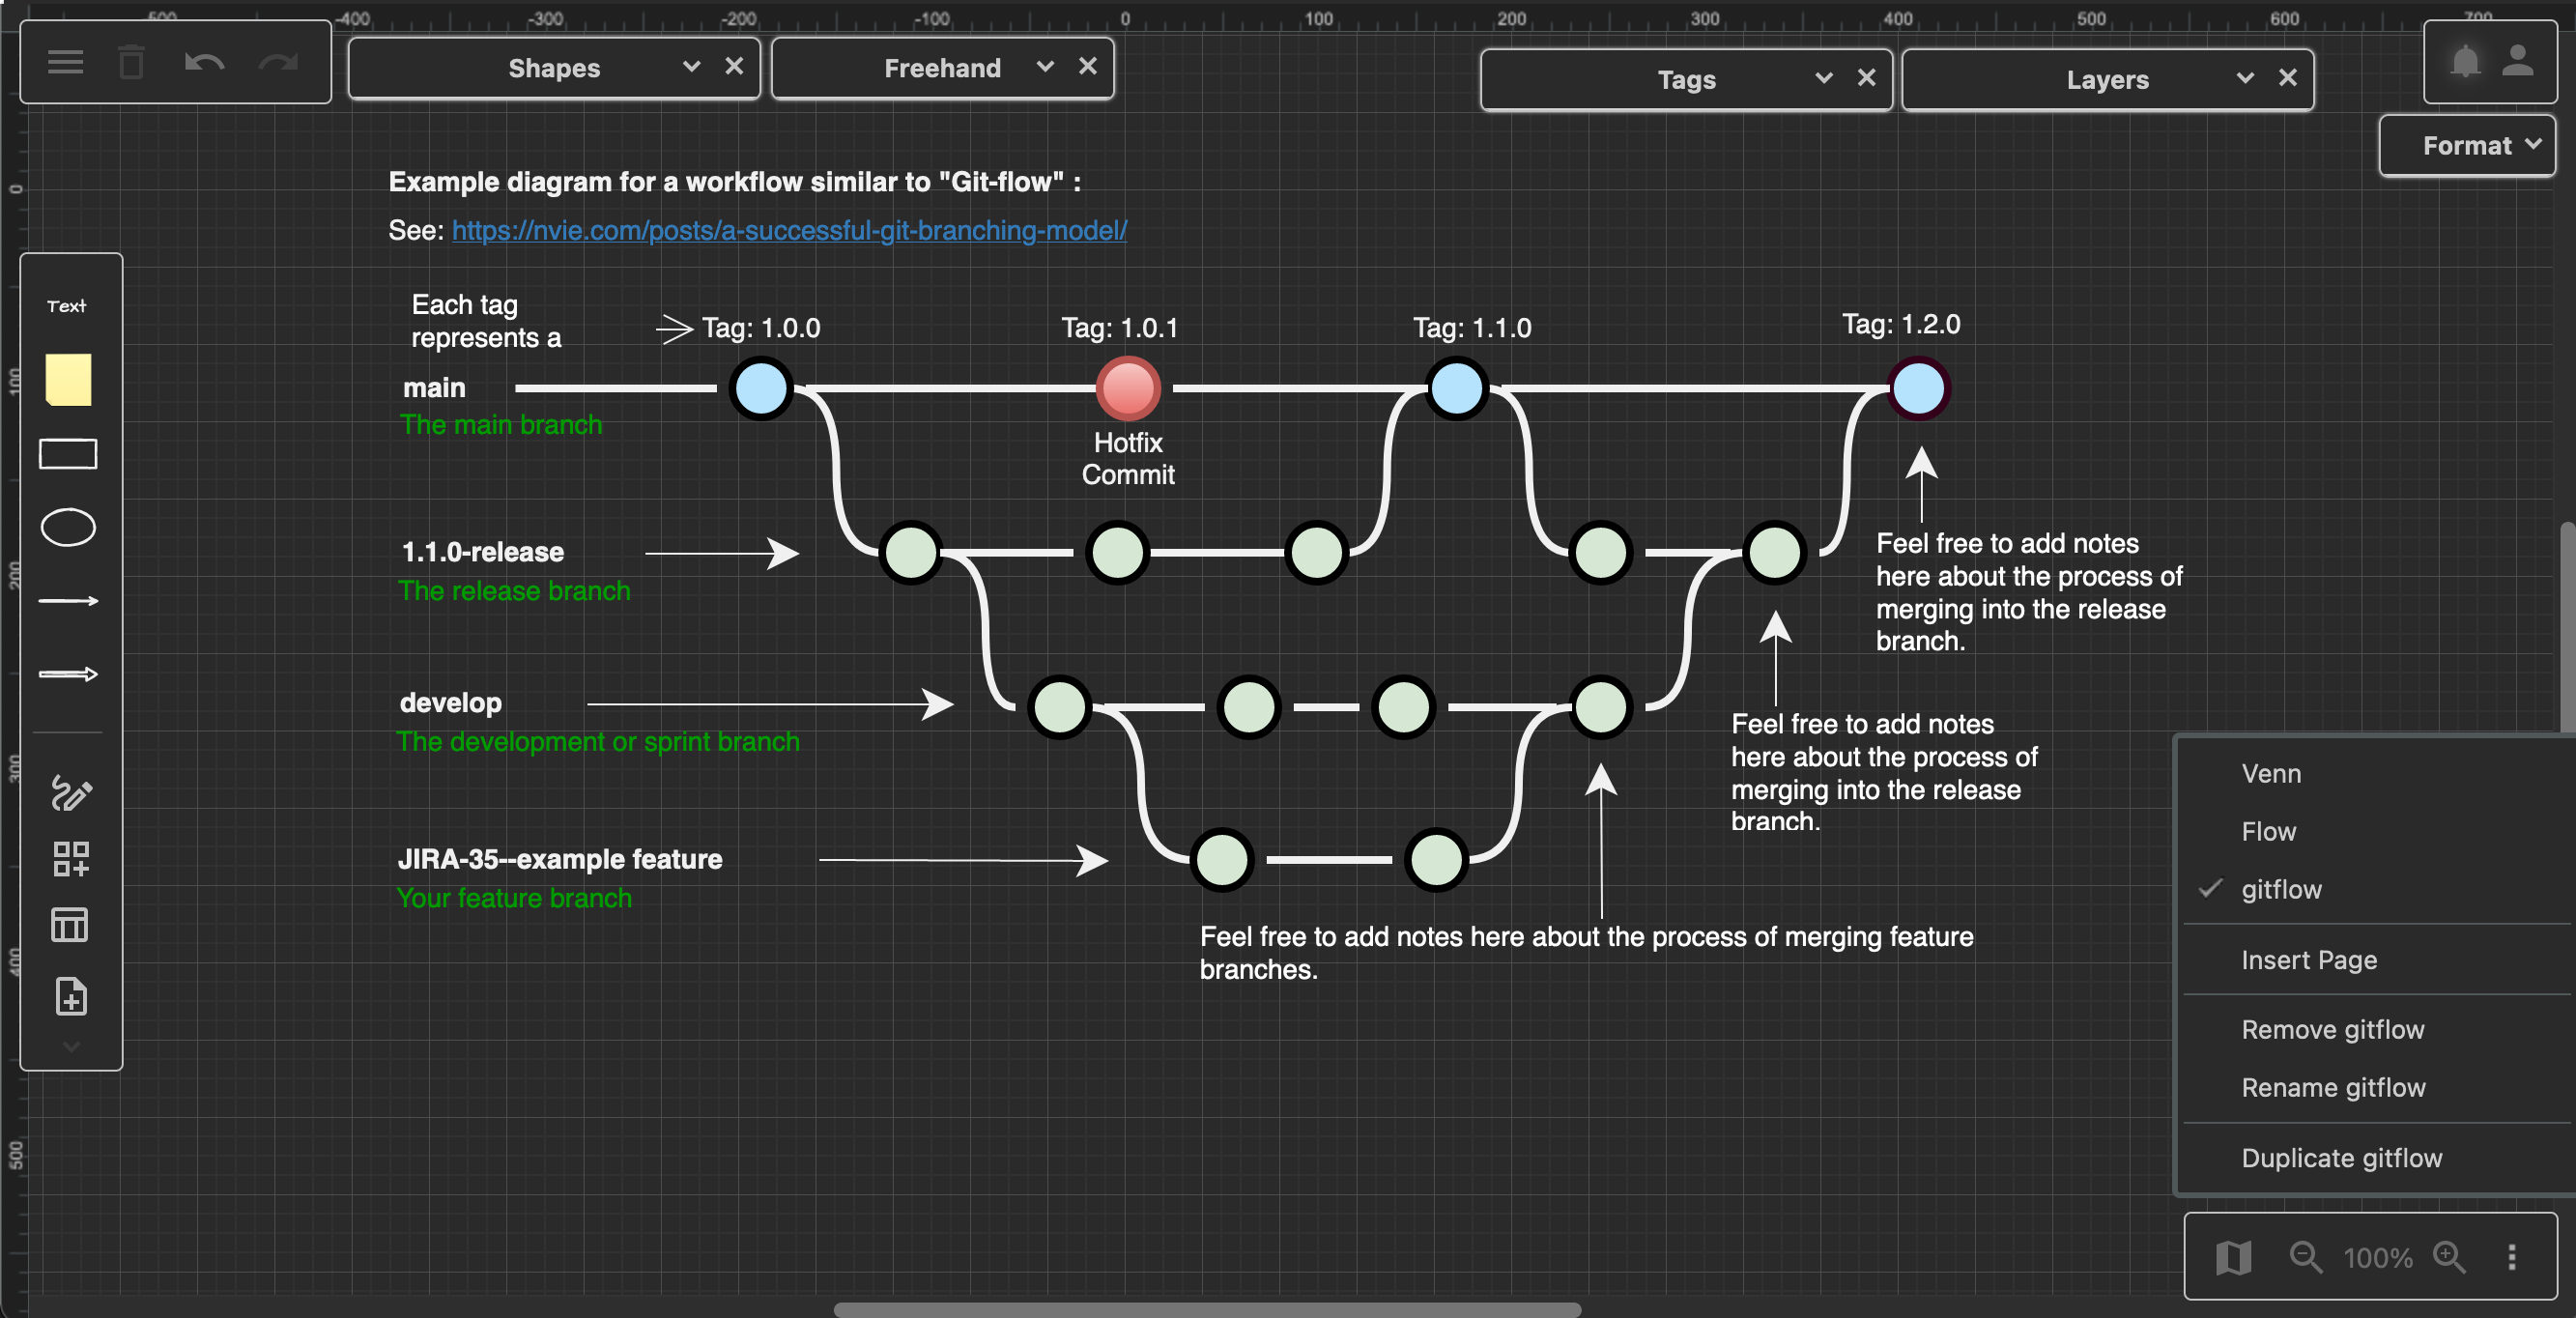
Display and hide panels and floating dialogs
Click on the arrows to the right of the title of panels and floating dialogs to expand or collapse them, or click on the cross to close them. Drag them around the drawing canvas to get them out of the way of your diagram.
- Shapes: Click on the Shapes tool in the toolbar on the left.
- Format: Expand the panel on the right.
- Layers: Click on the menu icon in the top left, then select Layers.
- Tags: Click on the menu icon, then select Tags.
- Freehand: Click on the Freehand tool in the toolbar on the left.
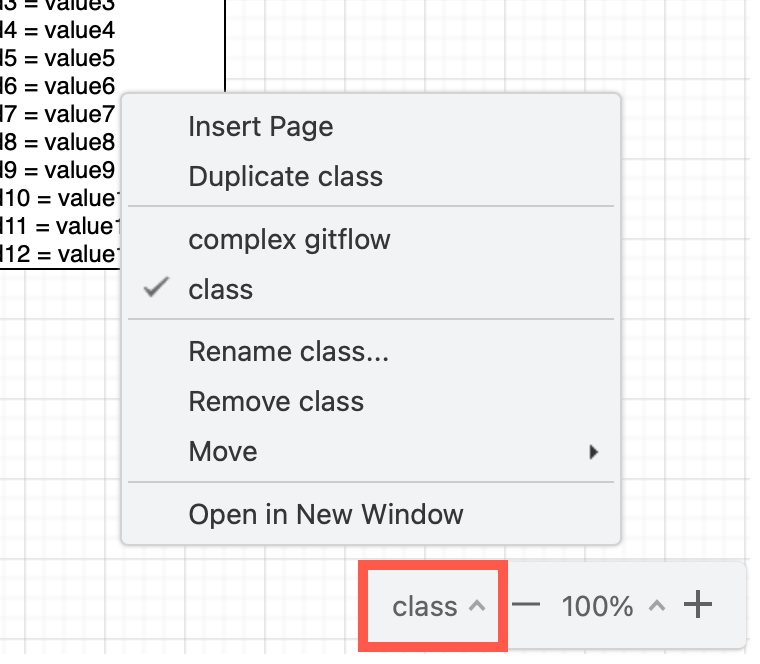
Create multi-page diagrams
Multiple pages in a diagram are useful when you need to drill down into details or explore alternatively solutions, but keep all the diagrams together in one file. You can also add links on shapes that open another diagram page when you click on them.
- Click on the page name in the lower right. The pages in your diagram are in the second section, with the current one indicated with a check mark.
- Insert Page adds a new diagram page.
- Duplicate ... makes a copy of the current diagram page.
- Rename ... lets you rename the current diagram page.
- Remove ... deletes the current diagram page.
- Move lets you reorder the current diagram page.
Learn more about working with multi-page diagrams
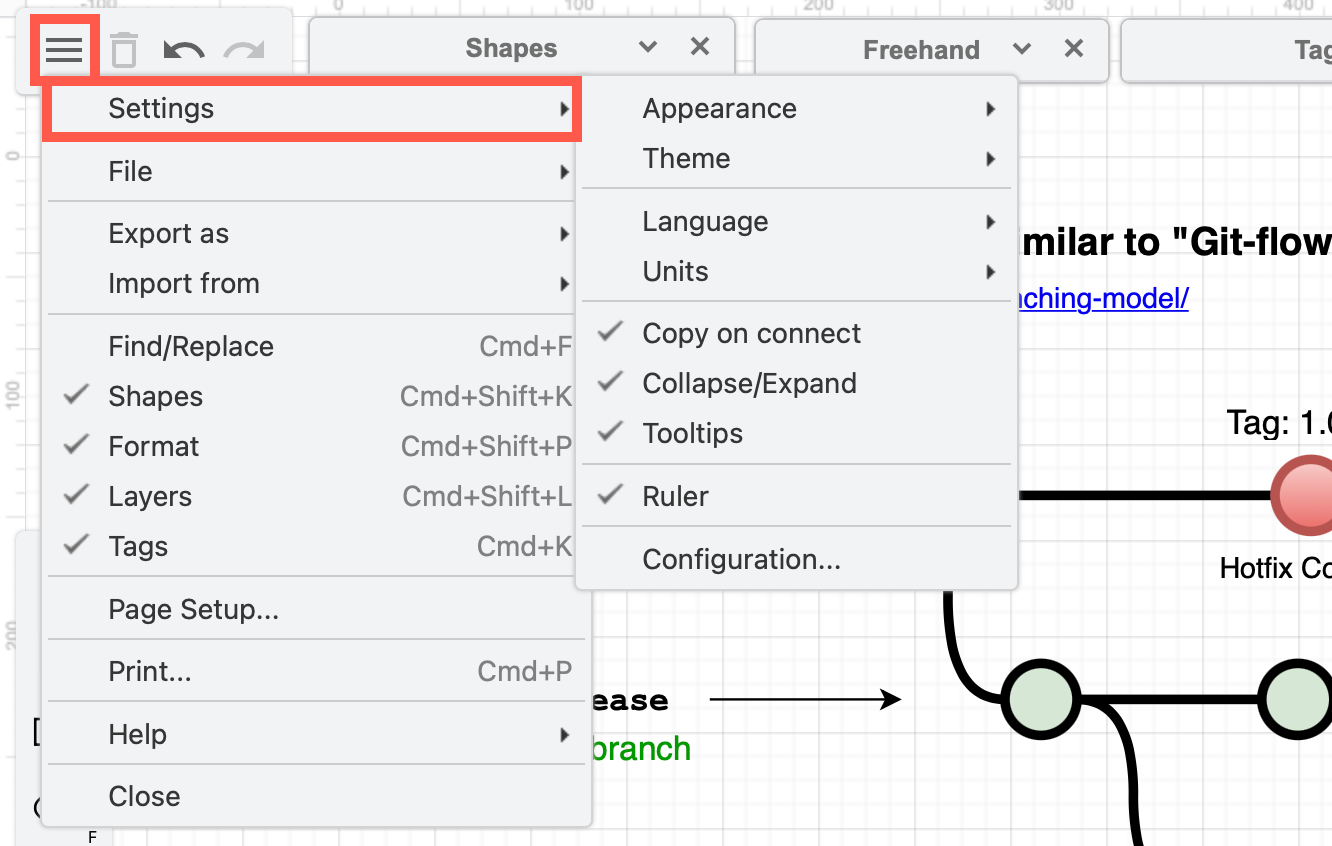
Use additional diagramming features
In the menu under Settings, there are a number of options and features that change the editor and drawing canvas tools.
- Appearance: Switch between dark and light mode.
- Theme: Switch to another diagram editor theme. This requires you to refresh the browser tab - make sure you save your diagram first.
- Language: Change the language used in the editor.
- Units: Choose a measurement unit - points, inches, millimeters or meters.
- Tooltips: Enable or disable tooltips that appear when you hover over the tools in the editor.
- Ruler: Display or hide a ruler to the left and top of the diagram editor.
- Configuration: Set default styles for shapes, custom fonts, custom templates, custom shape libraries, and more.
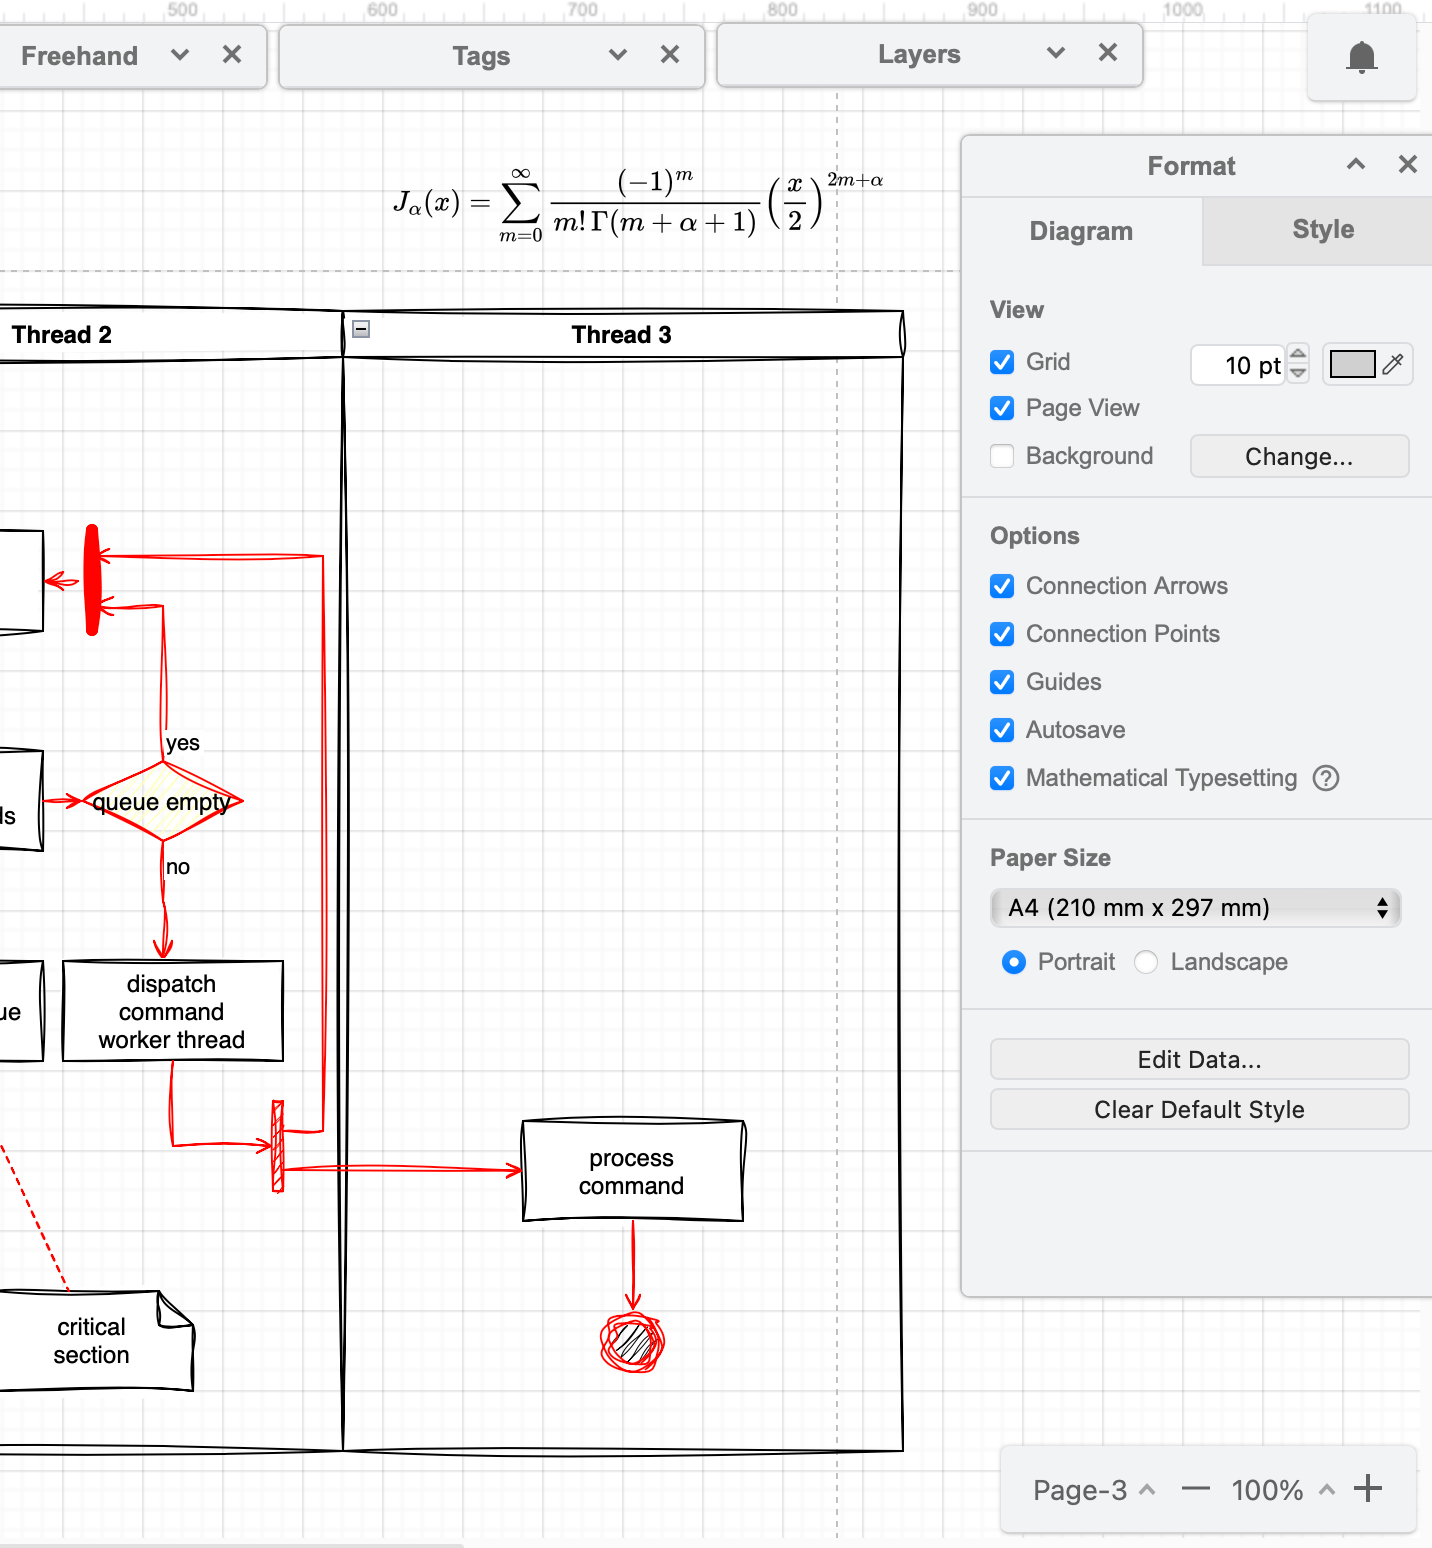
Some options are available in the format panel on the right. Make sure nothing is selected in your diagram so you can see the Diagram tab.
- Grid: Display or hide the drawing canvas grid. Disabled by default.
- Page View: Display the drawing canvas as a printable pages, or as an infinite canvas. Disabled by default.
- Background: Change the background colour, set a background image, or use one diagram page as a background image for other pages. You must enable Preferences > Pages to use this feature.
- Connection Arrows, Connection Points & Guides: Display or hide the helpful guidelines that appear when you hover over a shape, or move a shape near other shapes on the drawing canvas.
- Mathematical Typesetting: Enter LaTeX or AsciiMath to render equations neatly using MathJax.
Do more with shapes on the whiteboard
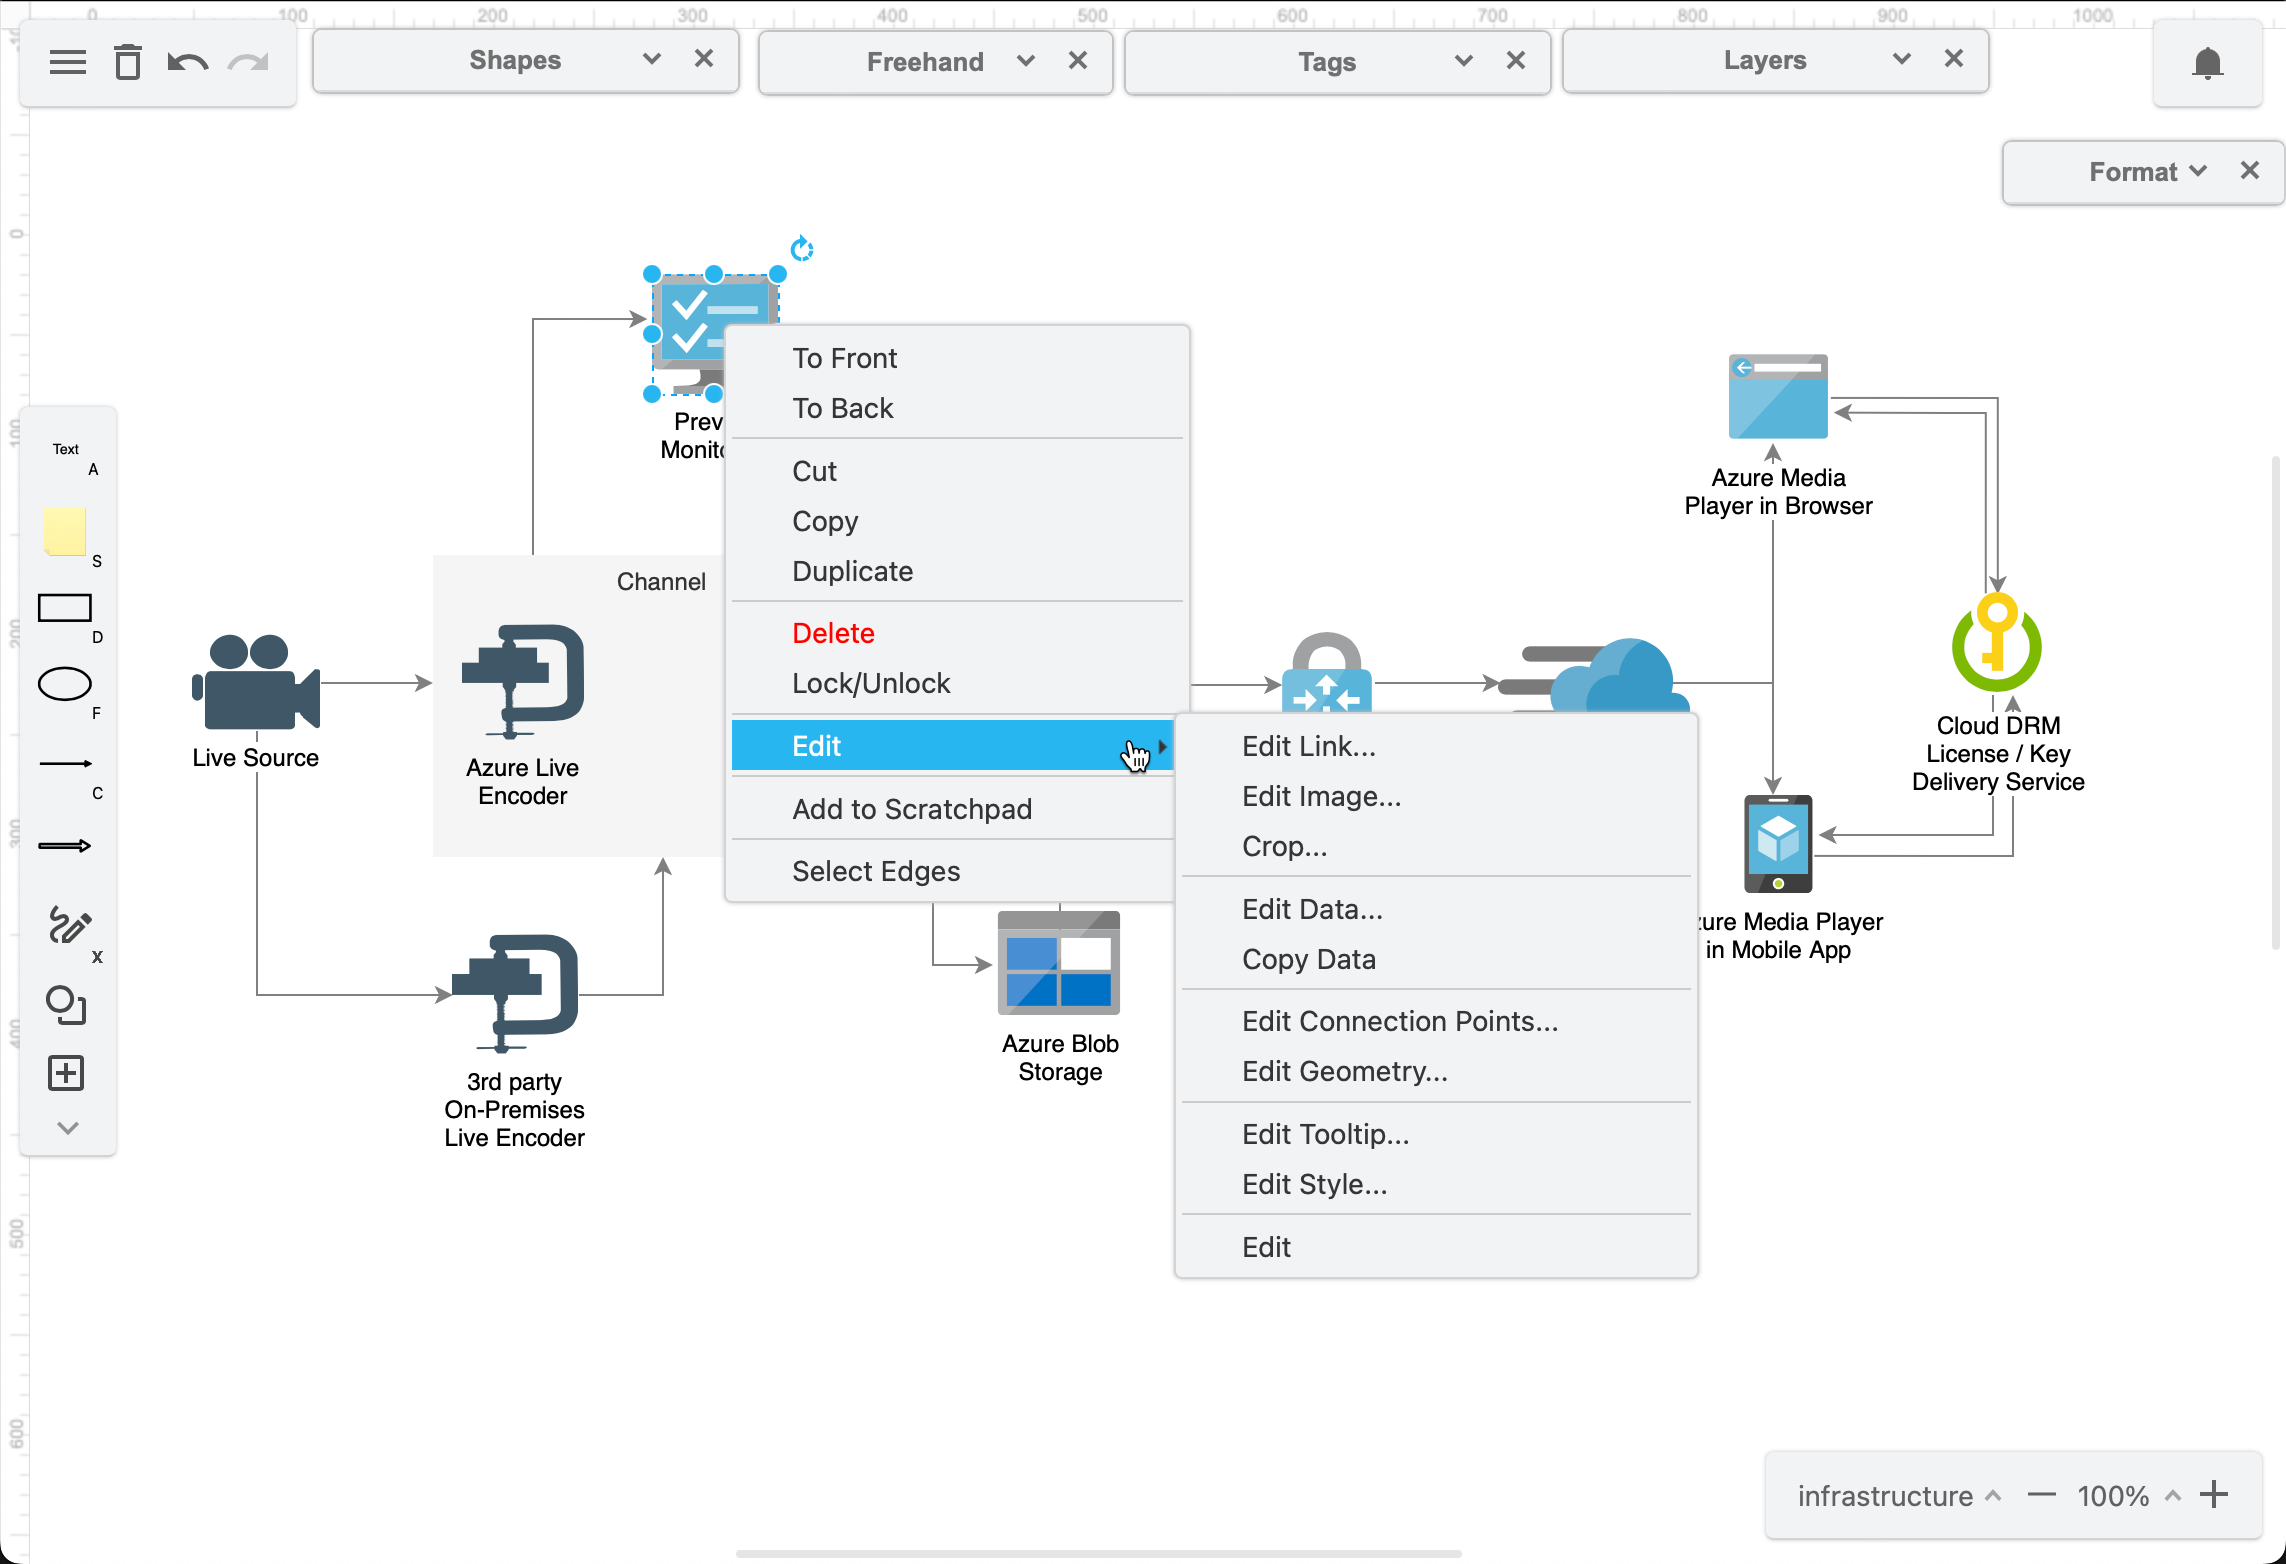
Right-click on a shape to open the context menu, then select Edit. From there, you can work with shapes in many different ways.
- Edit Link to add a URL or a custom JSON link.
- Edit Image to change the image used in a shape label.
- Crop to re-crop an image shape.
- Edit Data to add custom properties or metadata and placeholders to shapes.
- Copy Data to copy the shape metadata.
- Edit Connection Points to modify the shape's fixed connection points.
- Edit Geometry to specify an exact position, size or rotation.
- Edit Tooltip to define a tooltip that appears when you hover over the shape.
- Edit Style to define a specific shape style with key-value pairs.
- Edit to highlight and edit the shape label.
There are also many keyboard shortcuts that can help you work with shapes much faster.
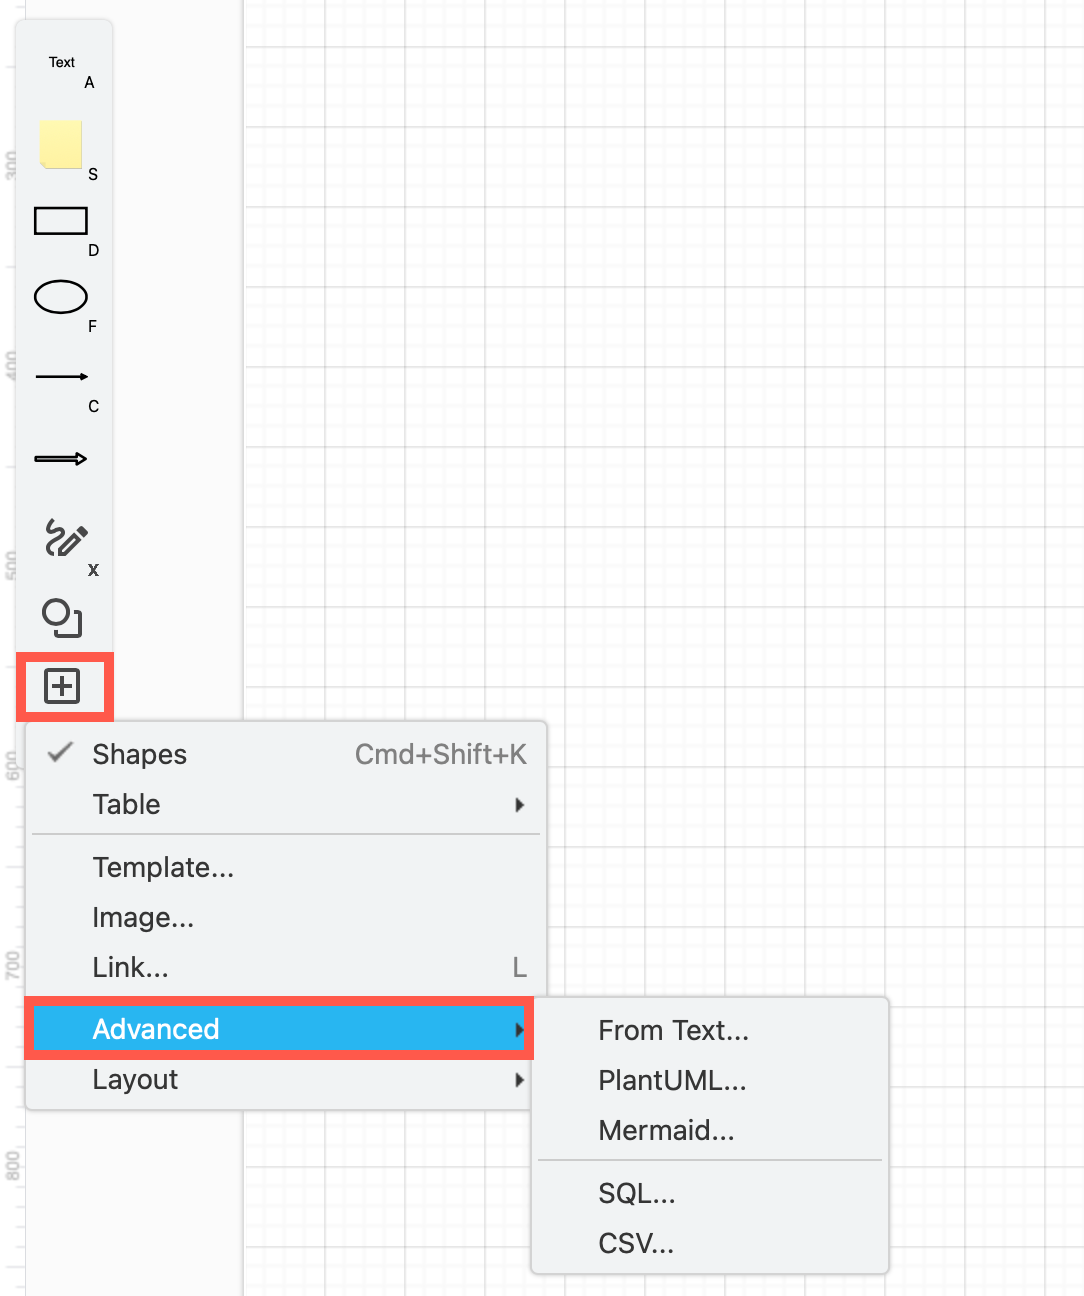
Create a diagram from CSV, text, UML and SQL
- Click on the
+in the toolbar and select Advanced to see these text-to-diagram creation tools. - Select one of the options to open a dialog with an example. Replace the example with your own text, and click Insert.
Learn more about these import options:
Share and comment on diagram files
If you are using cloud storage platforms - Google Drive or Microsoft OneDrive - to save your diagram files, you can share your diagrams with others.
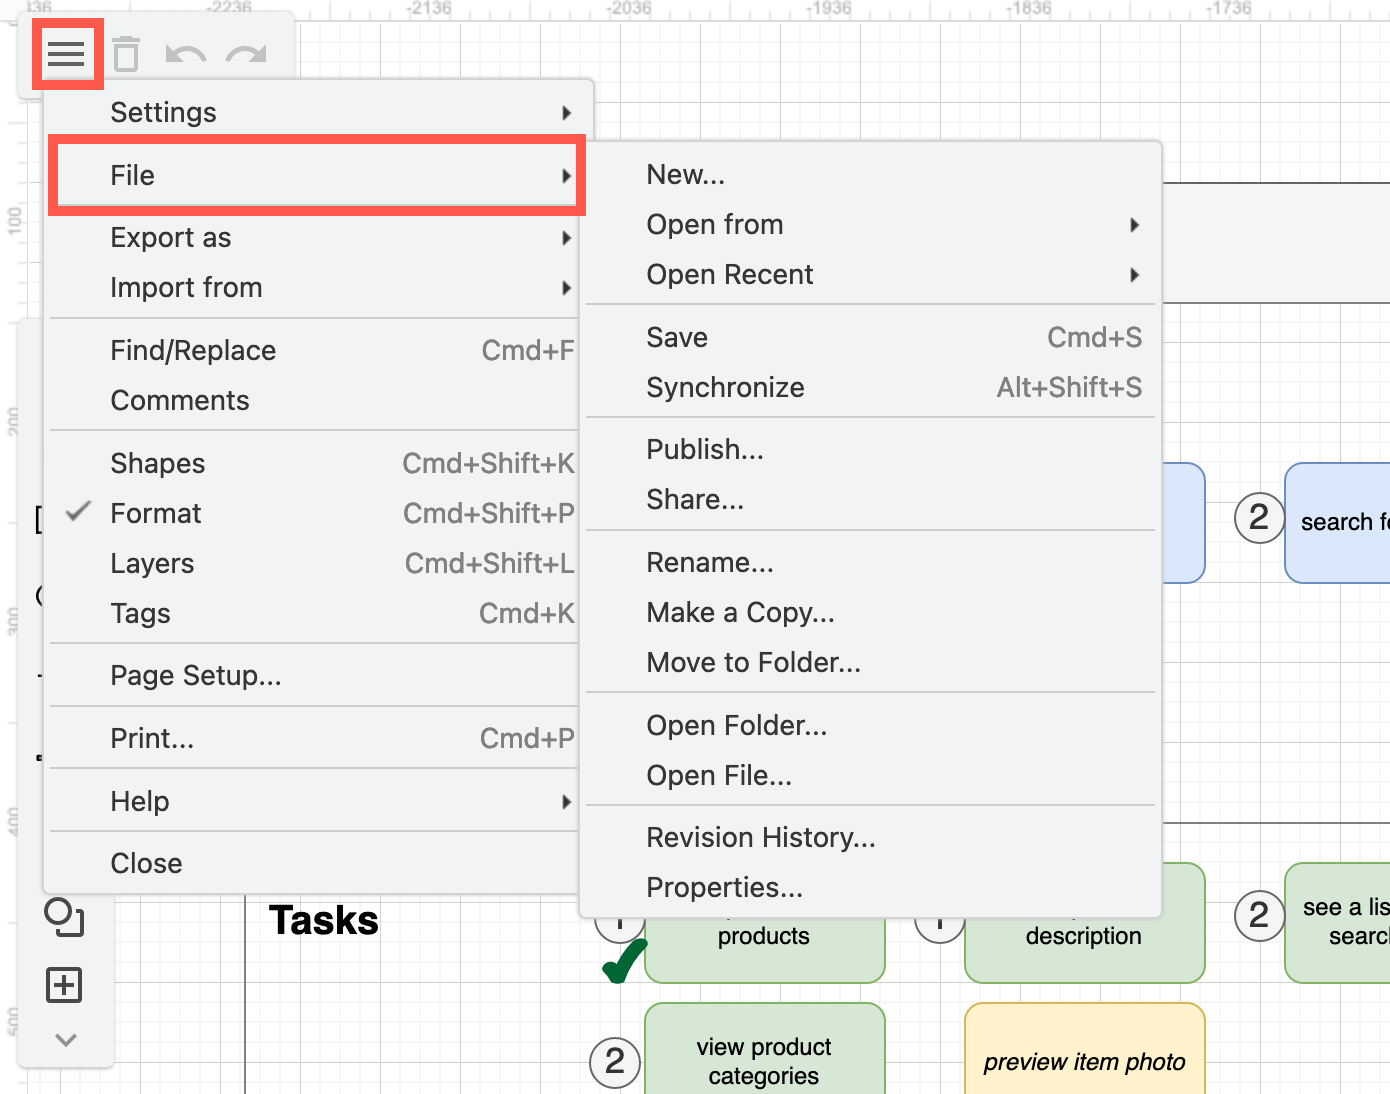
- From the menu in the top left, select File > Share.
- Choose the sharing option you want to use and make sure you have set the permissions appropriately - public lets you share a link to the diagram file with anyone.
- If you are using Google Drive to store your diagram files, from the menu, select Comments to view, respond to, edit and delete comments on your shared diagram file.
Work with complex tables
Create complex tables with table, row and column titles (such as cross-functional flowcharts) using the Table tool (via the + in the toolbar on the left).
When you have selected a table or a row, use the tools in the Arrange tab of the format panel to add or remove columns and rows. Hover over any tool to see a descriptive tooltip.
Drop shapes and text into the container table cells, then drag connectors between them to create complex flow charts.
Related
Use tags to display or hide related shapes. Display the Tags dialog in the whiteboard-style editor via the menu.
Work with layers in a diagram. Display the Layers dialog in the whiteboard-style editor via the menu, or press Ctrl+Shift+L on Windows, Cmd+Shift+L on macOS.
Share your cursor and and make collaboration in real-time with your team on diagrams a smoother experience.