Flowcharts in Confluence
Steps in business processes and project documentation are easier to understand when visualised. As one of the most common families of diagrams, drawing flowcharts in Confluence lets you present complex information neatly and securely in your team and company knowledge base.
The draw.io apps for Confluence and Jira, developed by us here at JGraph, provide you with all the tools you need to create a range of flowcharts, from the simple to the highly specialised.
Skip to the types of flowcharts for Confluence teams below to see examples used by different teams.
Add a Flowchart to a Confluence page
- Edit a Confluence page and type
/draw.io. - Select the draw.io Diagram macro and press
Enter.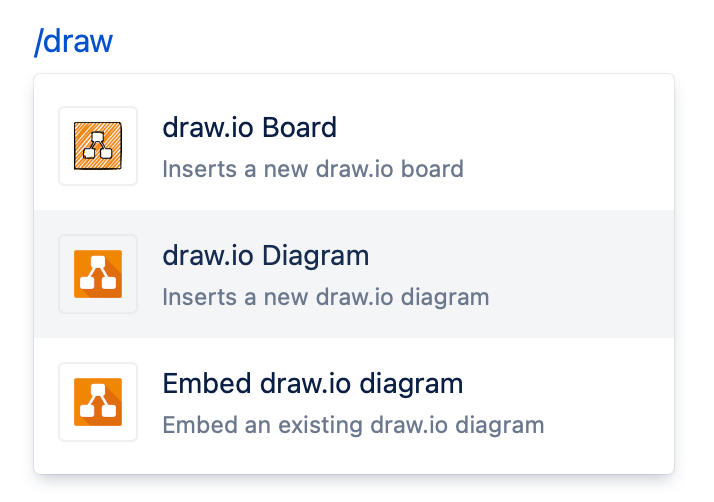
- Enter a name for your diagram, and click Create to start with a blank drawing canvas. Alternatively, select a template or example diagram before you click Create.
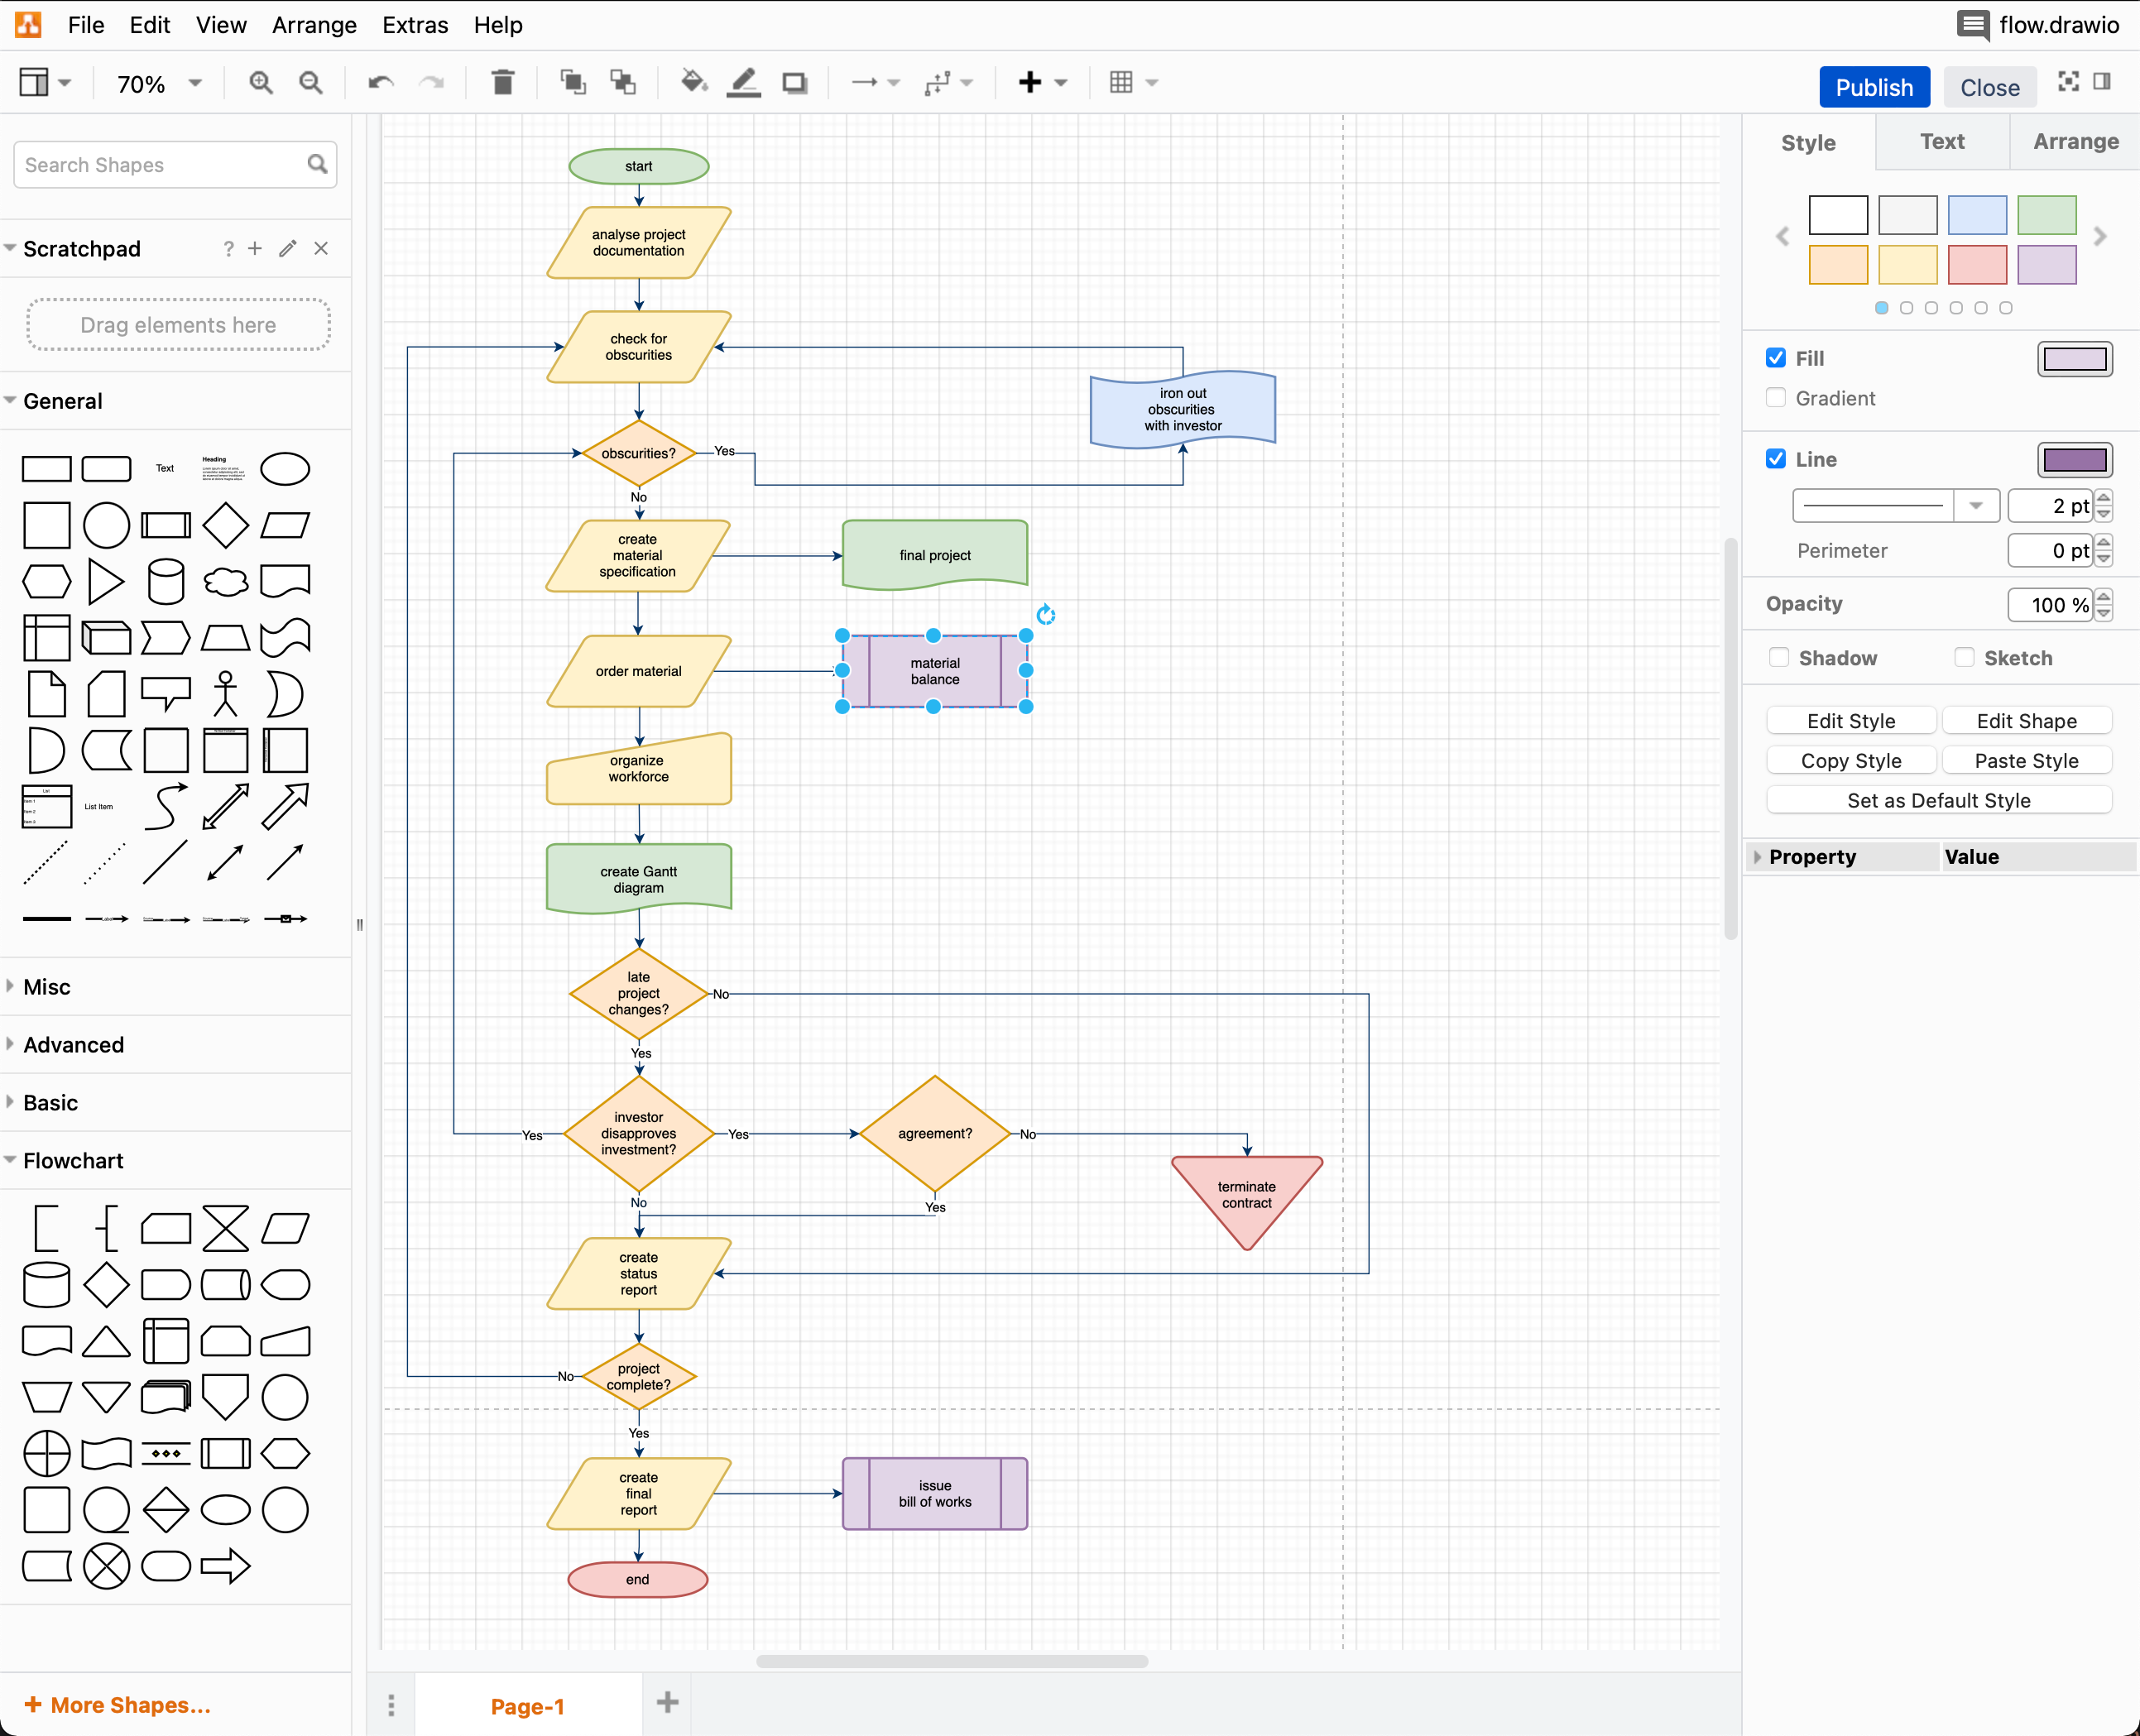
The basic flowchart shapes are available on the left in the General shape library.
- Click on or drag and drop a shape from the shape library onto the drawing canvas, or double click on the canvas and select a shape to add it.
- Drag connectors from one shape and drop them on another shape to connect each step in the flowchart.
- Style shapes using the format panel on the right.
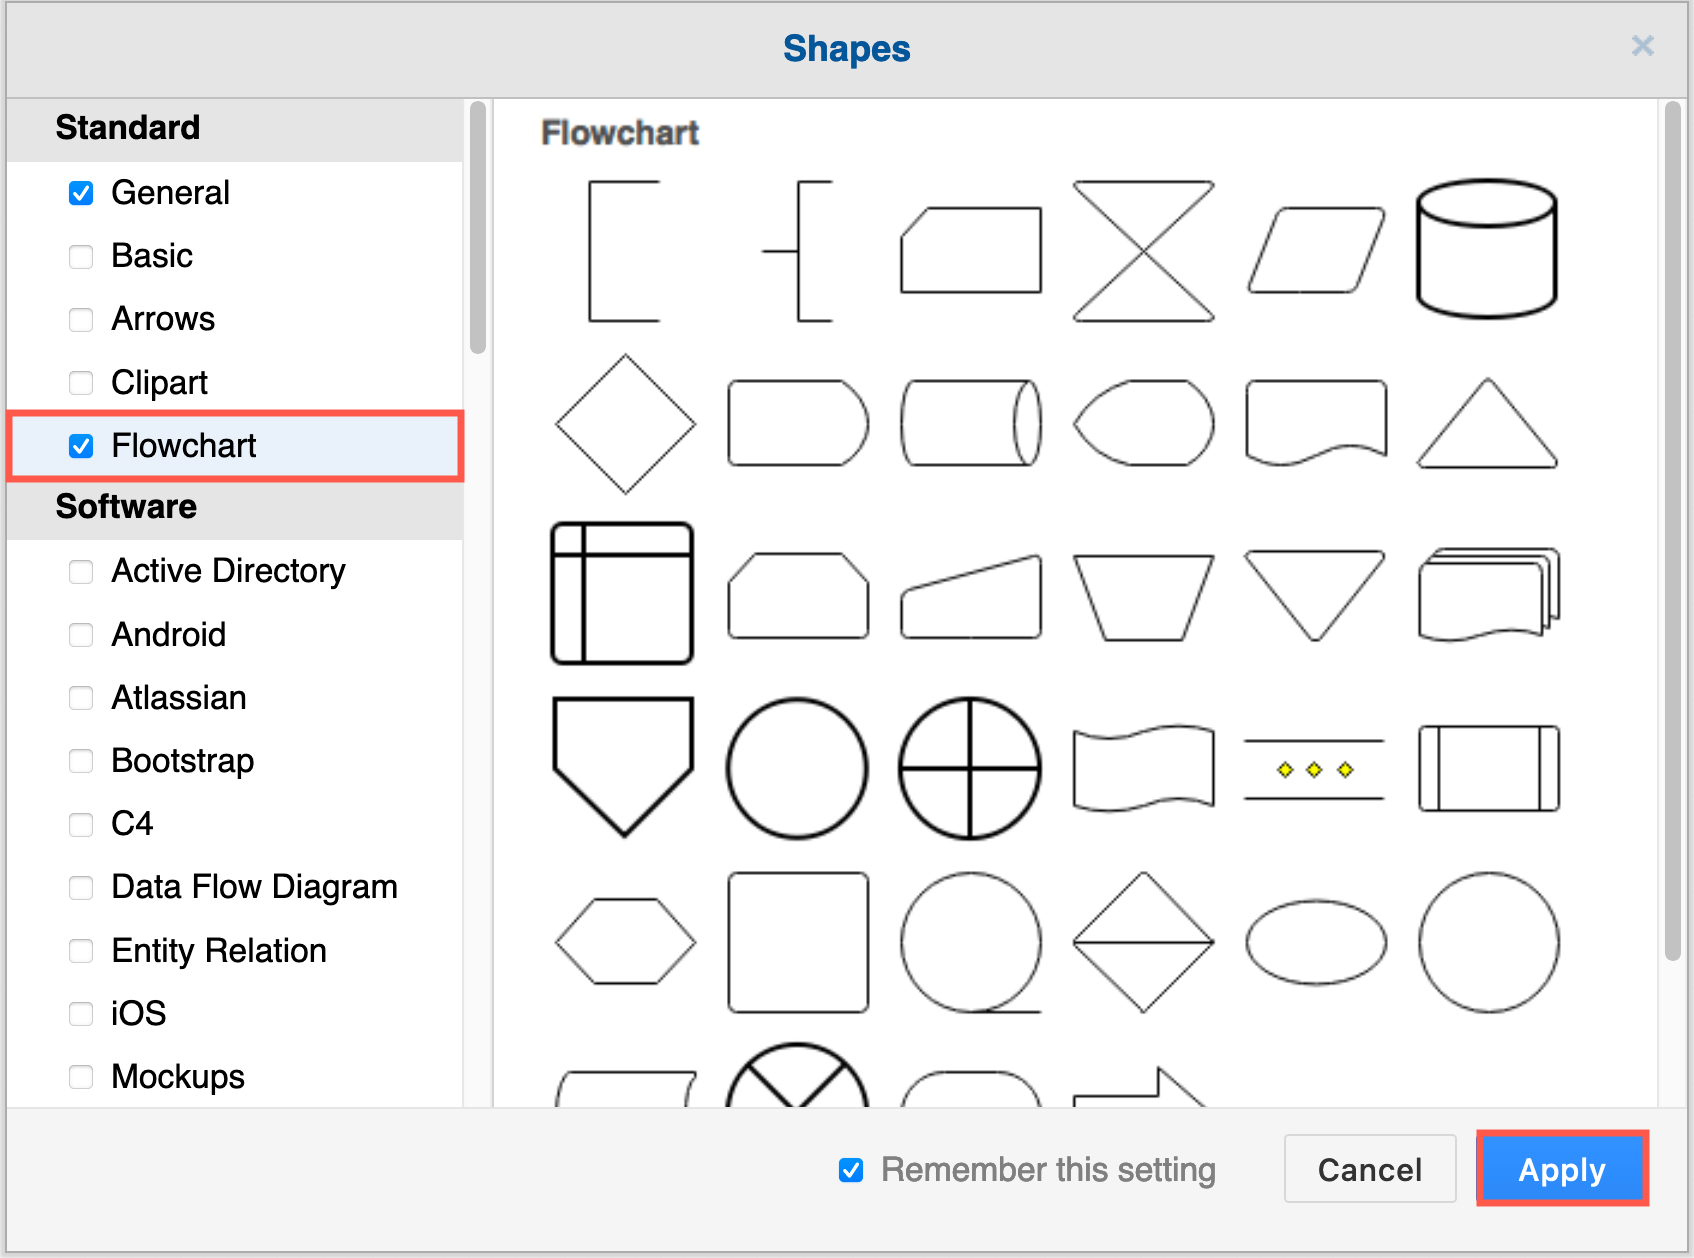
Enable the flowchart shape library
The flowchart shape library contains additional shapes used in more specialised flowcharts and decision trees.
- Click More Shapes in the left panel of the draw.io editor, enable the Flowcharts shape library, and click Apply.
For shapes that use specific flowchart notations, look in the Software, Business and Other categories of shape libraries.
New to diagramming?
Follow our step-by-step tutorial to create a simple flowchart in Confluence with draw.io. In this tutorial, you’ll work with shapes and labels, draw connectors, and style your flowchart using the format panel.
Use a draw.io flowchart template
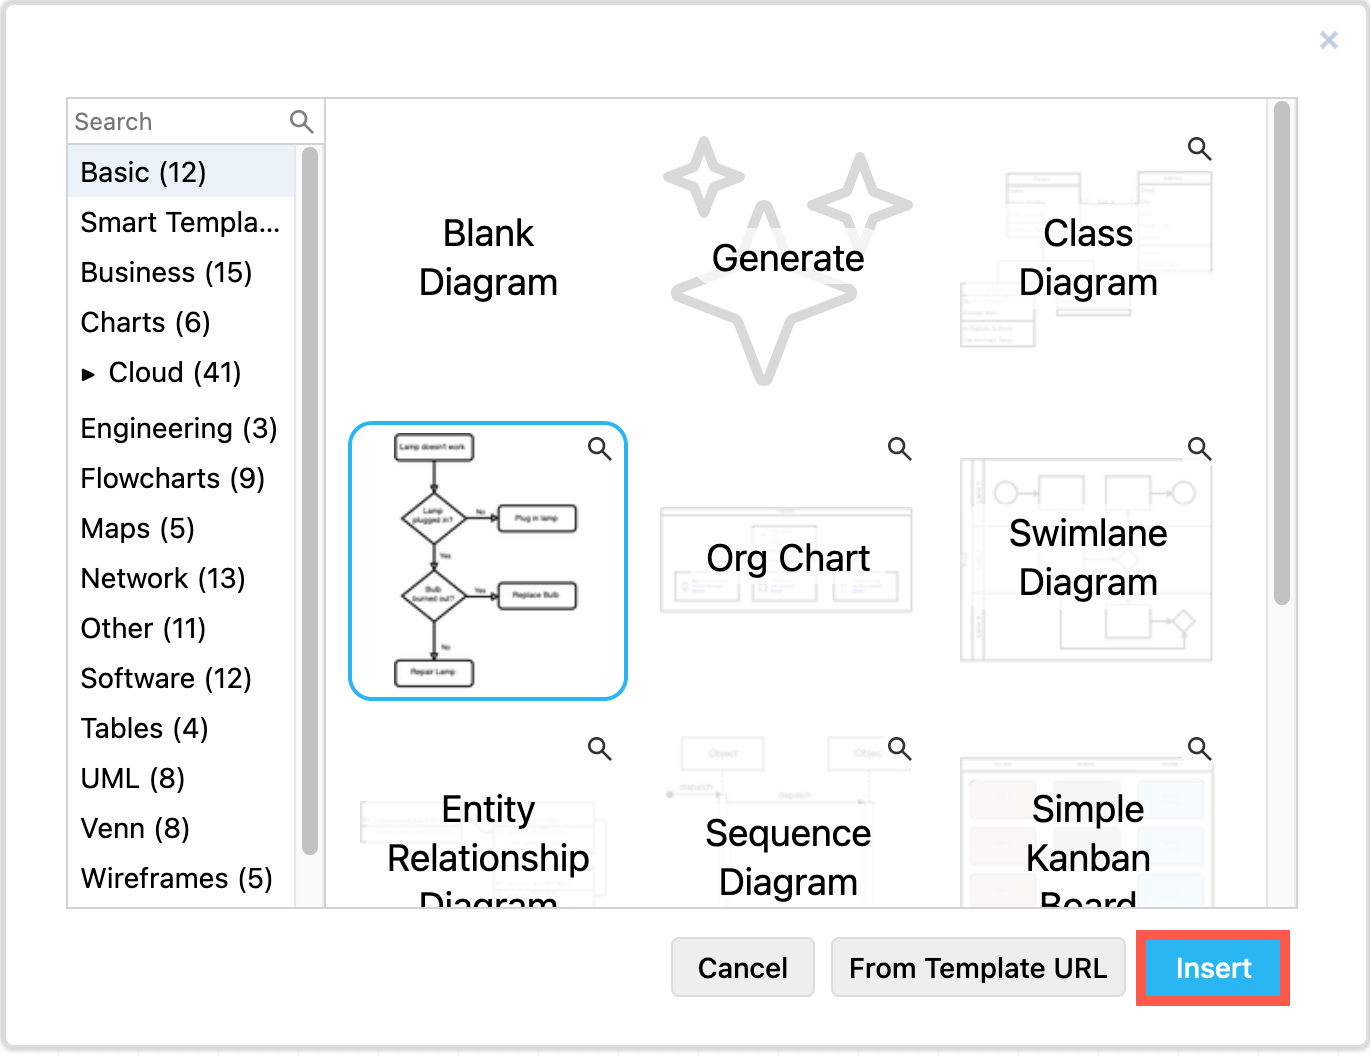
When you create a new diagram, you’ll automatically see the template library.
To add a template to an existing diagram, click Arrange > Insert > Template in the draw.io menu to open the template library. Click on a magnifying glass to see a larger preview, select a template, then click Insert.
- Basic (default): simple flowcharts of various types.
- Business: BPMN diagrams, Archimate enterprise models, and PERT chart examples, along with timelines for infographics.
- Flowcharts: more complex flowcharts using traditional shapes, as well as swimlane and data flow diagrams.
- Software: enterprise integration patterns, data flows and gitflow diagrams.
- UML: Sequence and activity diagrams using the UML notation.
Types of flowcharts for Confluence teams
Rich shape libraries and a variety of template and example flowcharts make it easy to find the right type of flowchart for your application when you use draw.io in Confluence.
Business and marketing flowcharts
Documenting decision processes and workflows in Confluence is ideal to quickly onboard new employees, examine and optimise procedures, and track changes for future audits.
If you prefer a more varied set of shapes to show the difference between types of tasks, BPMN notation is most widely used.
BPMN diagrams are formatted using swimlanes to show the different actors that are responsible for each step. These are also known as cross-functional flowcharts, and show clearly where the responsibility for tasks is passed to other teams.
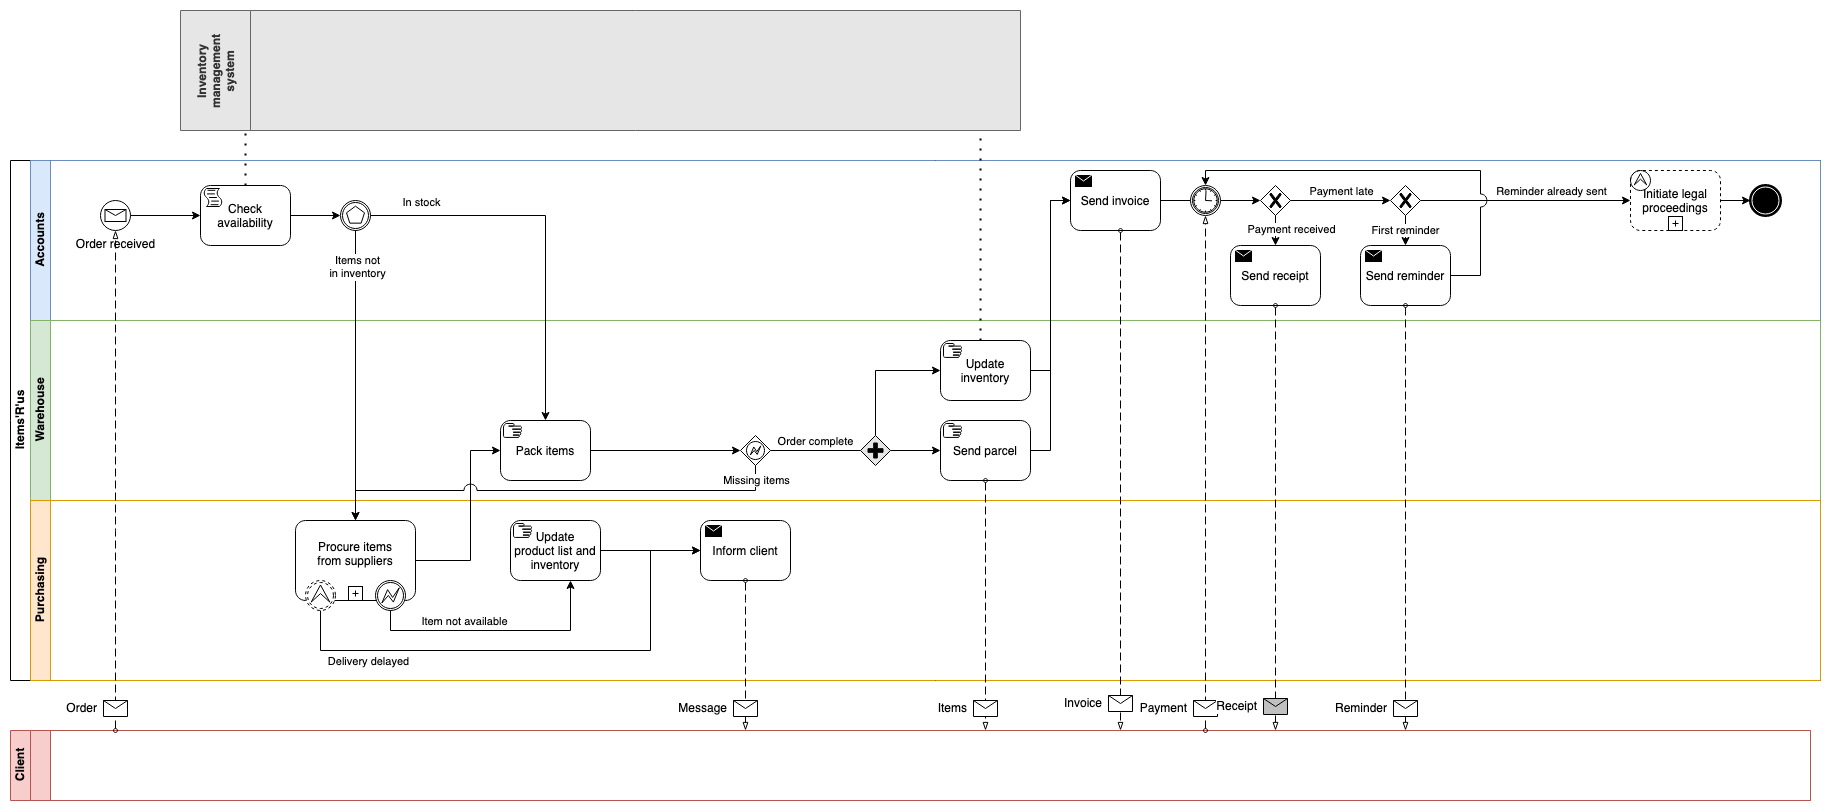
- Use a swimlane shape from the Basic shape library.
- Hold down
Ctrl(Cmdon macOS) and add a cross-functional table via the Table tool in the draw.io toolbar.
Tip: Click on More Shapes, scroll to the Business section, enable the BPMN 2.0 shape library, then click Apply.
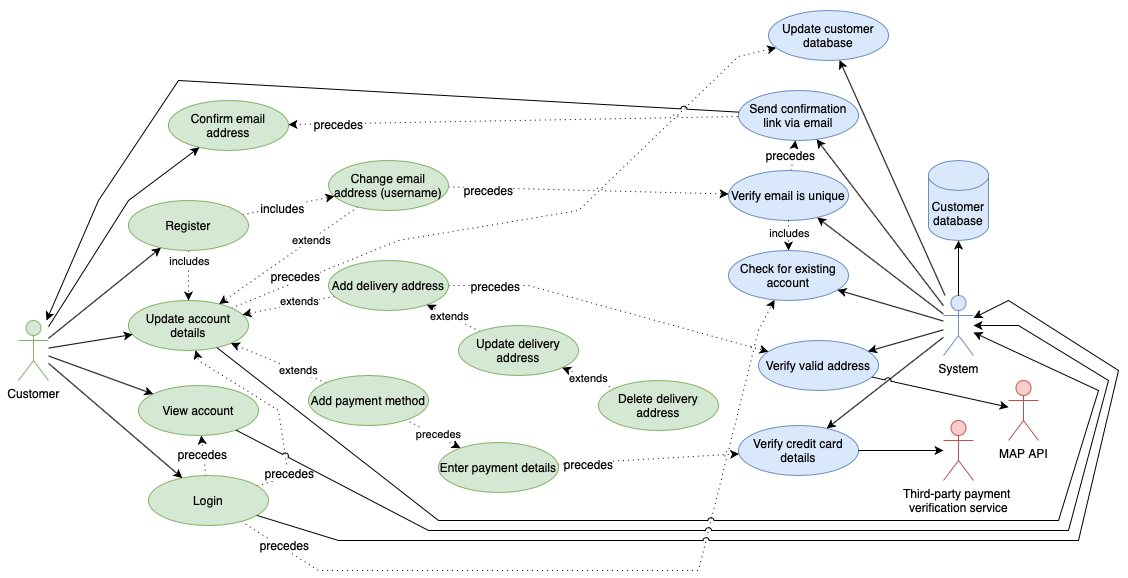
As marketing teams need to collaborate with product development and business management teams, Confluence is the best place to store customer analyses and product marketing flows. Visual documentation lets all stakeholders reach a common understanding quickly and easily.
Document customer journeys in UML use case diagrams (below) or story maps.
Software development and IT flowcharts
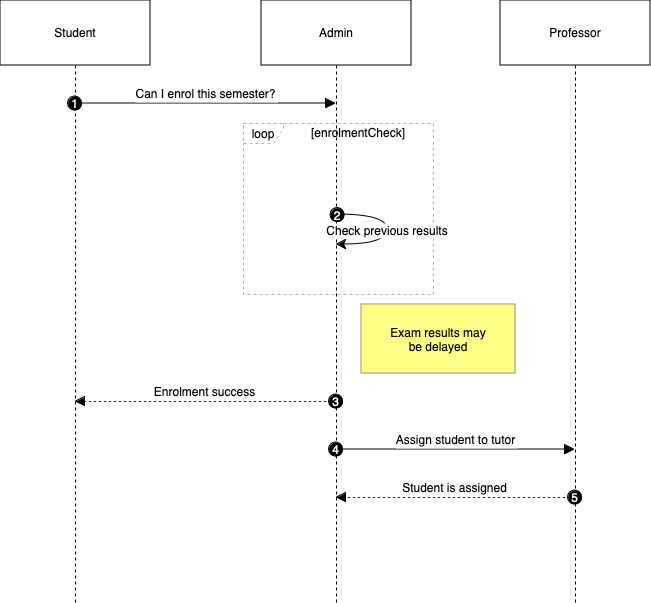
Detail data flows and control sequences for software projects in specialised UML use case, sequence and activity diagrams.
Maintaining technical documentation visually in flowcharts in Confluence is especially important when multiple teams are responsible for different features in the one software product or in a suite of related products.
Tip: Generate flowcharts and UML flow diagrams automatically using the Mermaid syntax.
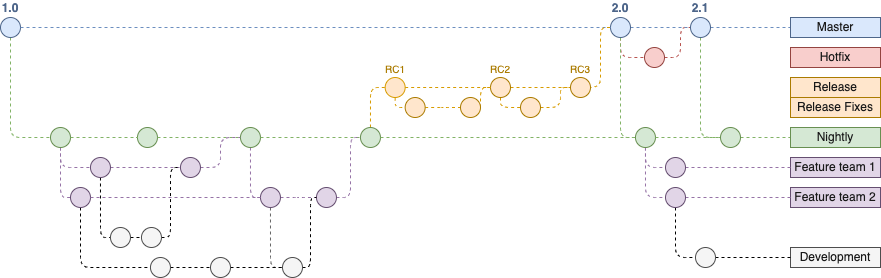
Visualise your version control system with development and release flows in gitflow diagrams using simple shapes and connectors.
Explore infrastructure risks with application threat models, including data flow diagrams and process flow diagrams.
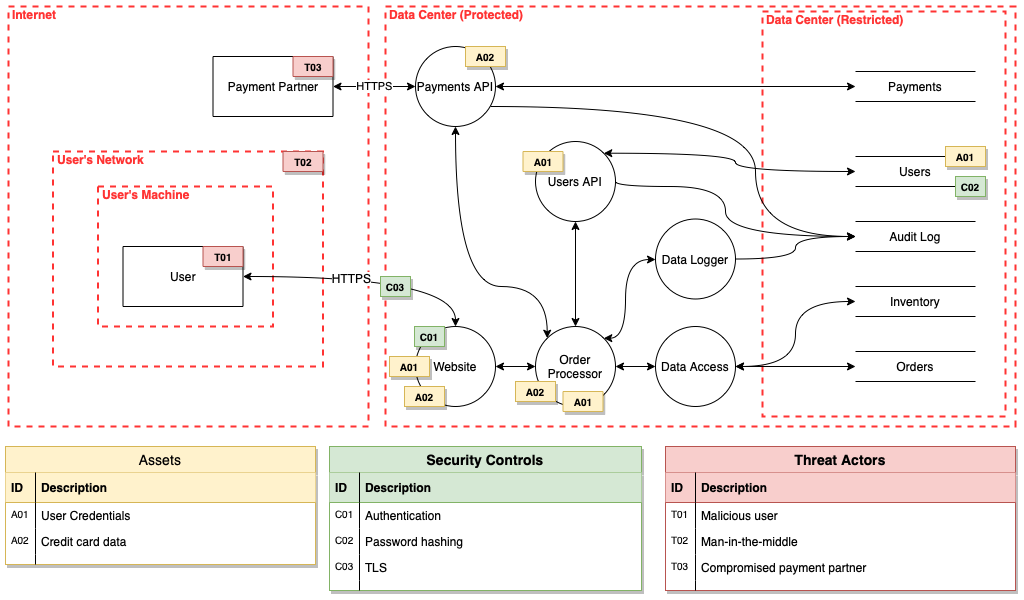
- Click on More Shapes in the left panel in the draw.io editor, scroll down to the Other section and enable the Threat Modeling shape library.
Flowcharts for industry
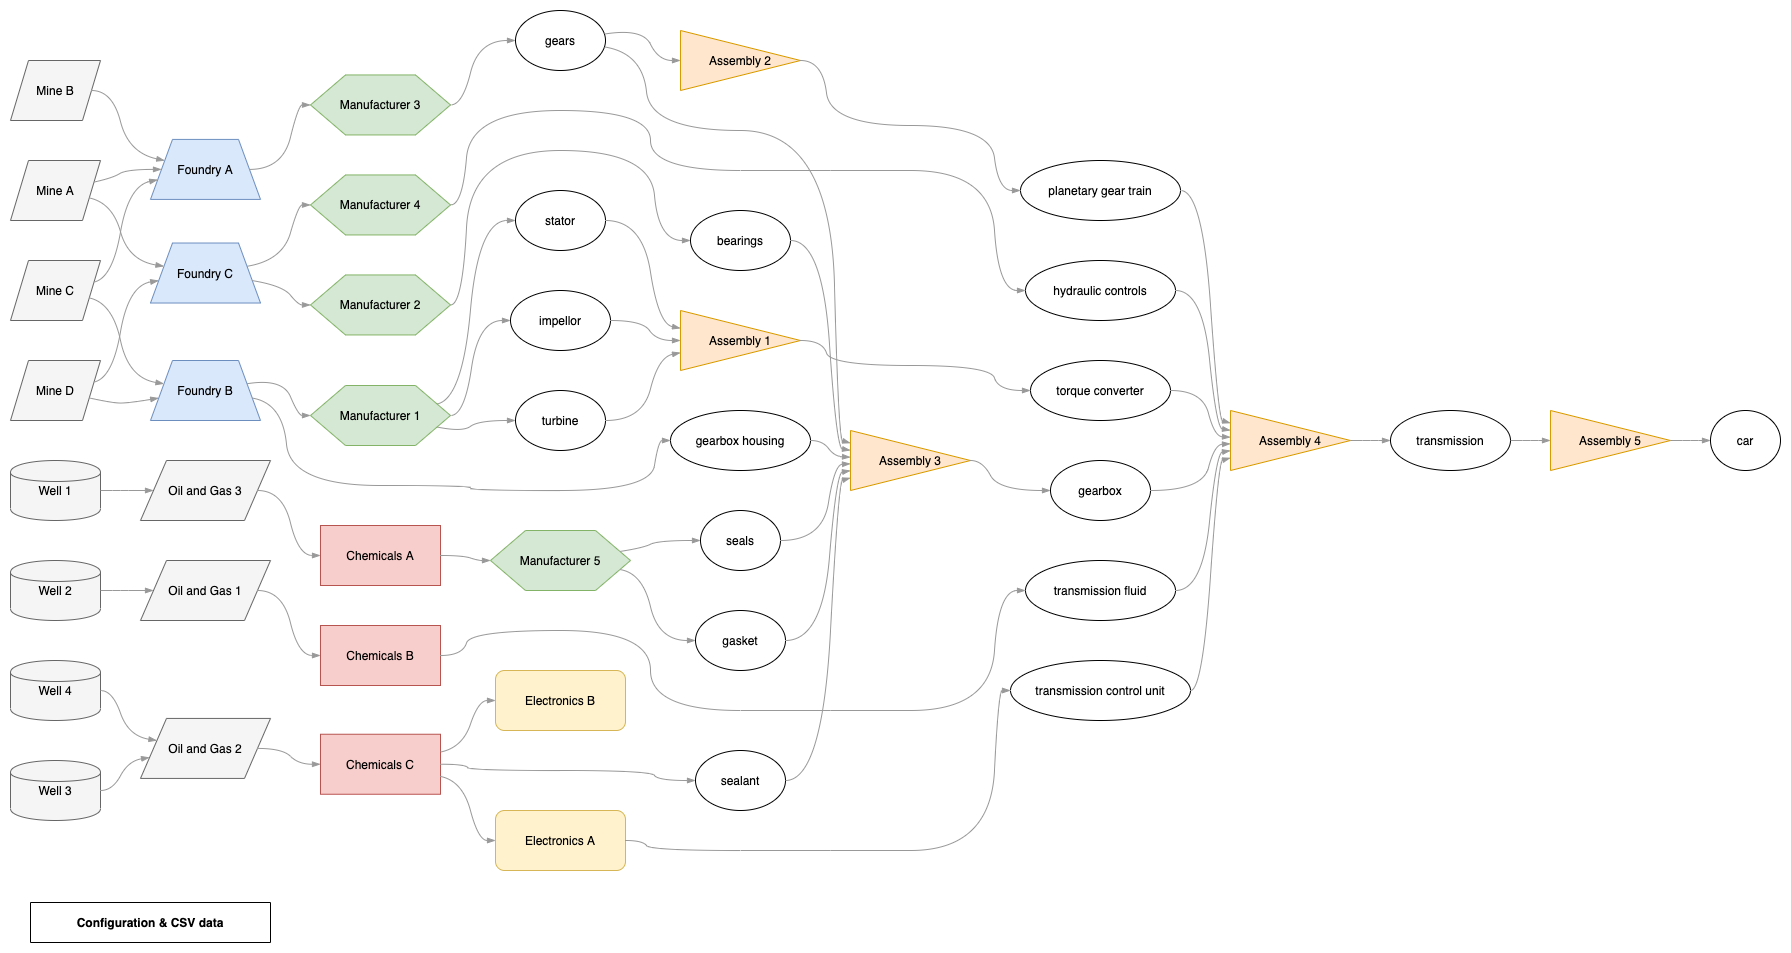
Examine and optimise supply chains and production processes in detailed flowcharts in Confluence.
If you have documented your supply chain or production steps in a spreadsheet, combine the exported CSV data with formatting information to draw your supply chain flowchart automatically. Store the resulting diagram in Confluence. Generate a new flowchart whenever you make changes to analyse and optimise the flow.
Do more with flowcharts in Confluence
With draw.io, you can make it even easier for your teams to create and collaborate on flowcharts in their Confluence instances.
- Use the simpler draw.io board macro to quickly brainstorm new processes and flowcharts in Confluence.
- Migrate all existing flowcharts in Confluence in one step from Gliffy to draw.io with draw.io’s mass import features.
- Create your own custom flowchart templates in Confluence Cloud.
- Customise draw.io in Confluence to use your corporate colours by default.
- Provide a custom shape library to allow teams to flow chart using custom shapes or flowchart segments in Confluence Cloud.