Diagrams in technical documents
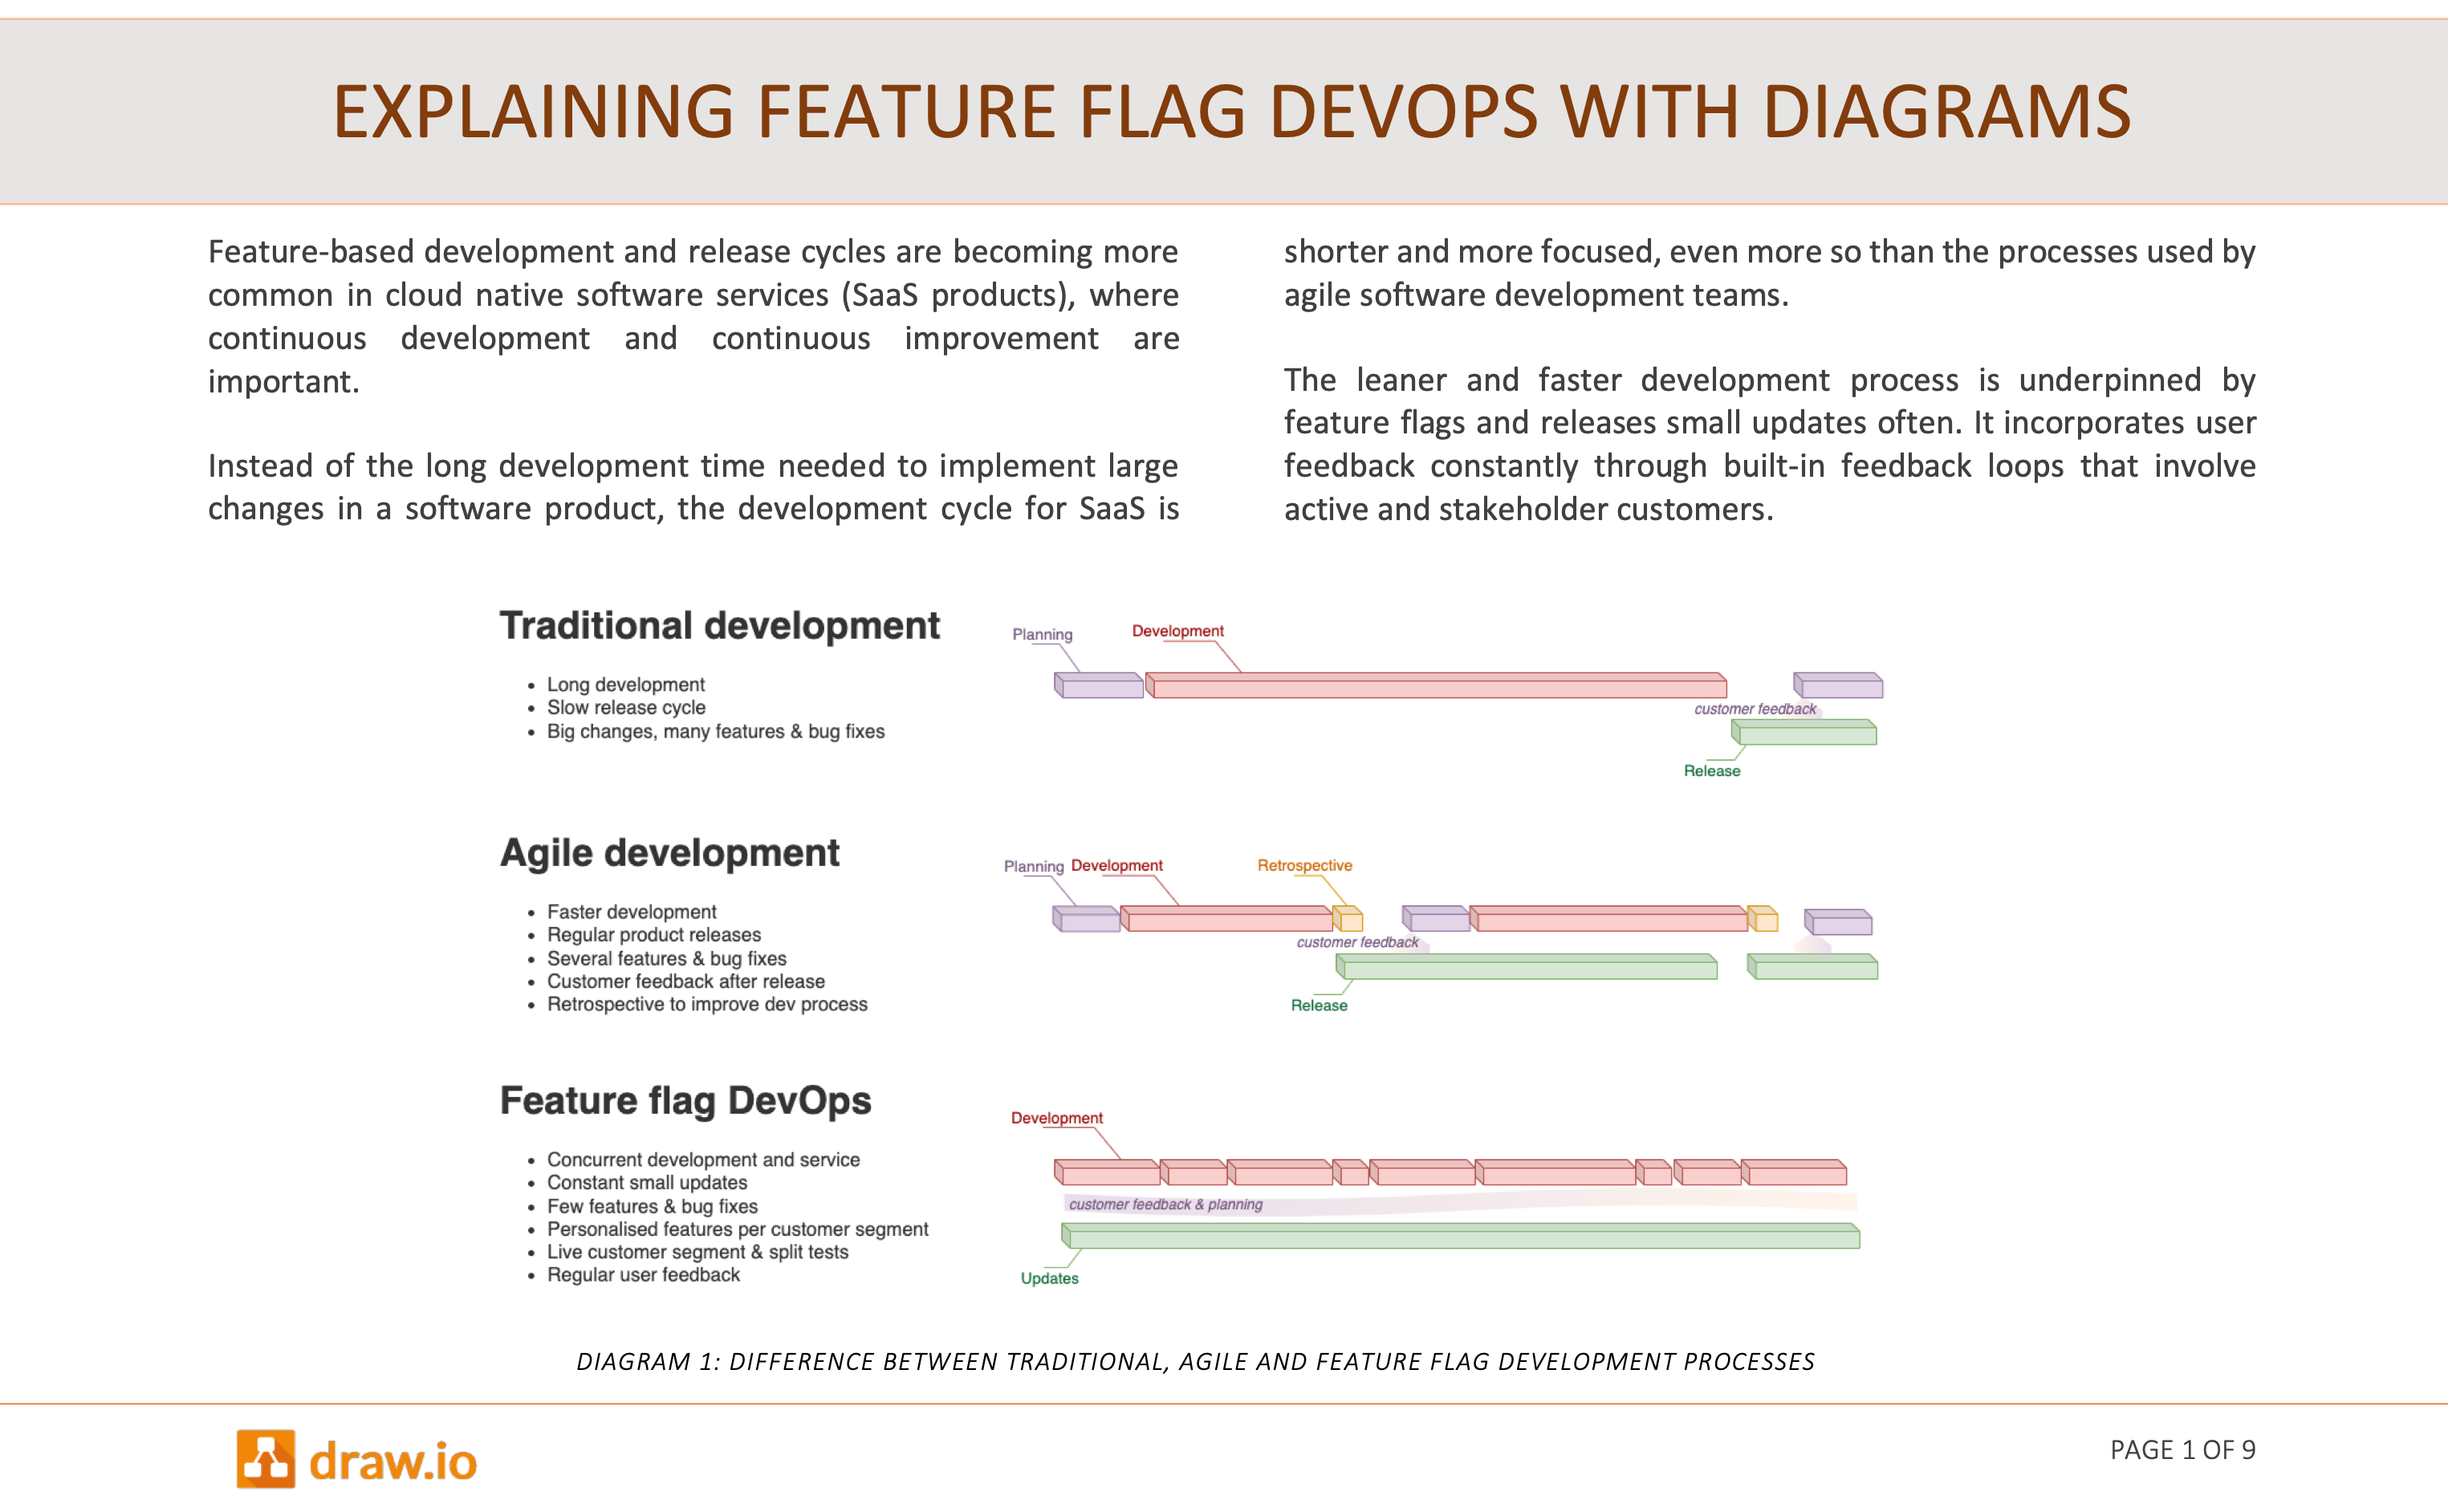
Technical diagrams are a form of documentation by themselves. But they are also used to supplement text in many other types of documents created by technical writers and documentation teams. While some teams may have graphics designers responsible for the diagramming, tech writers may be less familiar.
We’ve previously looked at how various professions need to draw specific technical diagrams, but docs teams are often required to write and diagram across many different fields.
As a useful overview for such docs teams, what types of technical documents commonly include technical diagrams?
All technical diagrams on this page were created in draw.io.
User documentation
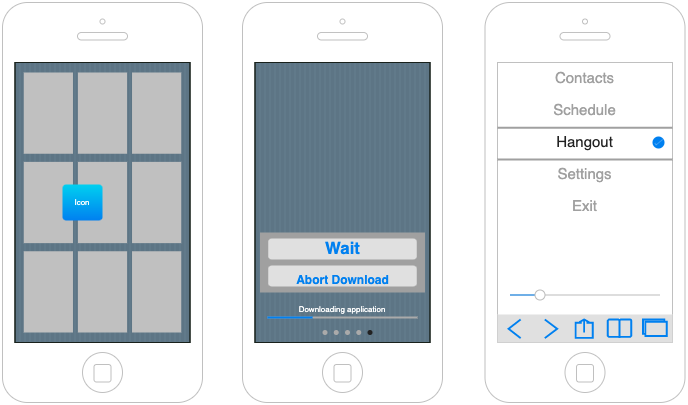
User documentation includes usage instructions for a software application or app, or for a physical product. The most common diagrams found in these documents are flowcharts, labelled mock-ups or photos and explanatory infographics.
- Installation guides and software user manuals - flowcharts, labelled interface mock-ups
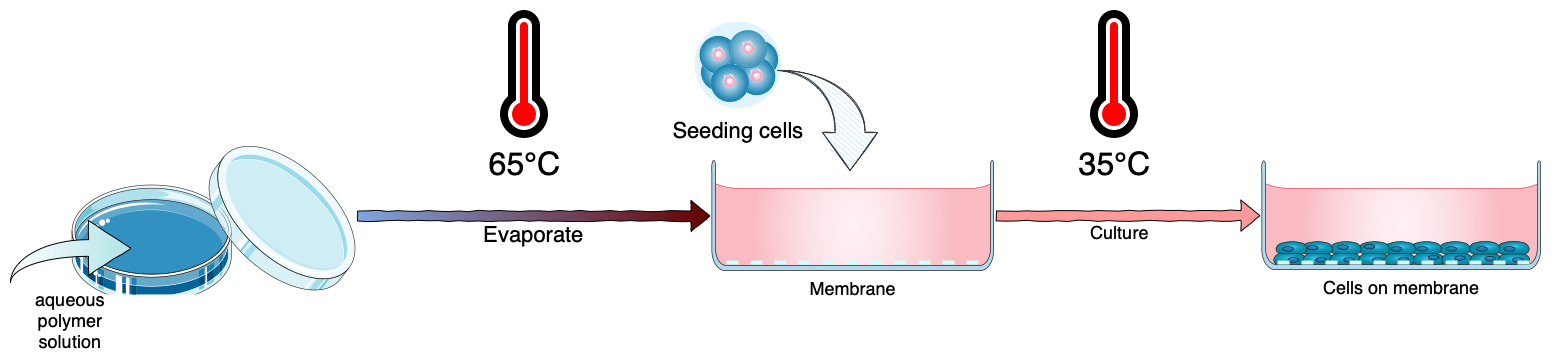
- Product manuals - labelled diagrams and photos, flowcharts, infographics
- User safety information - flowcharts, safety hazard infographics
- Troubleshooting - tables, flowcharts
Use internationally recognised icons to indicate product safety, use, care or disposal procedures so there is less to translate into other languages when your product is to be sold internationally.
If your user documentation is available digitally, add links to shapes in your diagram so users can navigate directly to the information they require. This is particularly useful for troubleshooting instructions.
Product development documents
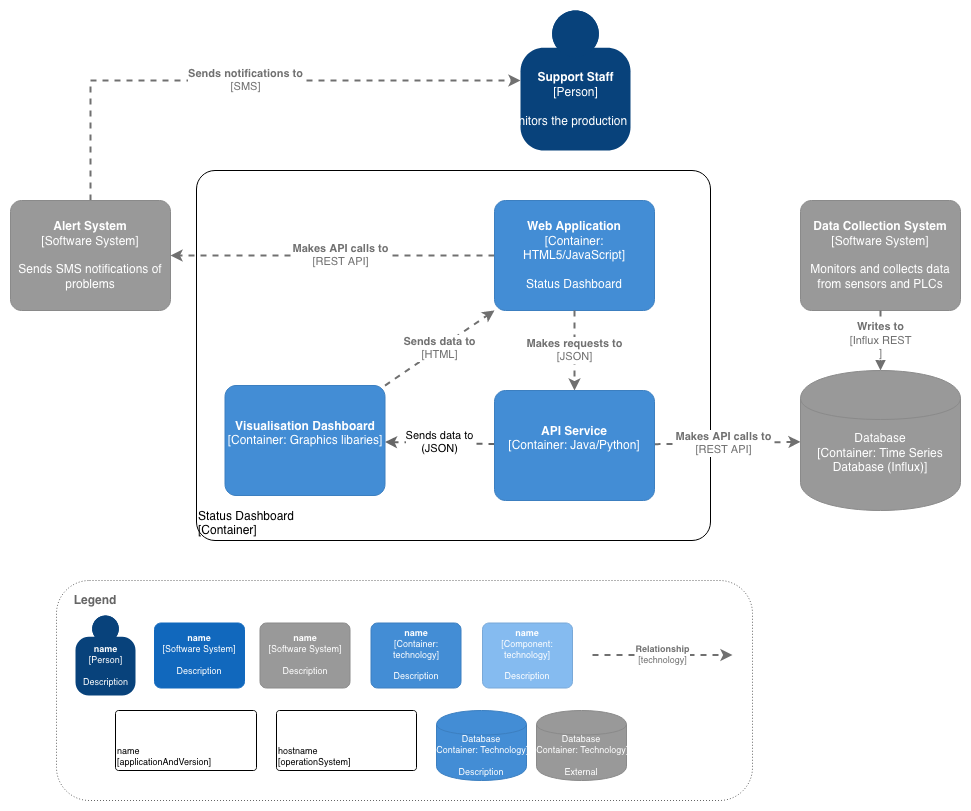
- API and SDK documentation - data flow diagrams, UML diagrams, C4 models, dependency diagrams
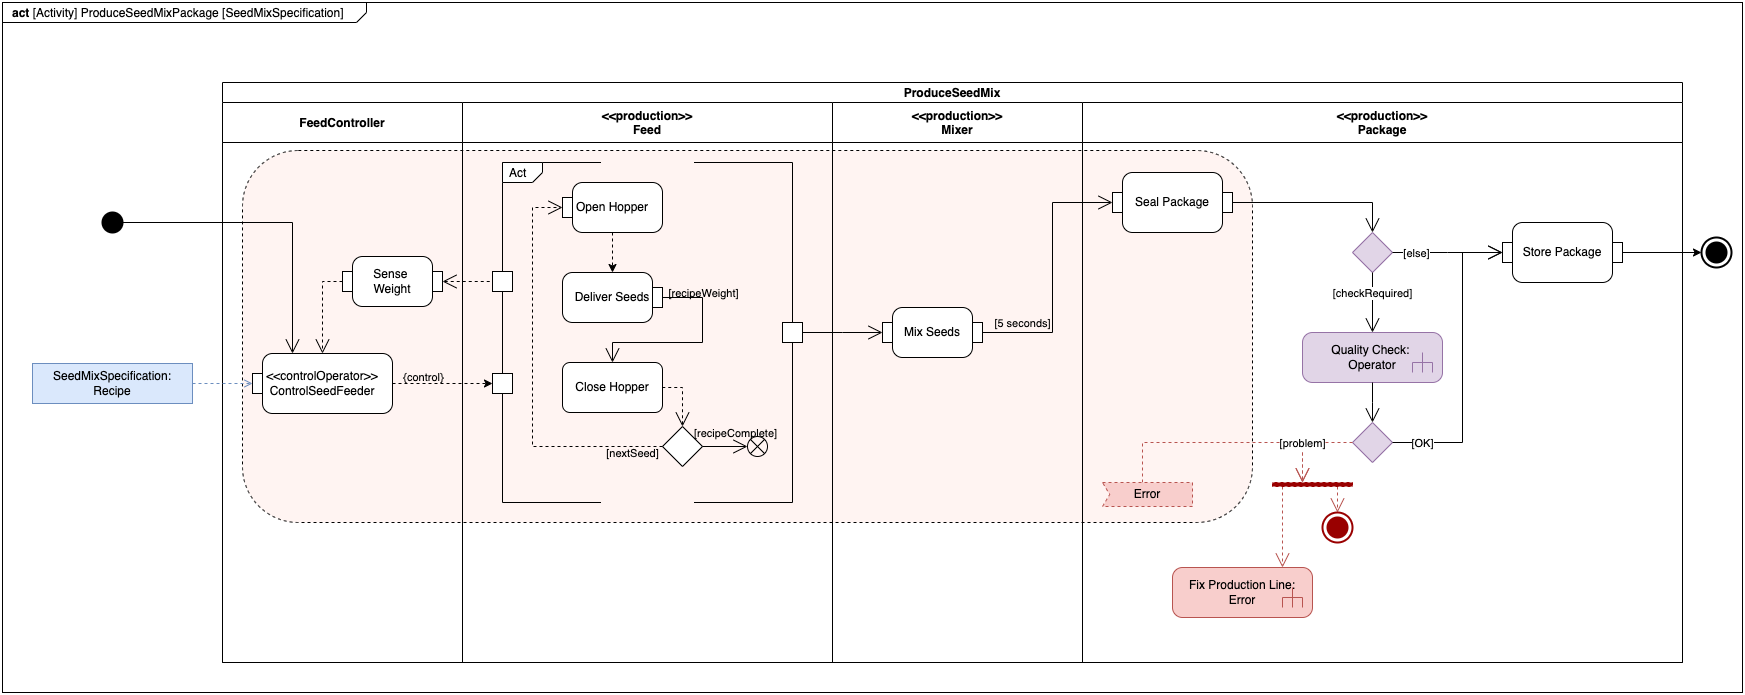
- Technical specifications - UML and SysML diagrams, mock-ups, entity relationship diagrams, user flows, PERT charts and dependency graphs, timing diagrams
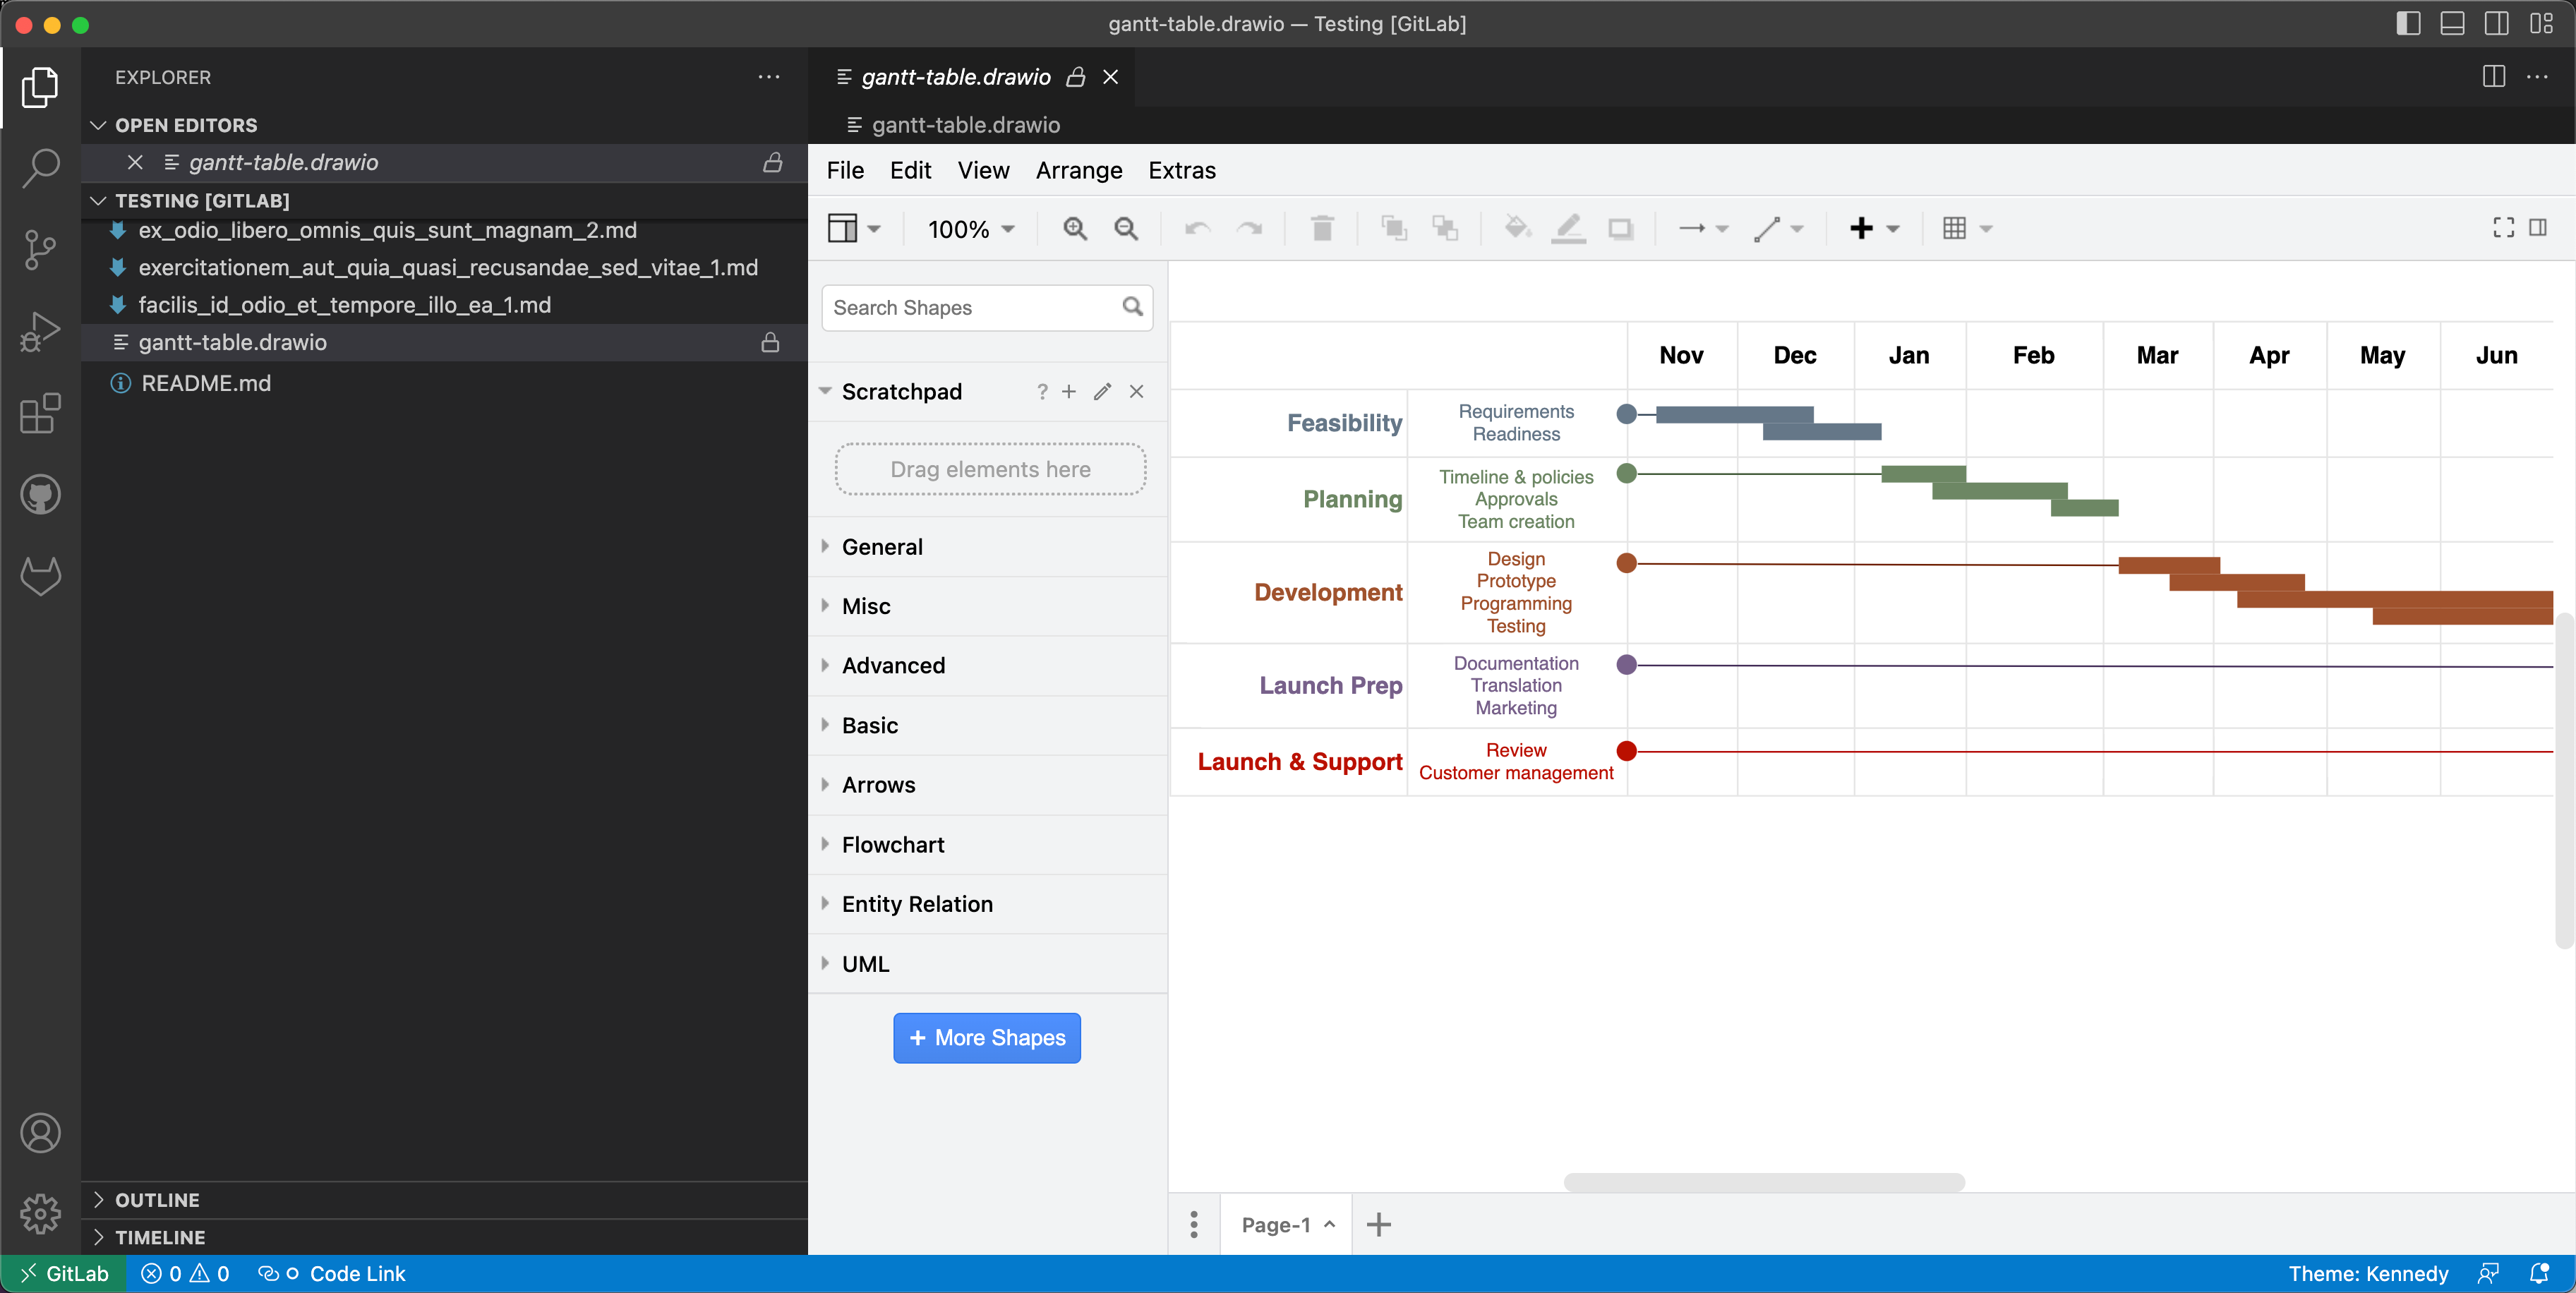
- Project management documentation - concept maps, timelines and roadmaps, Gantt charts, Kanban boards, gitflows
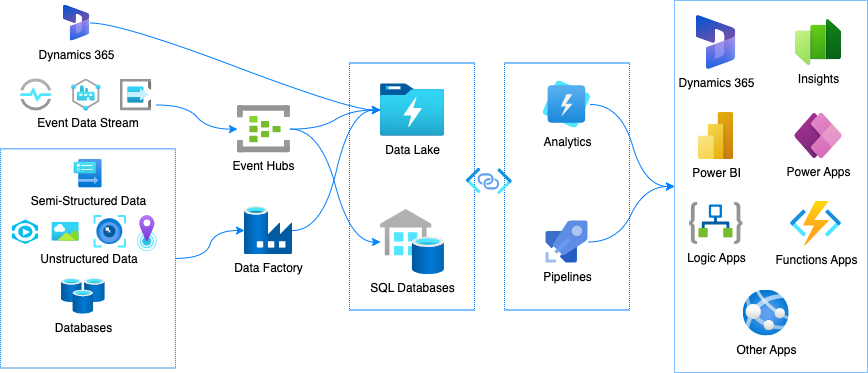
- System architectures - network and infrastructure diagrams, rack diagrams
- Technical design - CAD drawings, cut-section materials diagrams, mock-ups, wireframes
As an online whiteboard tool, use draw.io in distributed team project meetings, with real-time collaborative editing in Confluence Cloud, Google Drive and One Drive. You can still use all of draw.io’s technical diagramming features in those quick whiteboard diagrams - with rich shape libraries, style customisation, and precision shape editing tools - as well as work quickly with useful templates.
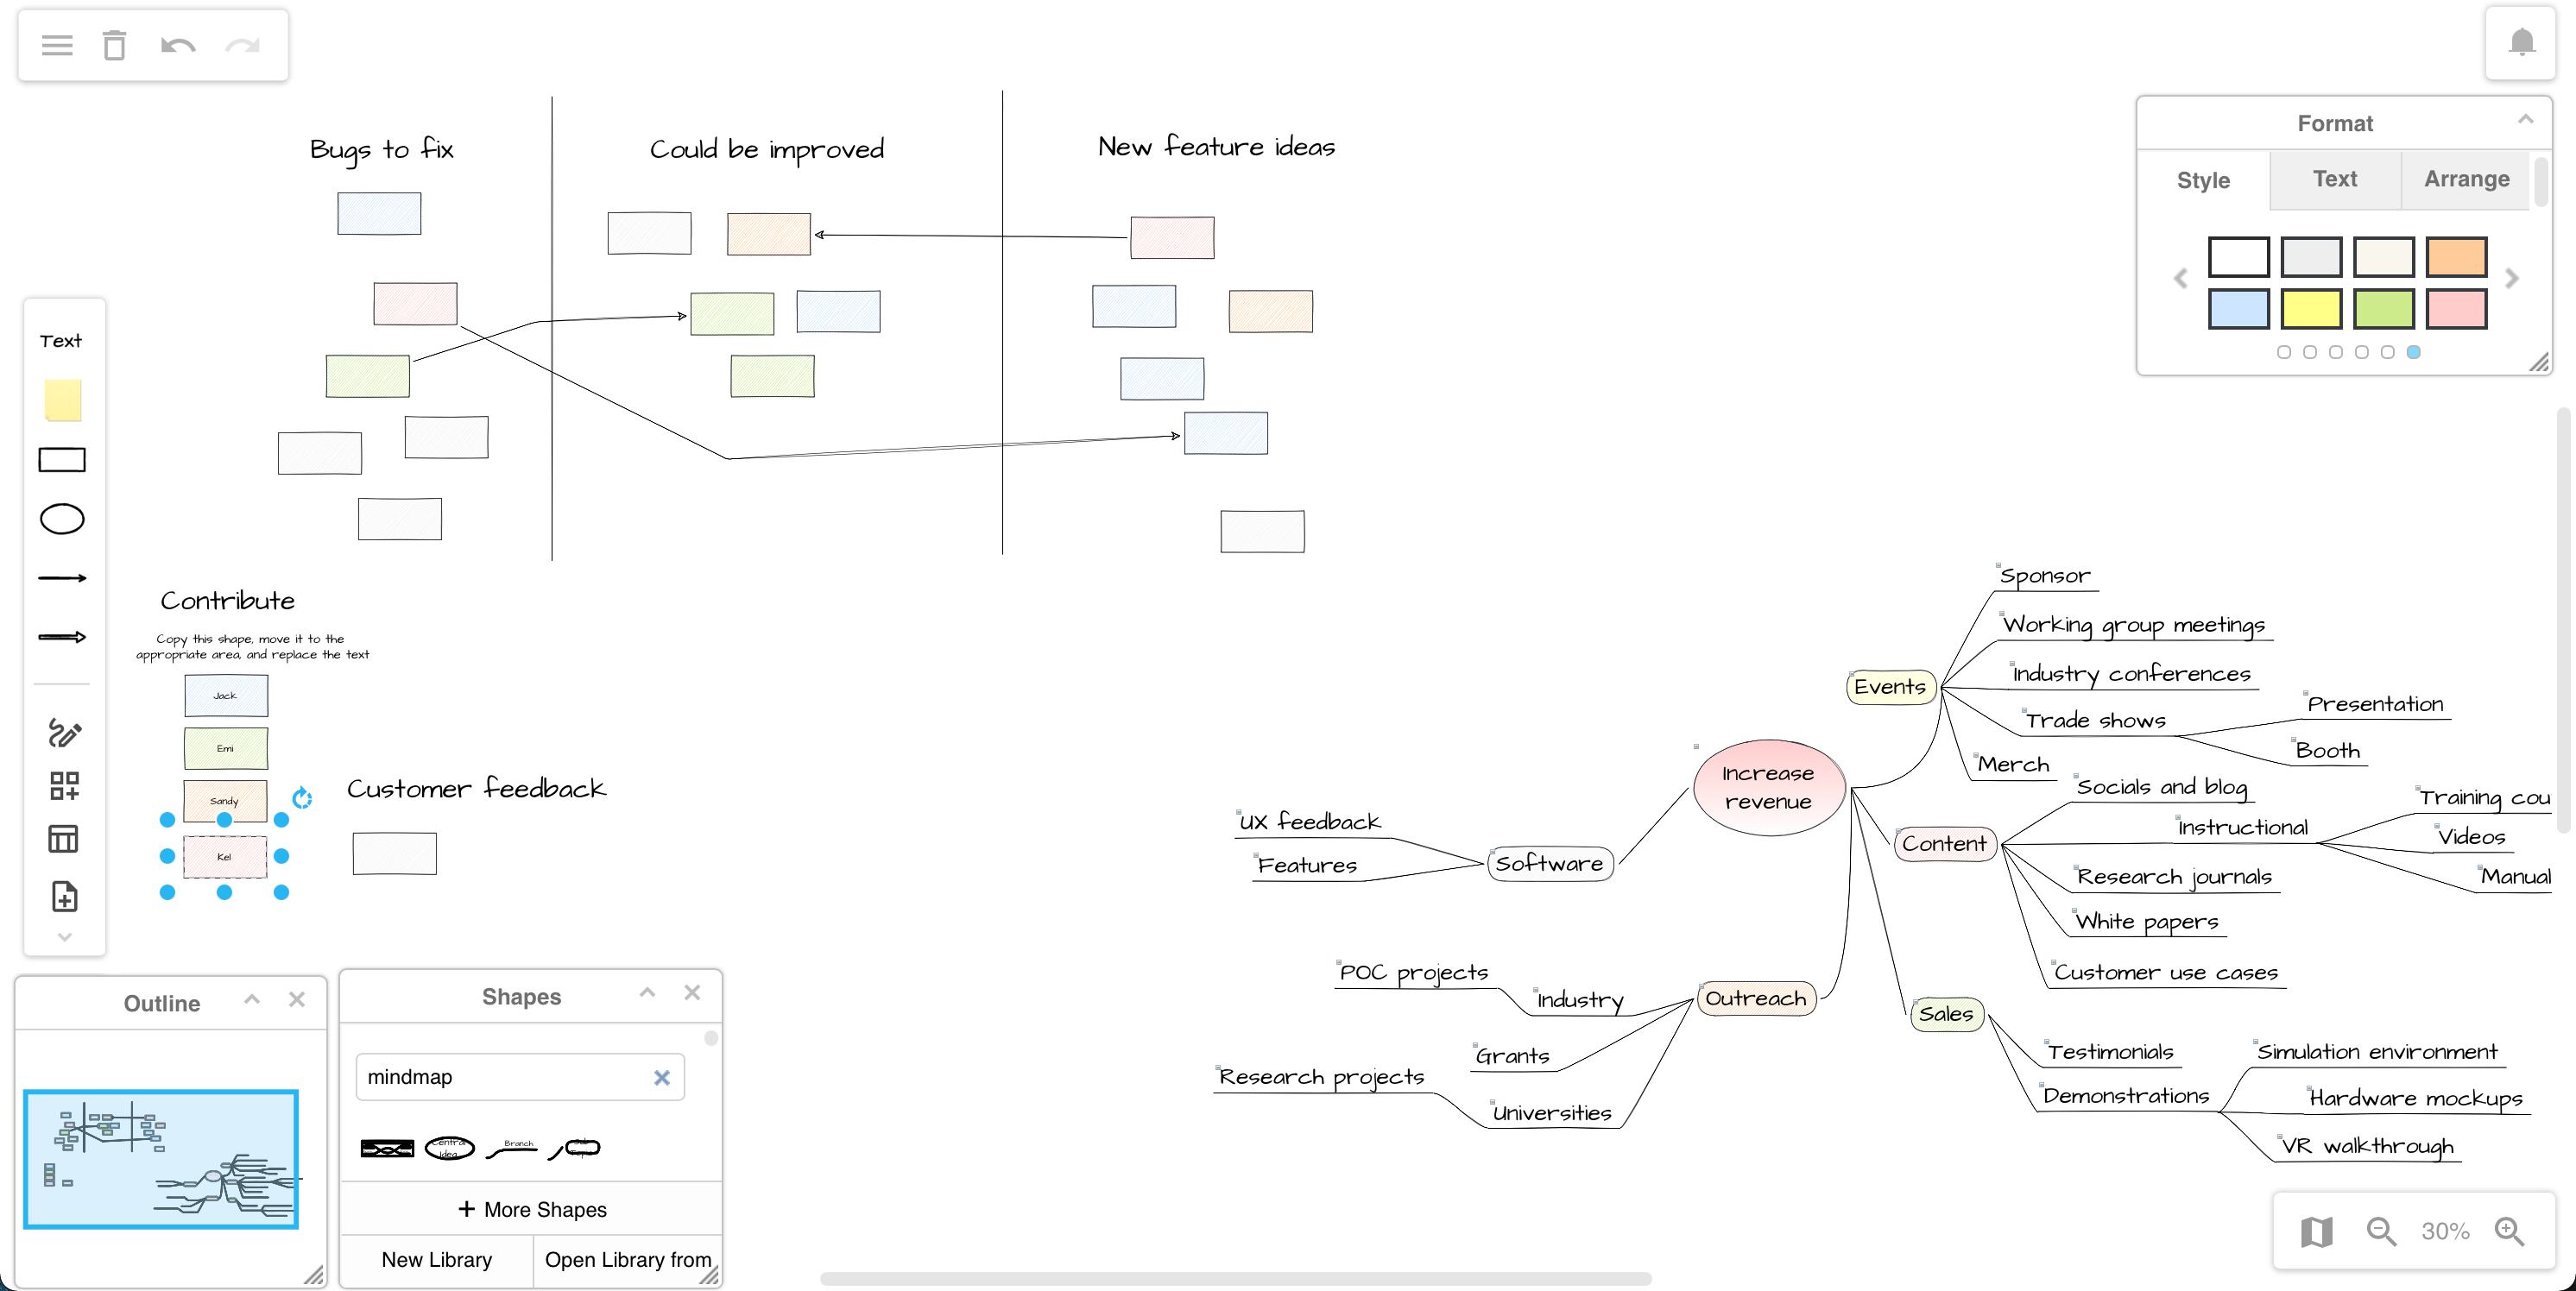
Diagram wherever you manage your project docs
If you use VS Code for your project documentation, you can install Henning Dieterichs’ unofficial draw.io extension to view and edit diagrams stored in GitHub alongside your code and markdown documentation.
GitLab integrated draw.io in the GitLab wiki editor in release 15.10.
The draw.io app for Jira also lets you attach diagrams directly to issues and service desk tickets, or embed a diagram file stored in Confluence, Google Drive or One Drive.
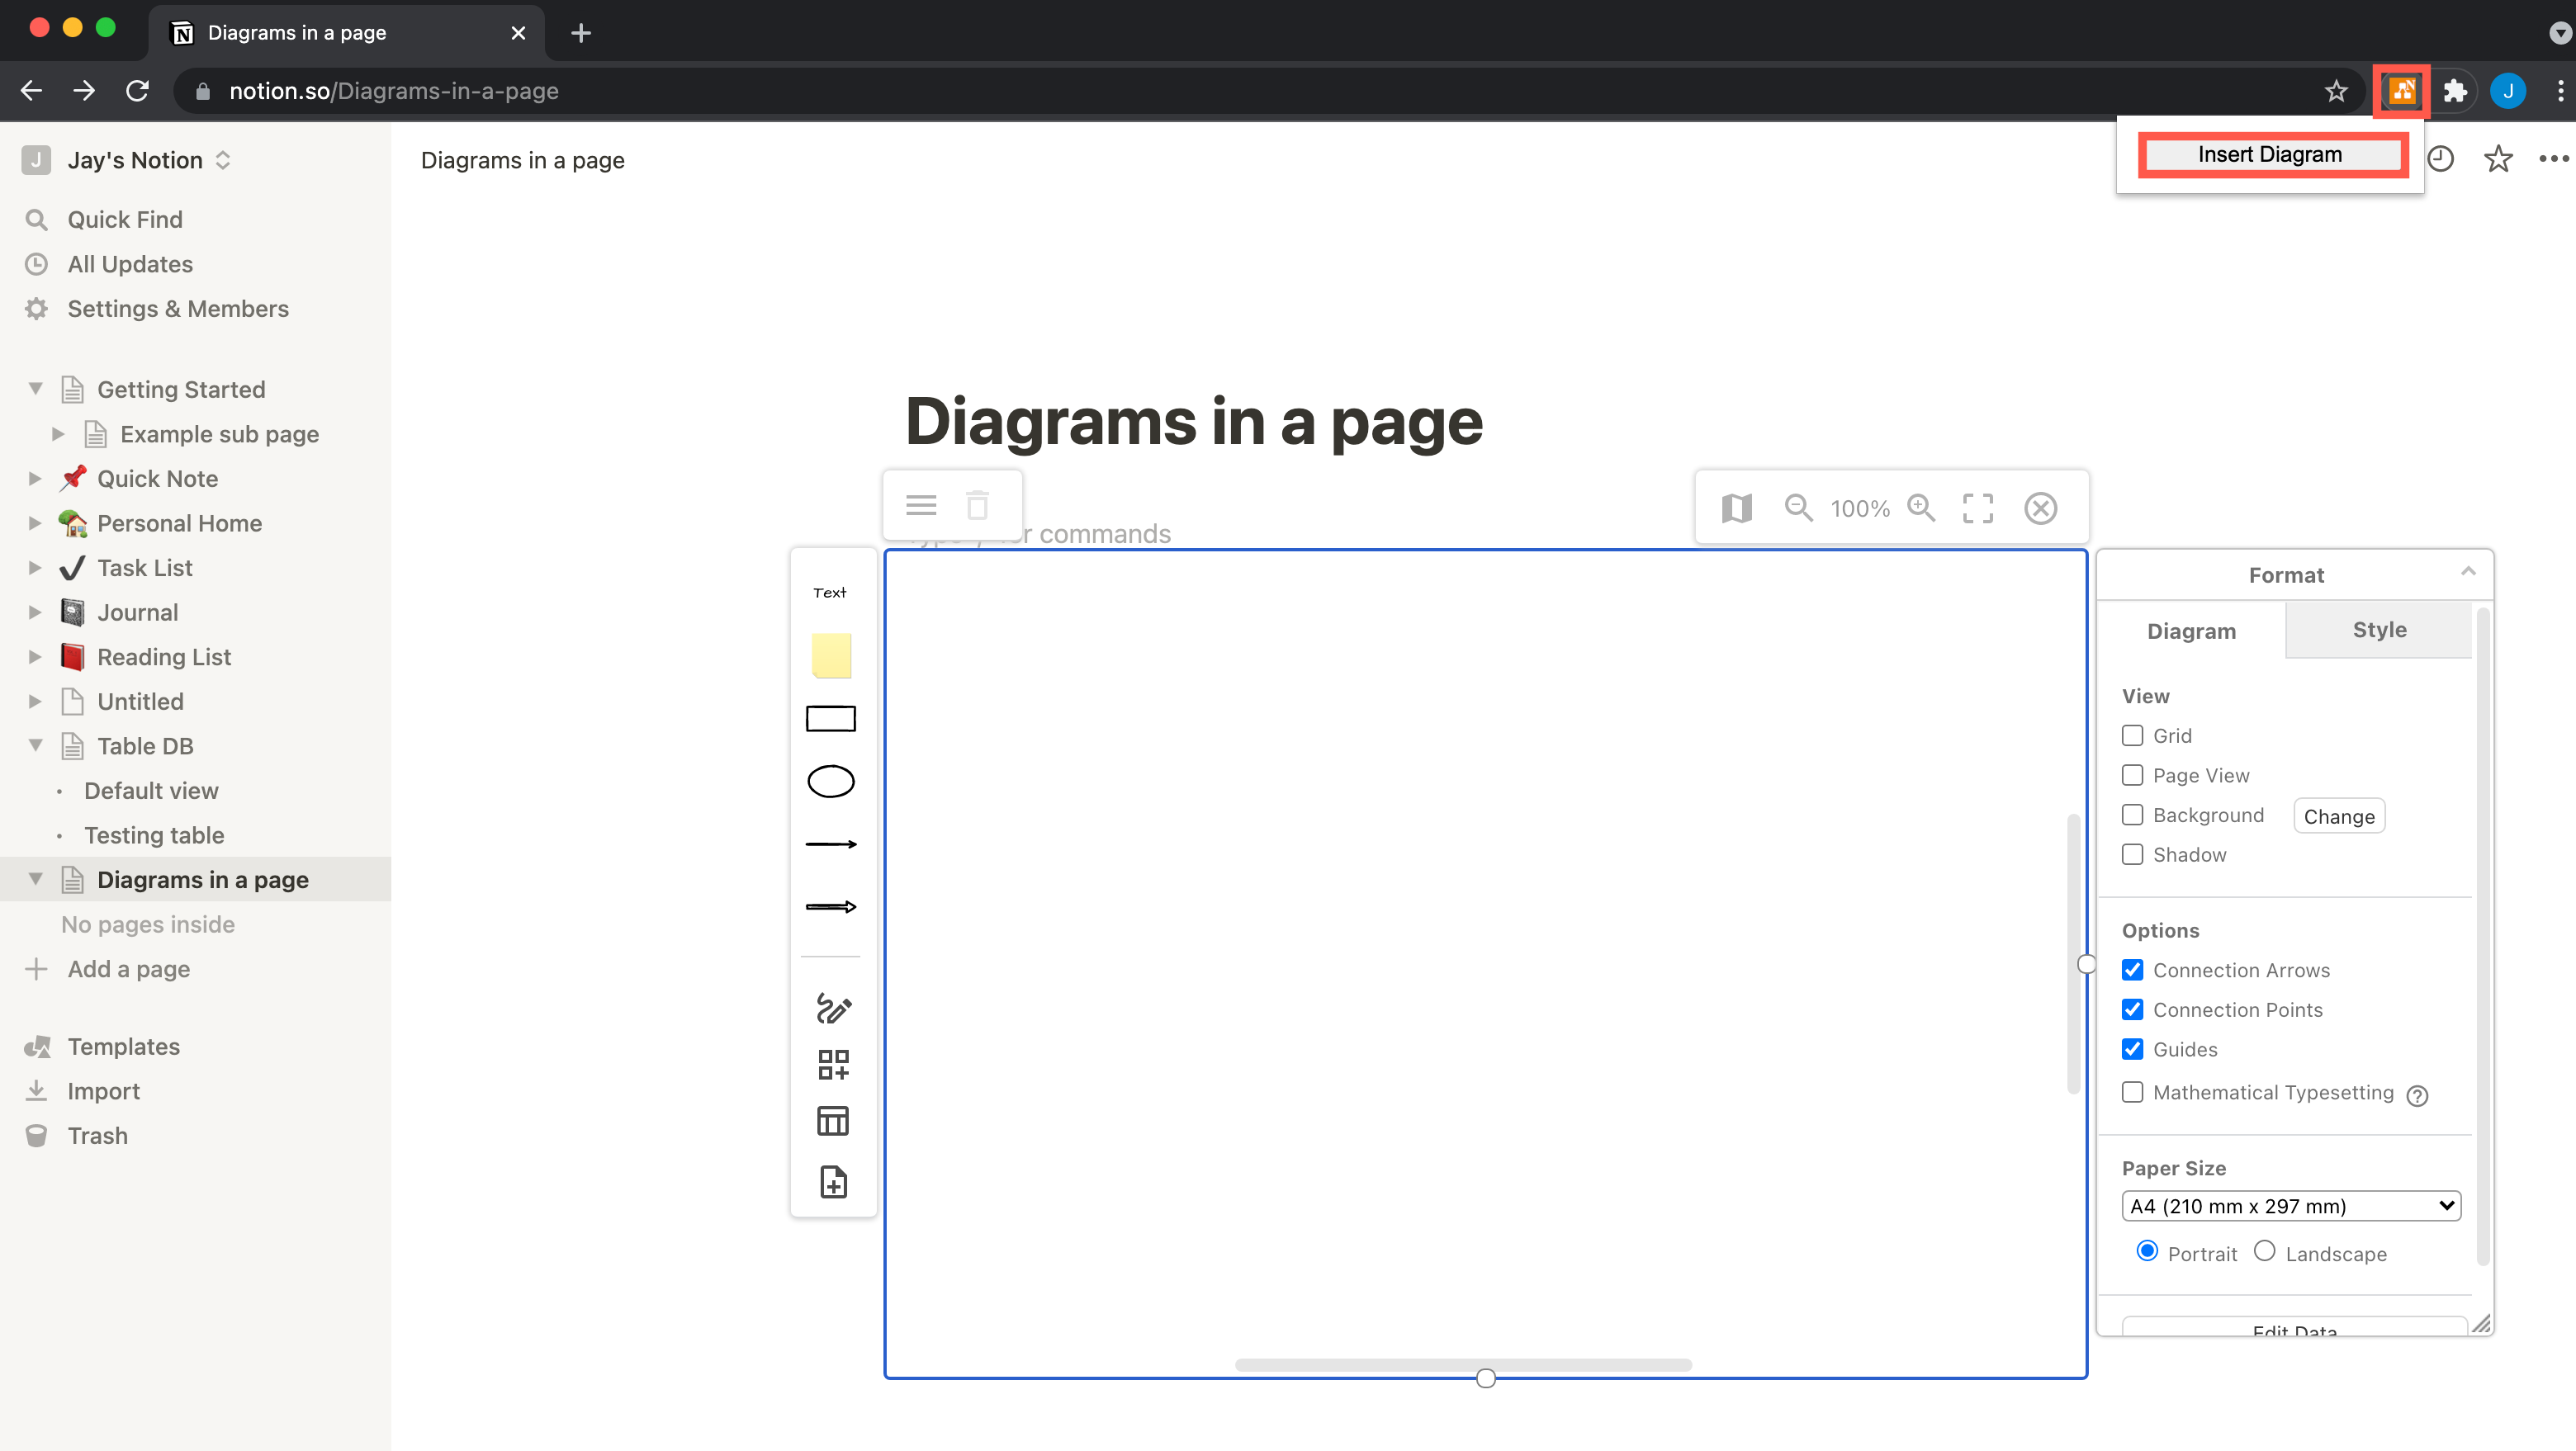
If you use Notion, add the draw.io Chrome extension to store your diagrams in your Notion pages.
Manufacturing documentation
- Supply chain documentation - approval flows, supply flows, safety network visualisations
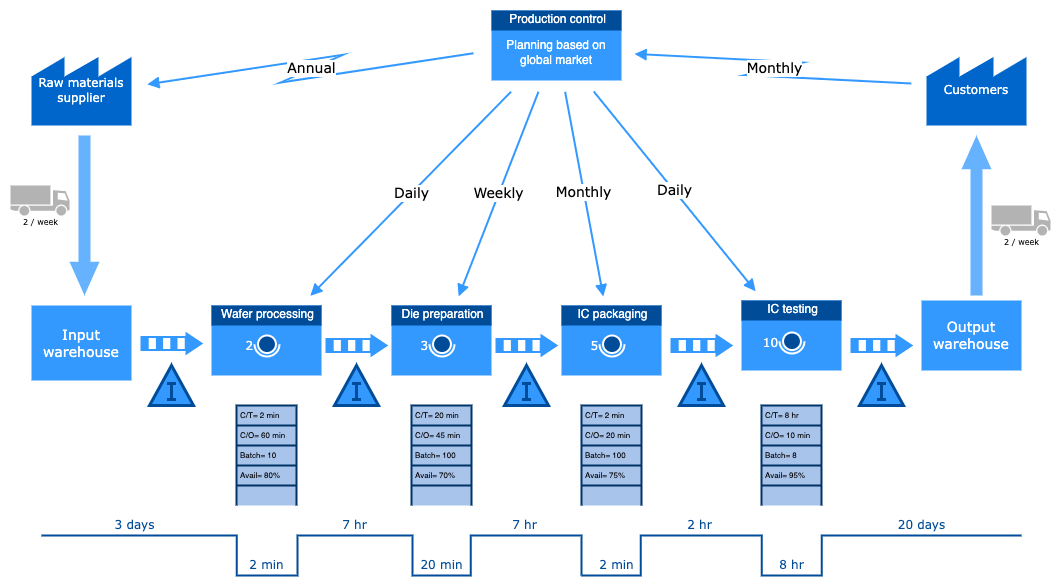
- Manufacturing documentation - machine drawings, event-driven process chains, electrical and control circuits, production maps, value stream maps, Ishikawa diagrams, manufacturing models, timing diagrams, block diagrams
- Visual aids - dashboards, infographics, labelled diagrams and photos, site maps and floor plans
Quality, safety and legal documentation
- Equipment service manuals - fault trees, labelled diagrams, troubleshooting flows, parts diagrams
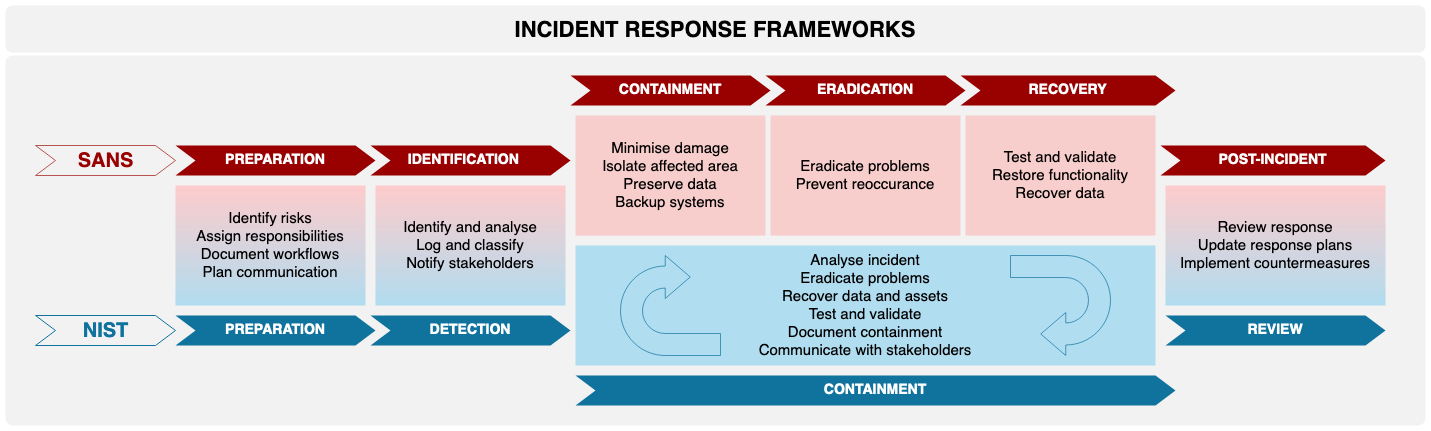
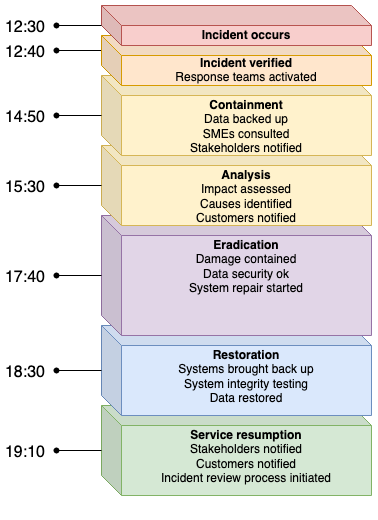
- Risk documentation - threat models, system models, FRAM models, ecological interfaces, decision trees, timing diagrams, incidence response timelines, probability trees and risk overviews
While not exactly documentation, data-driven dashboards displayed on monitors to keep track of production measurements in a manufacturing process often start out as a diagram. A visualisation of the factory floor or machine is easier for operators to understand at a glance instead of tables of text or rows of status lights. In small companies, the graphics designer/documentation expert may be the one to create the initial dashboard layouts.
Technical business documents
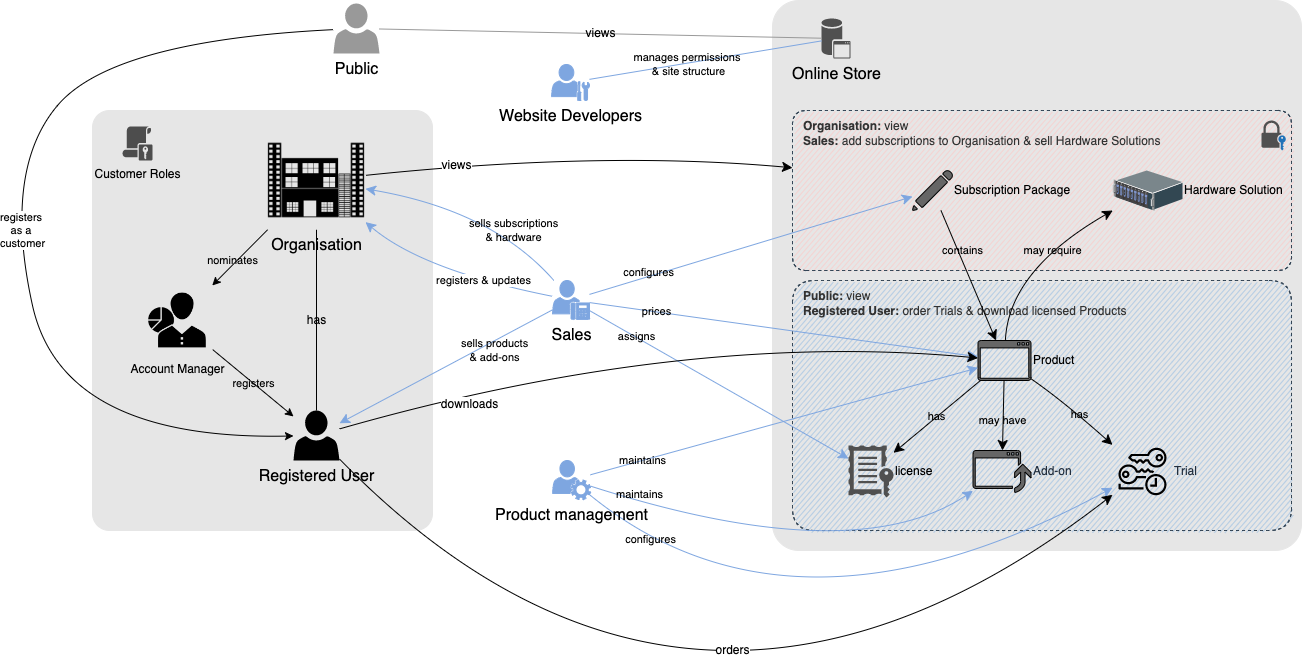
Especially in larger corporations that report to a board, business processes need to be documented clearly to show roles and responsibilities, and to support regular security and accounting compliance audits. Such documentation is easier to follow in diagram form.
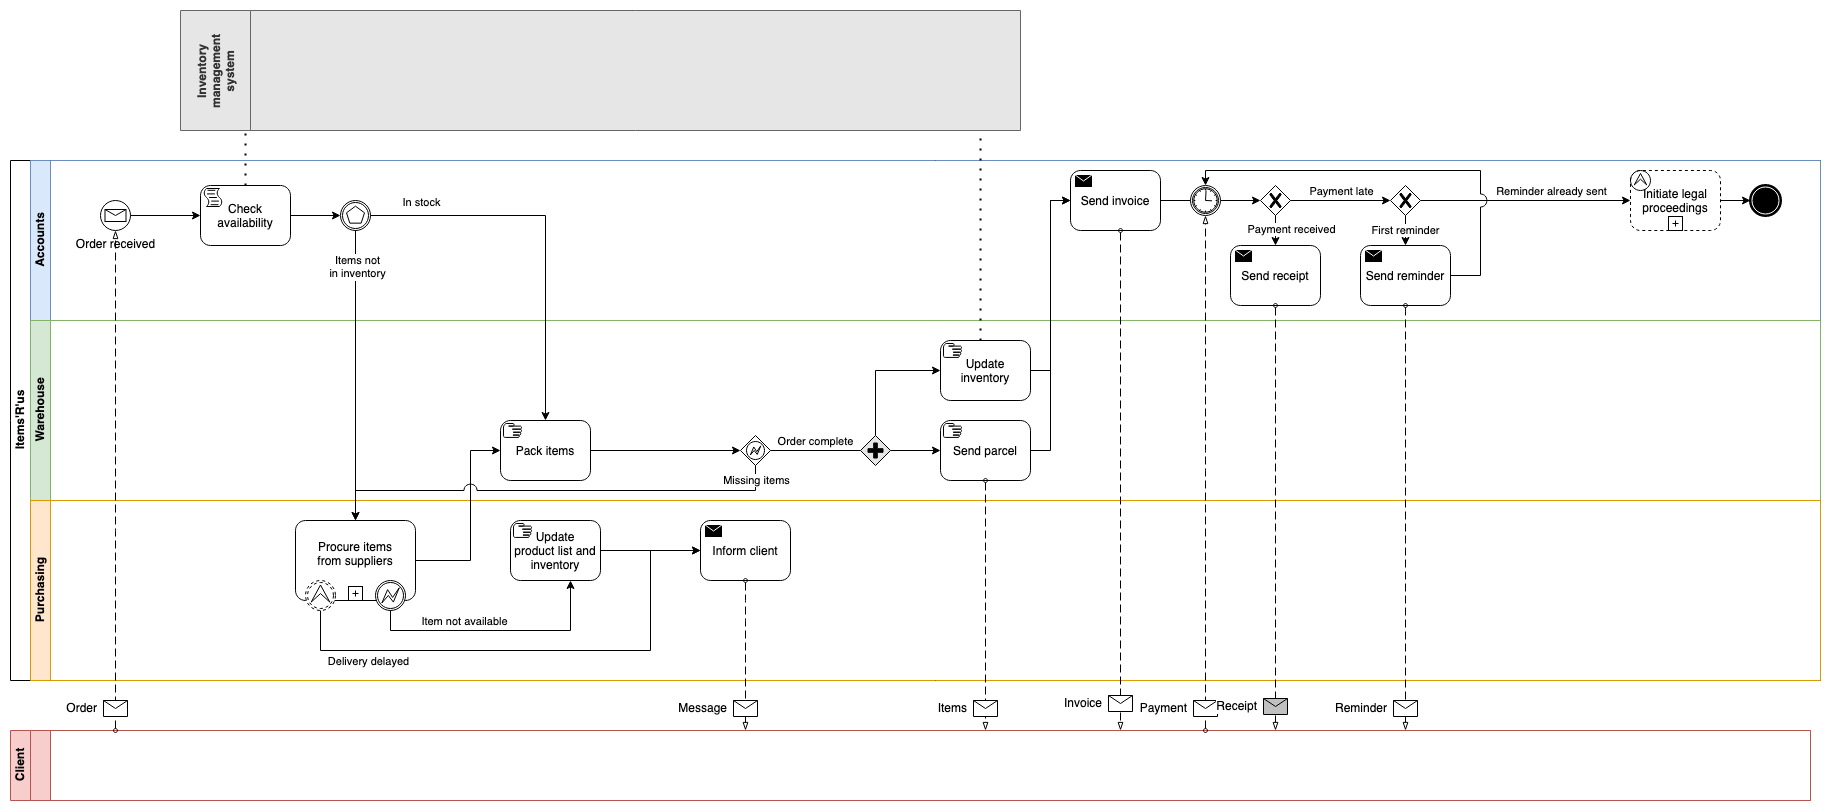
- Business processes - flowcharts, BPMN diagrams, swimlane diagrams, UML sequence diagrams, role and responsibility diagrams
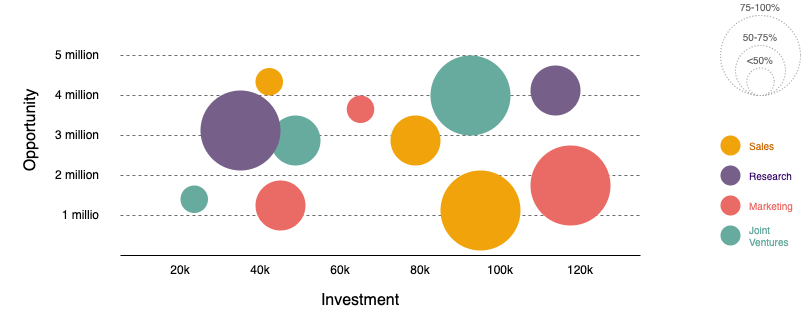
- Reporting or decision chains - org charts, infographics, Venn diagrams and bubble charts, presentation graphics
- IT infrastructures - network diagrams, rack diagrams, database and entity relationship models
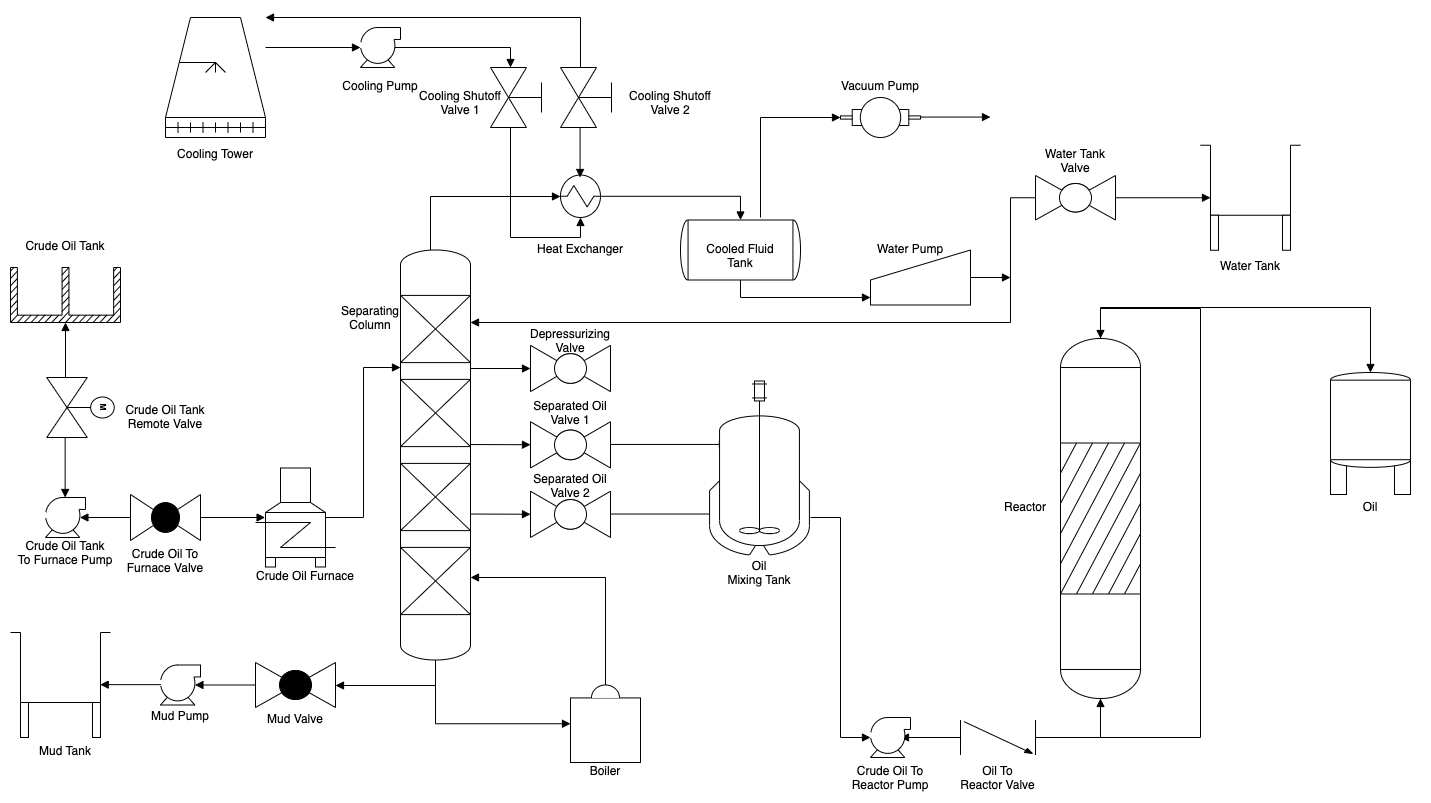
For regulated industries that need to demonstrate compliance, standard operating procedures document in full detail how to execute a process or task, including safety, quality, tools, machinery and materials information. Some industries may require you to use specific technical formats - for example, in draw.io, the fluid power shape library for ISO1219 compliance, or BPMN diagrams to document business processes.
Marketing and sales documents
While these aren’t usually considered technical documentation, the documents below can and do often include diagrams to encourage and convince prospective customers or investors. Export diagrams to PNG files and embed those image files into your business presentations and documents.
- White papers and case studies - simple flowcharts, concept maps, timelines, Venn diagrams and infographics
- Marketing analyses - PEST diagrams, SWOT tables, T-charts, 5C diagrams, timelines, floorplan-purchase heat maps
- Advertising and marketing campaigns - customer journeys, dependency graphs, storymaps, Gantt charts
draw.io makes it easy to embed diagrams in various document formats and share diagrams with your audience. Embed draw.io diagrams from cloud storage directly into your Office and Workspace documents with the draw.io apps. You can even embed a draw.io diagram directly in a HTML web page in an iFrame to let your online audience, or share a URL with the diagram data directly embedded within the address.
Technical diagramming best practices
The best practices for technical documentation also apply to technical diagrams:
- Keep documentation and diagrams together in a central place - have one source of truth.
- Track diagram changes with versioning.
- Have a regular review process to ensure diagrams are kept up to date or archived.
- Keep diagrams as simple and as clear as possible so they are easy to read.
- Follow a style guide or use a notation standard to help with consistency for certain types of diagrams.
draw.io allows you to keep your diagrams with your documentation: in Confluence and Jira; stored on a cloud platform such as Google Drive, Microsoft One Drive or Dropbox; in GitHub or GitLab; or inside your company’s infrastructure.