features
import
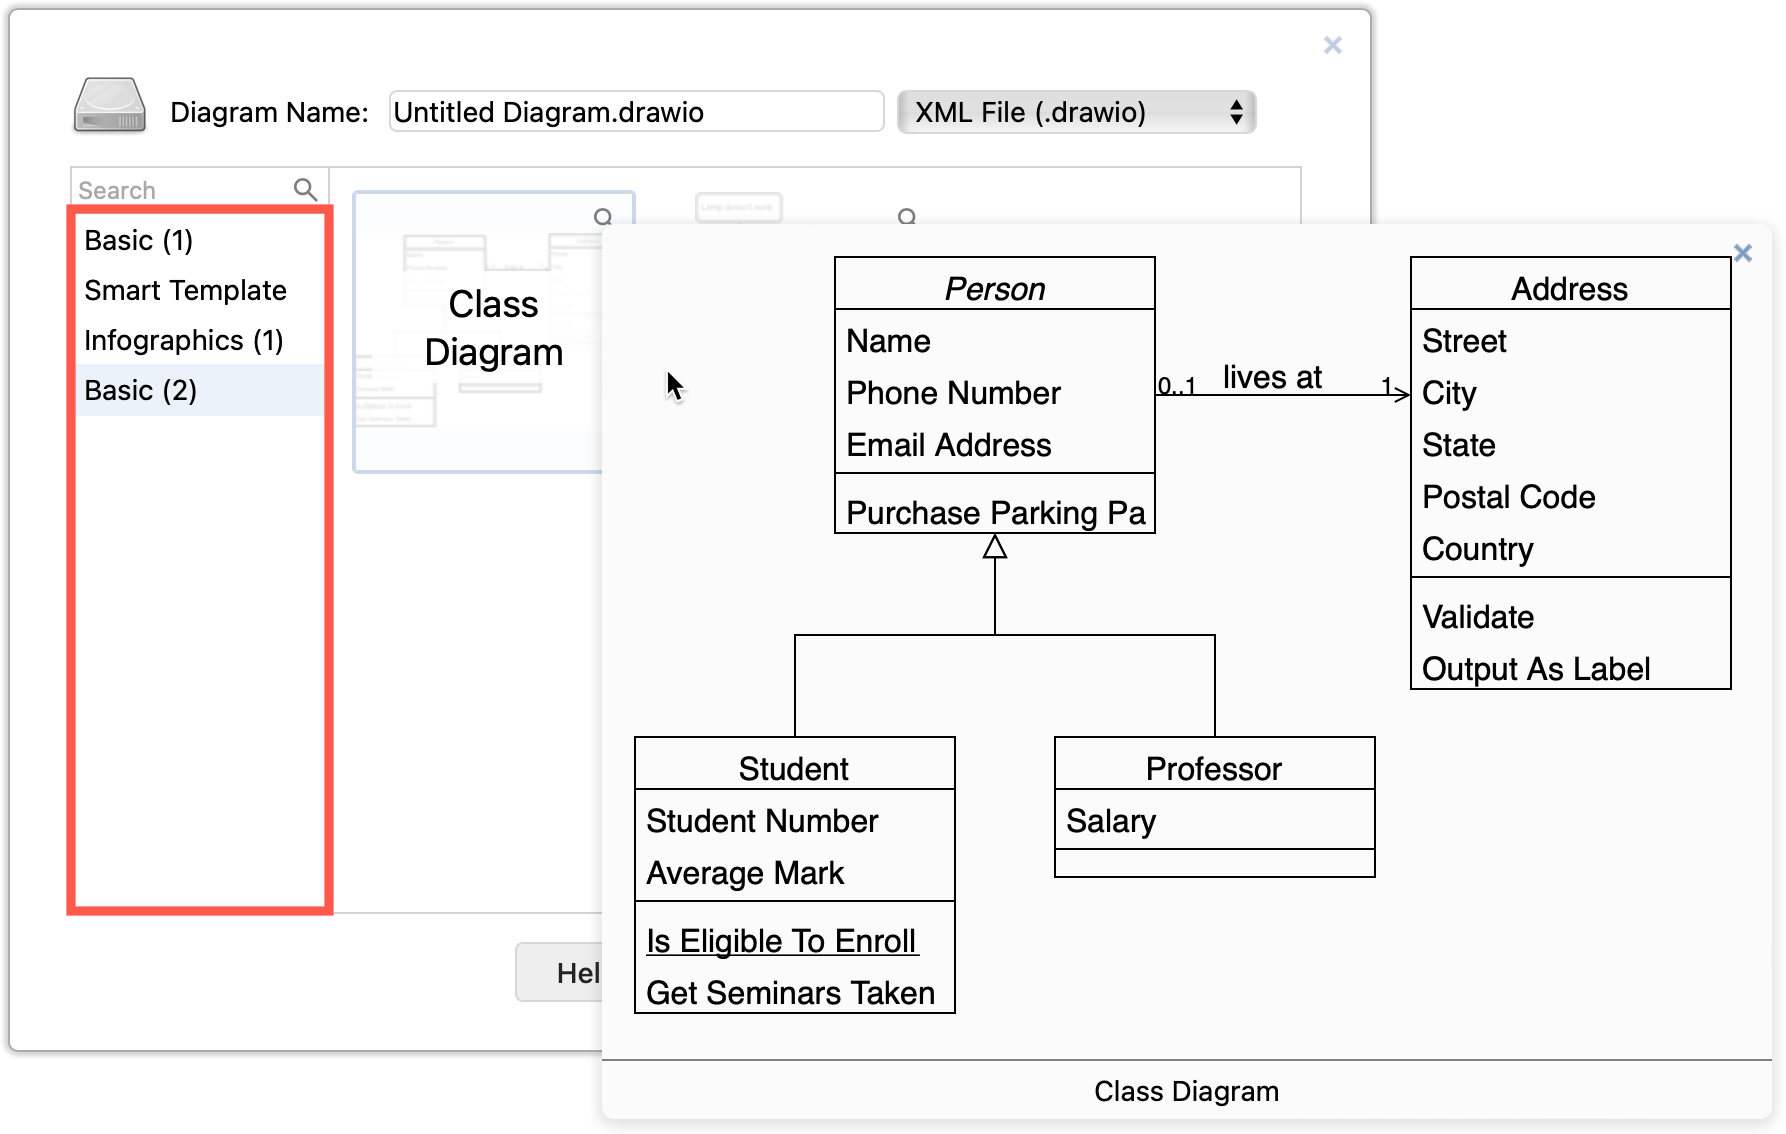
templates
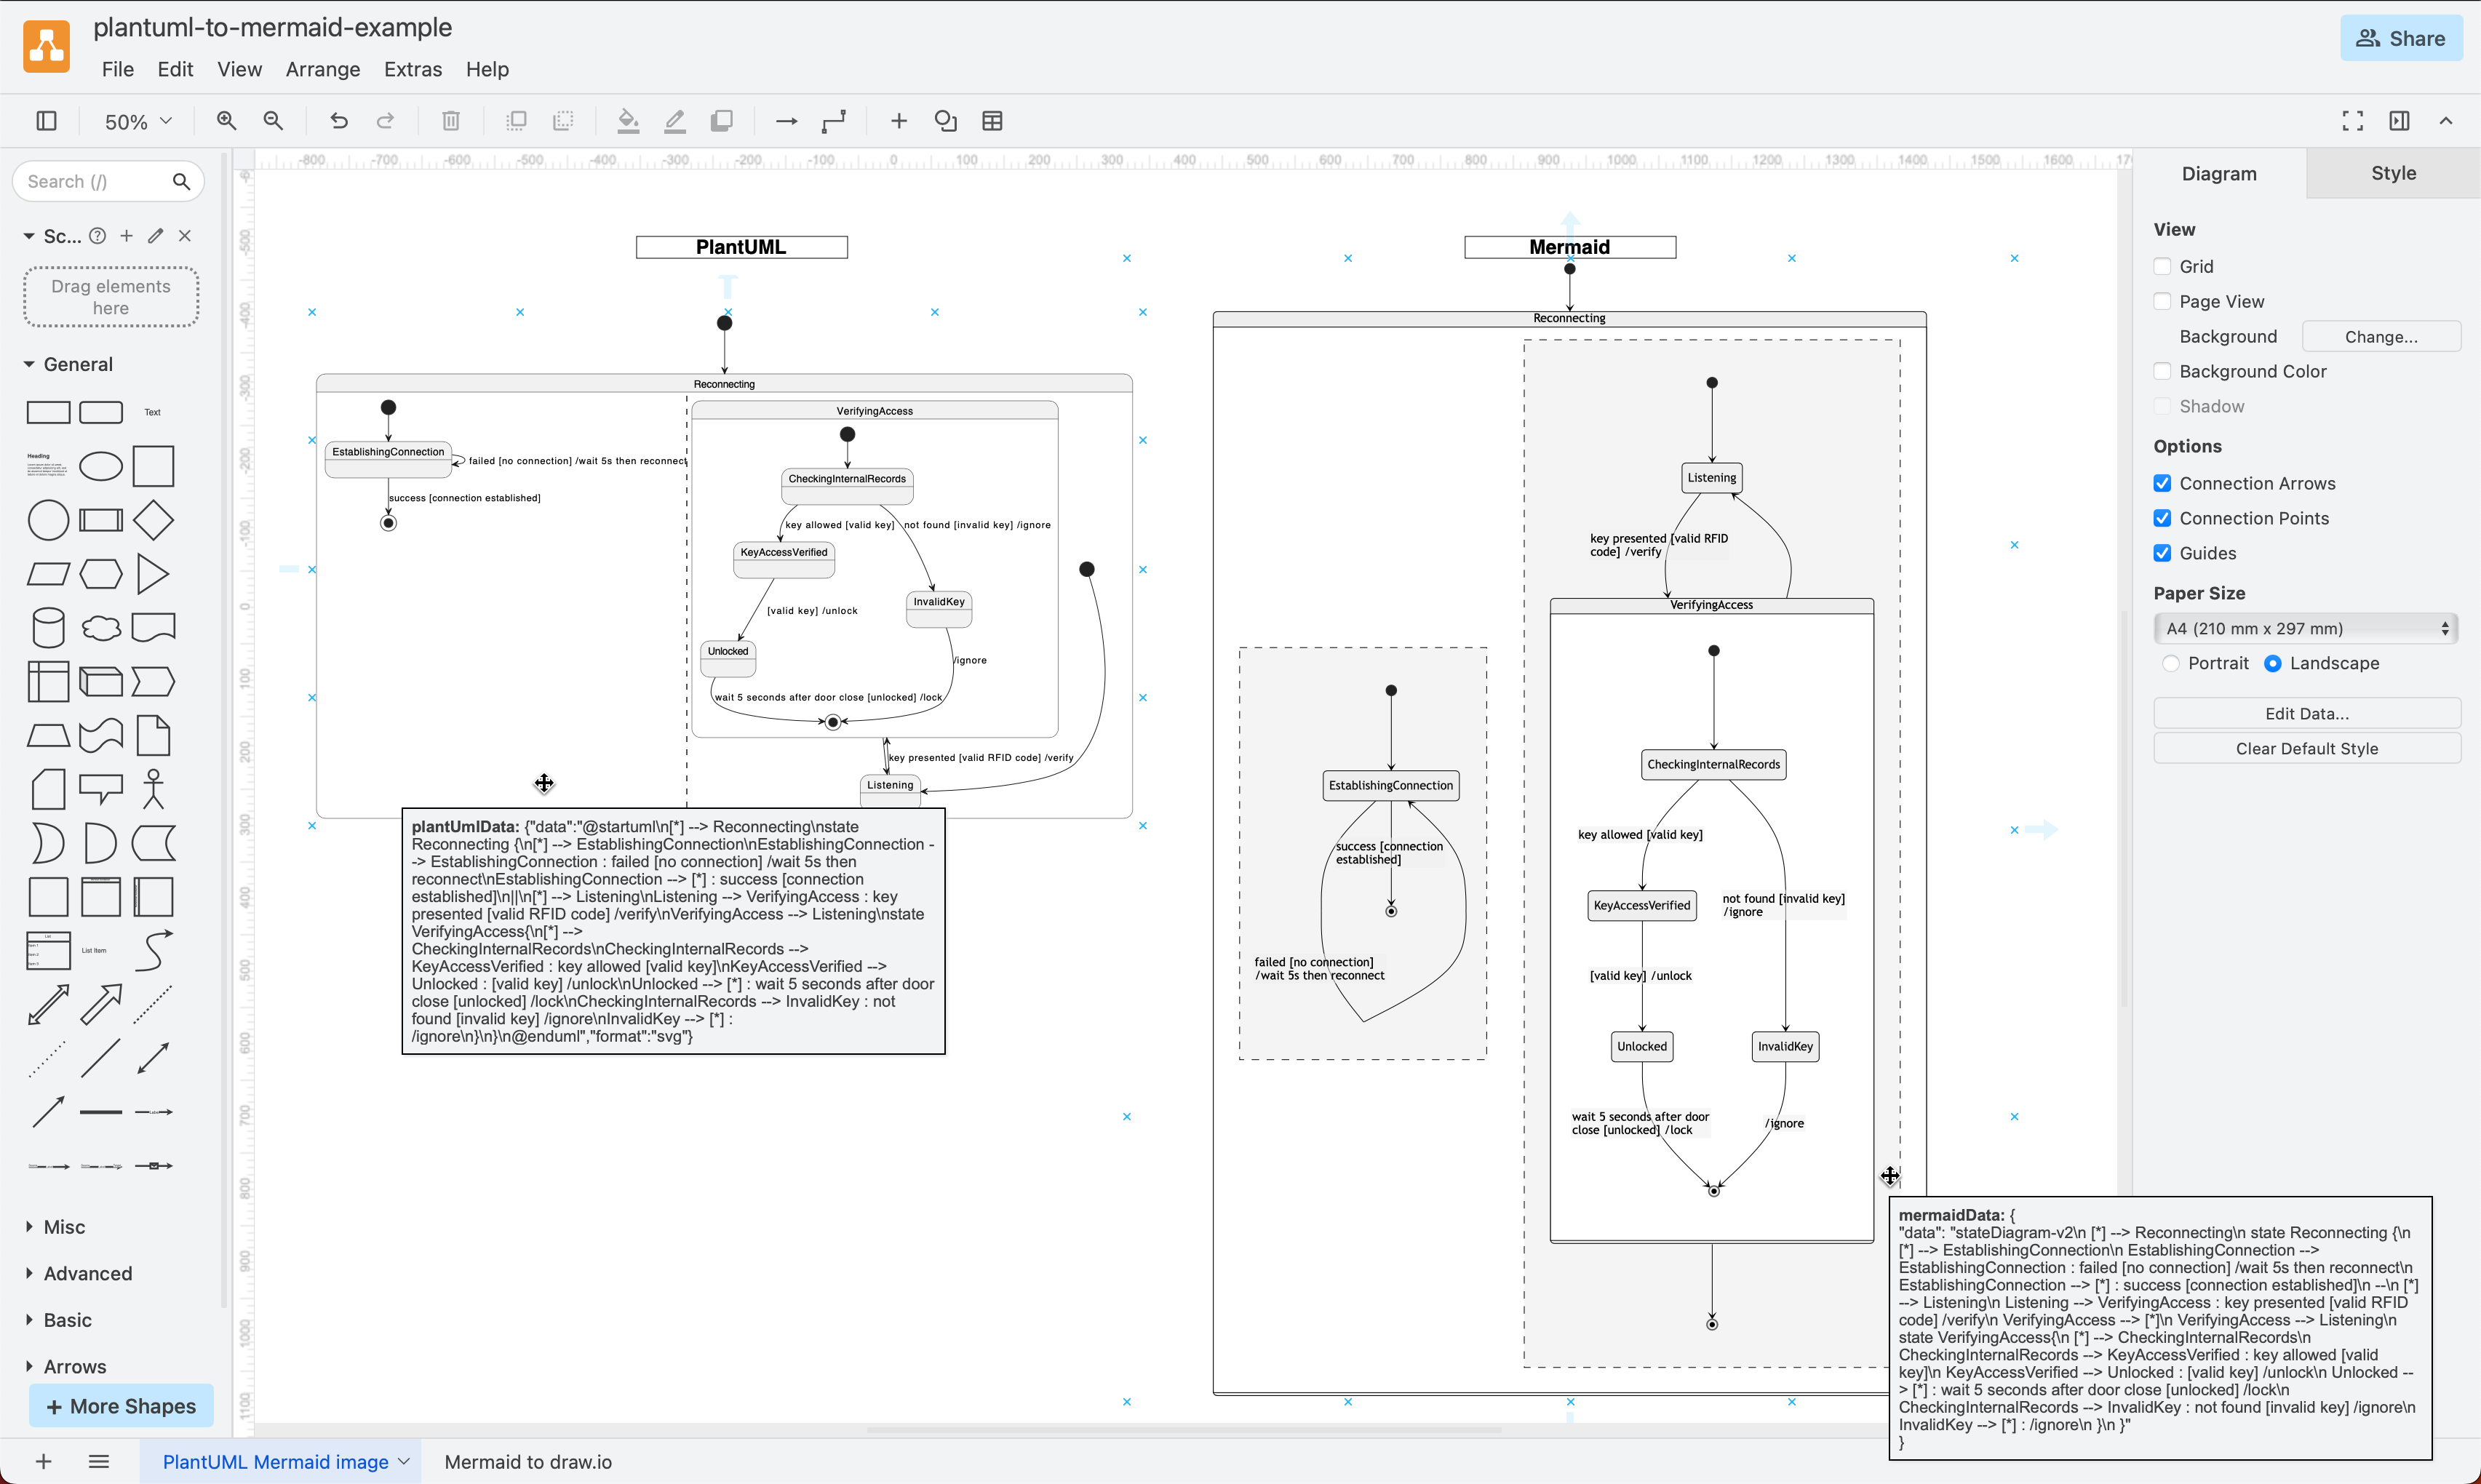
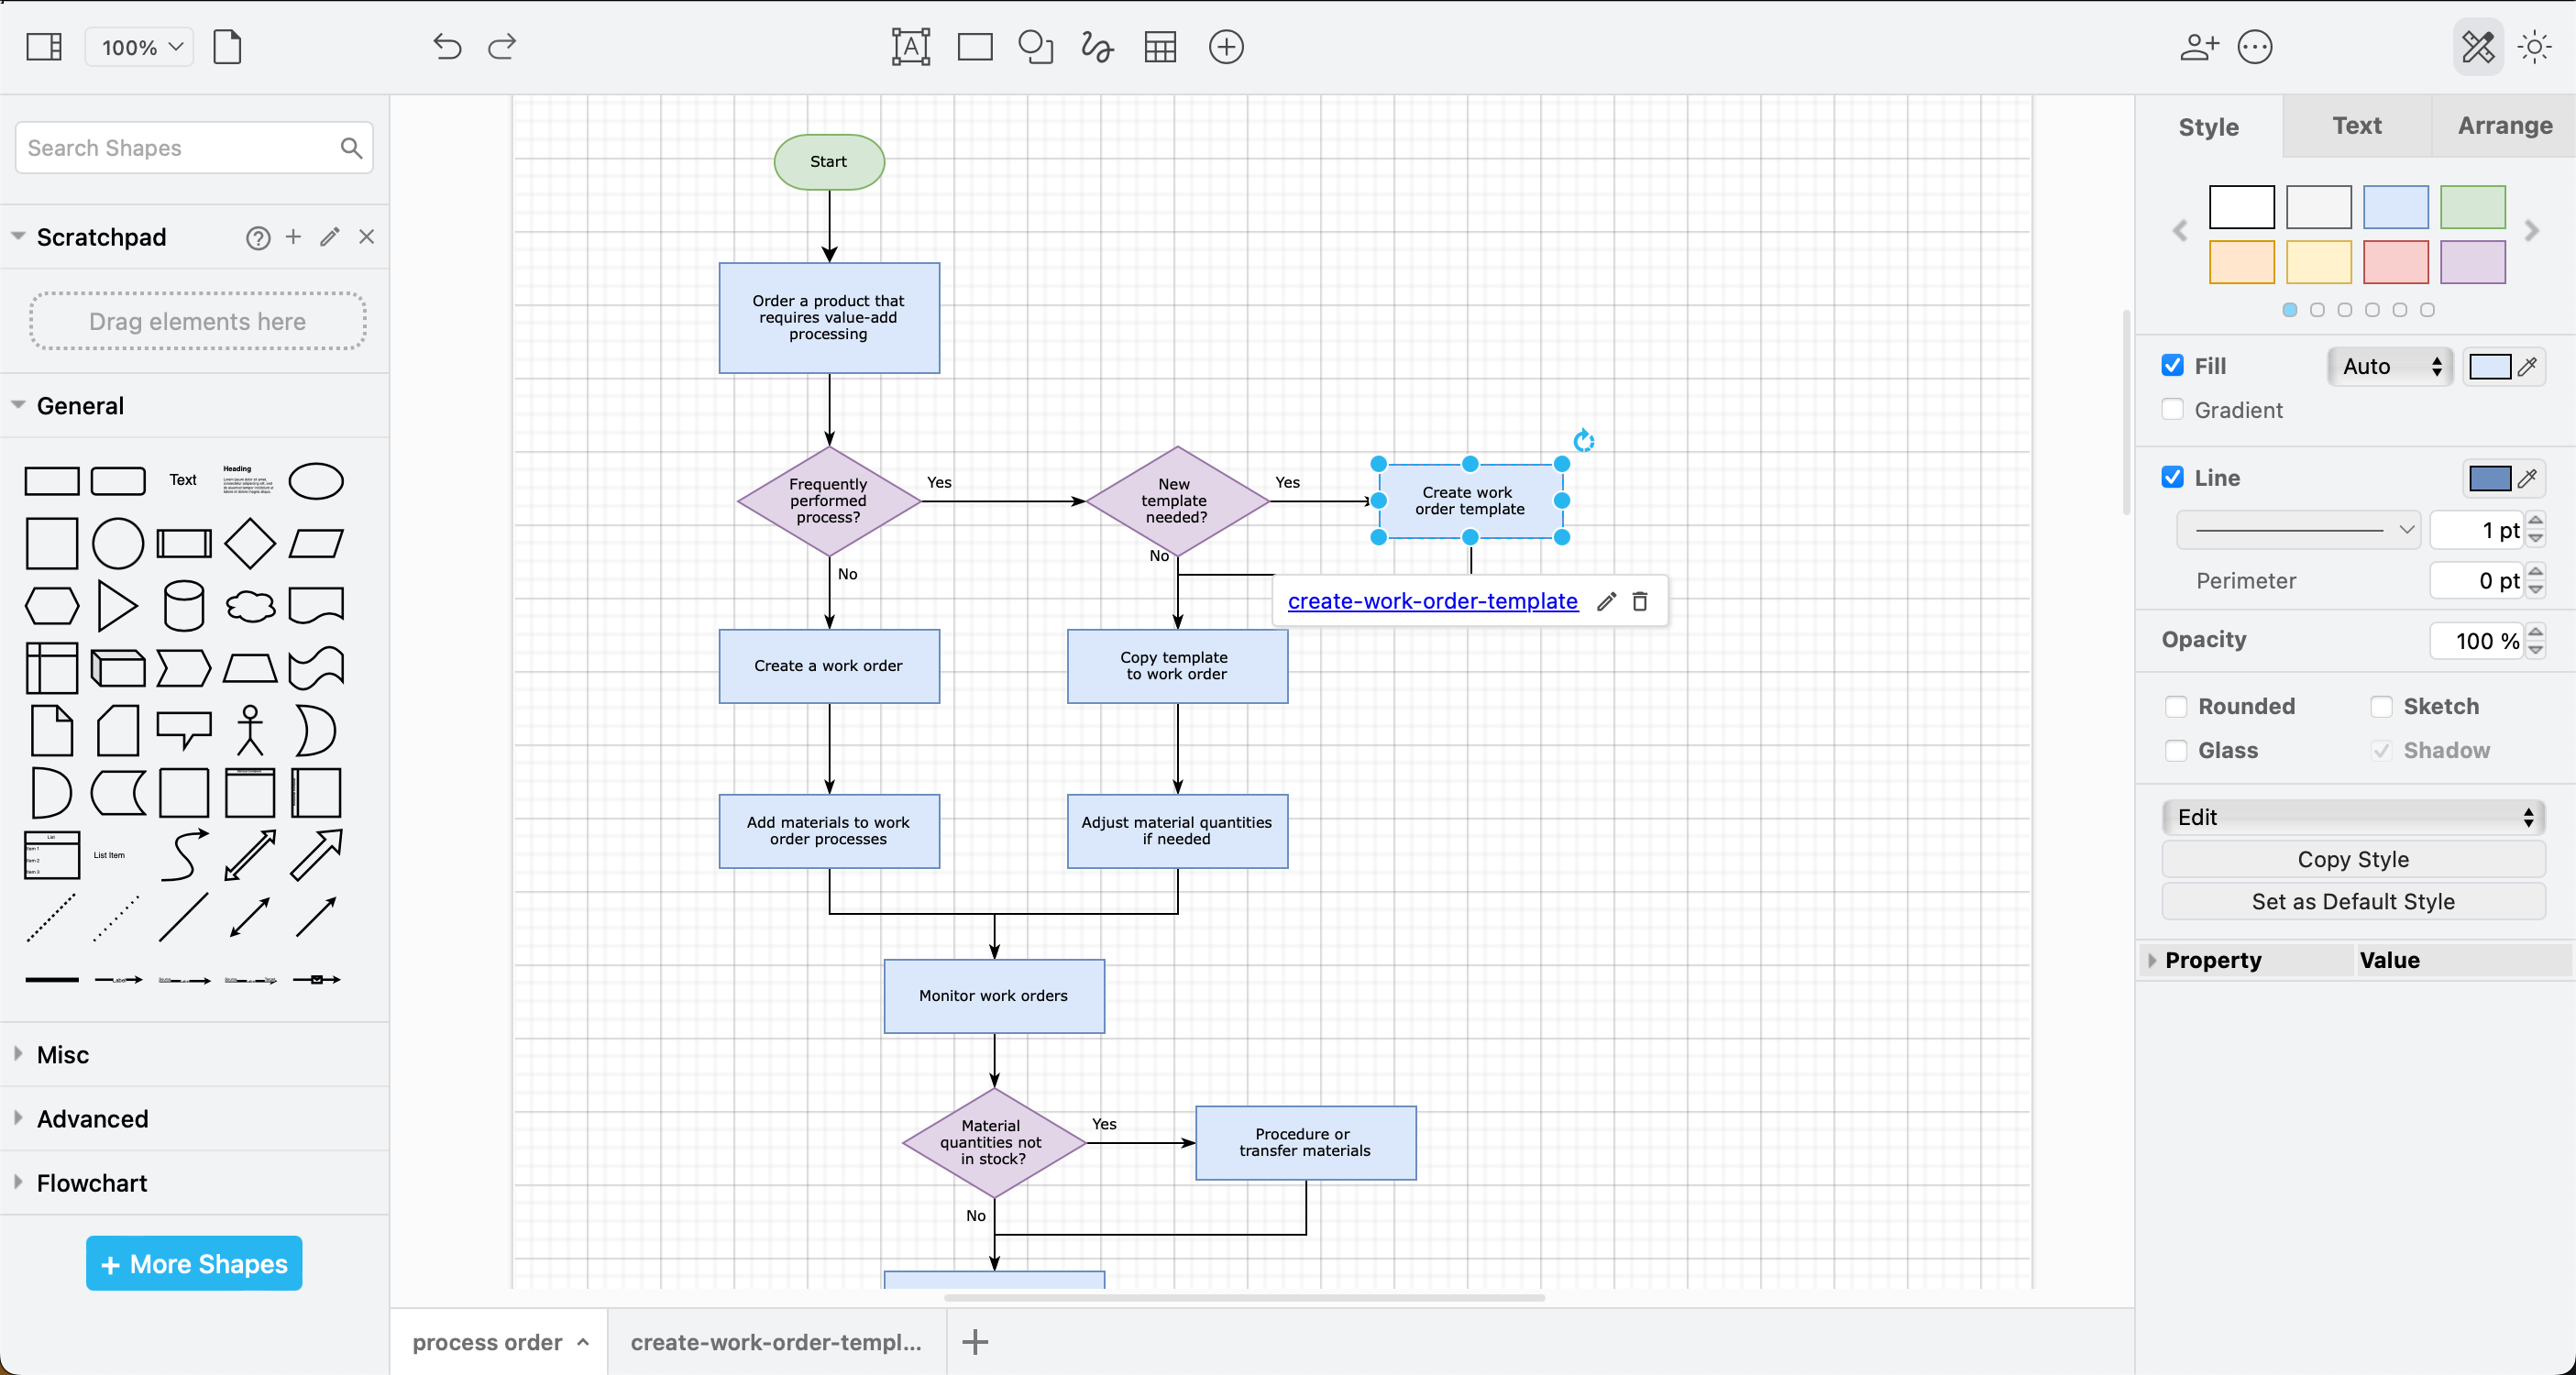
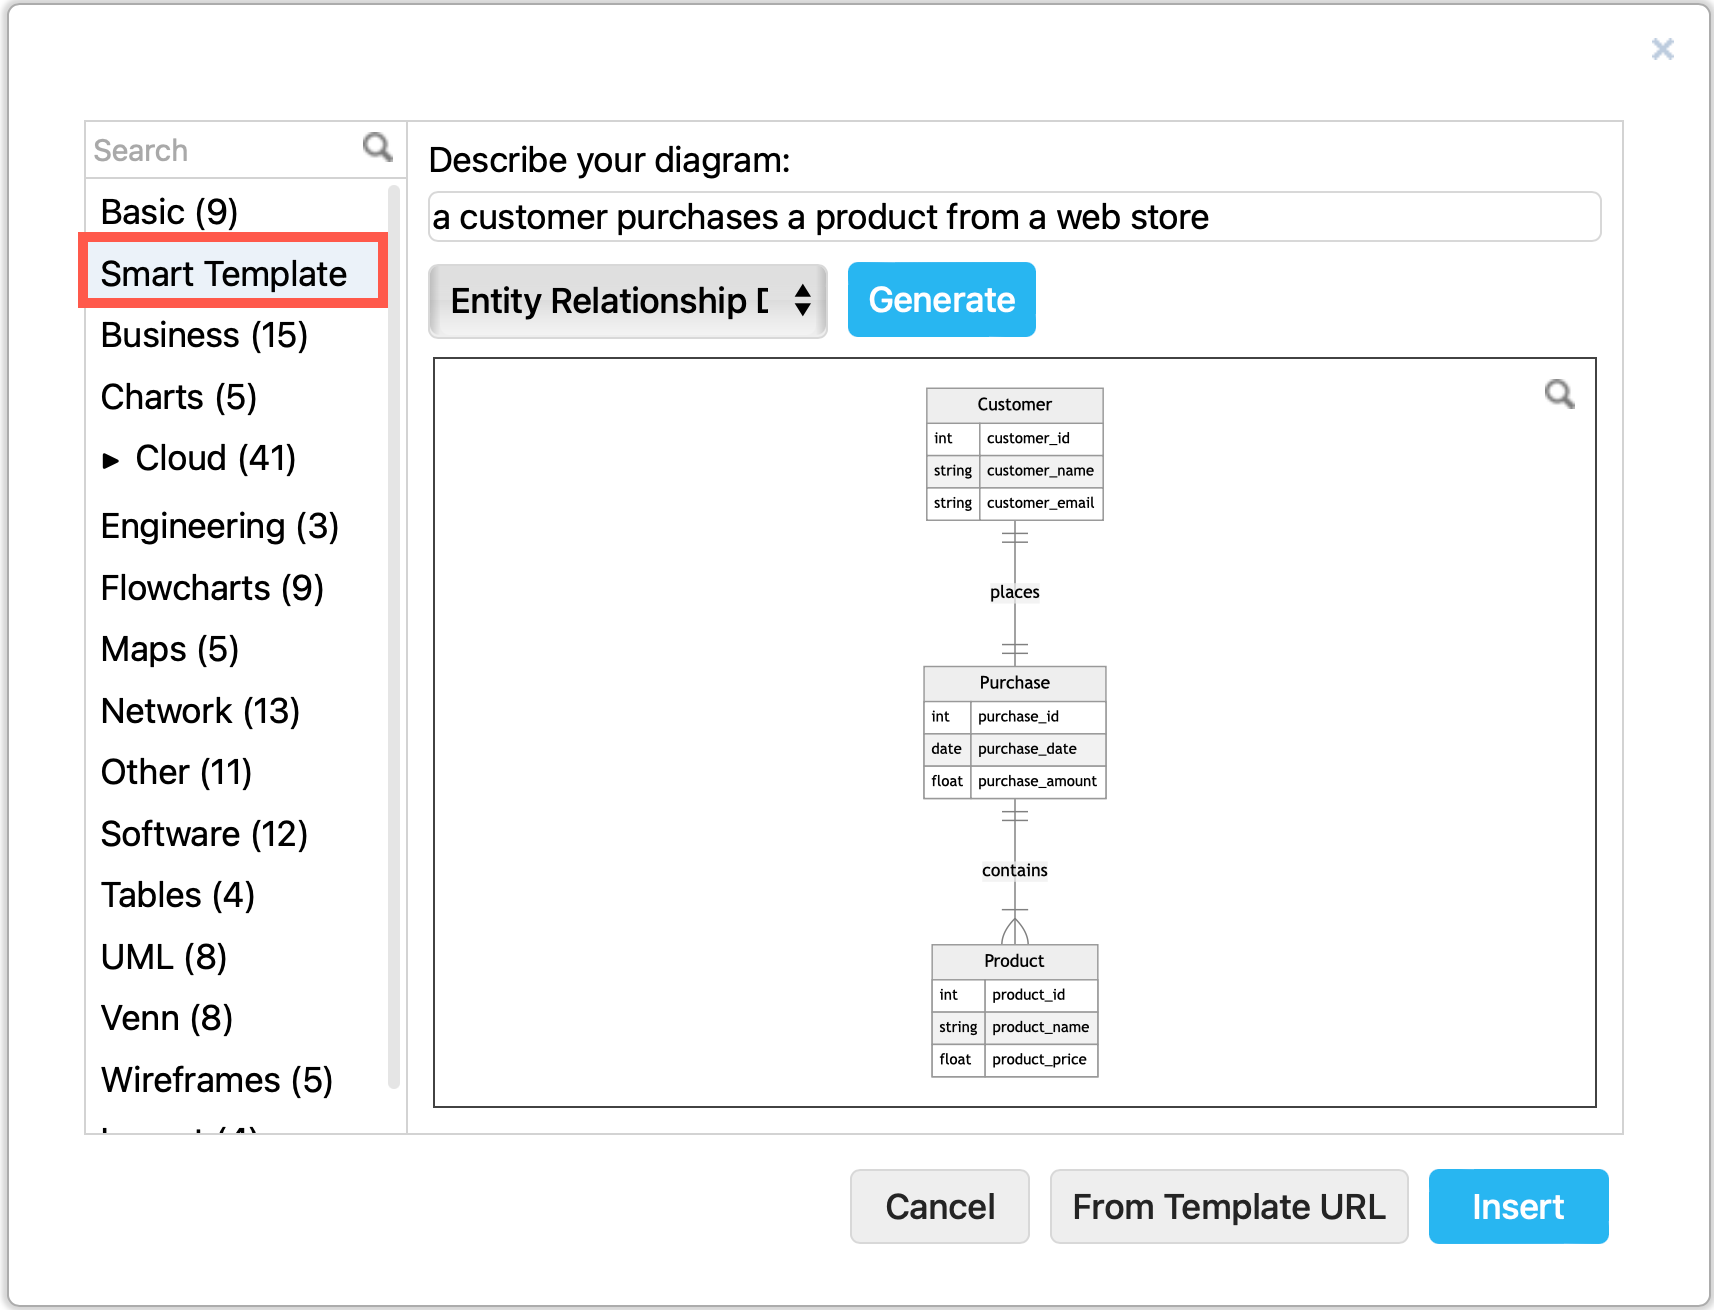
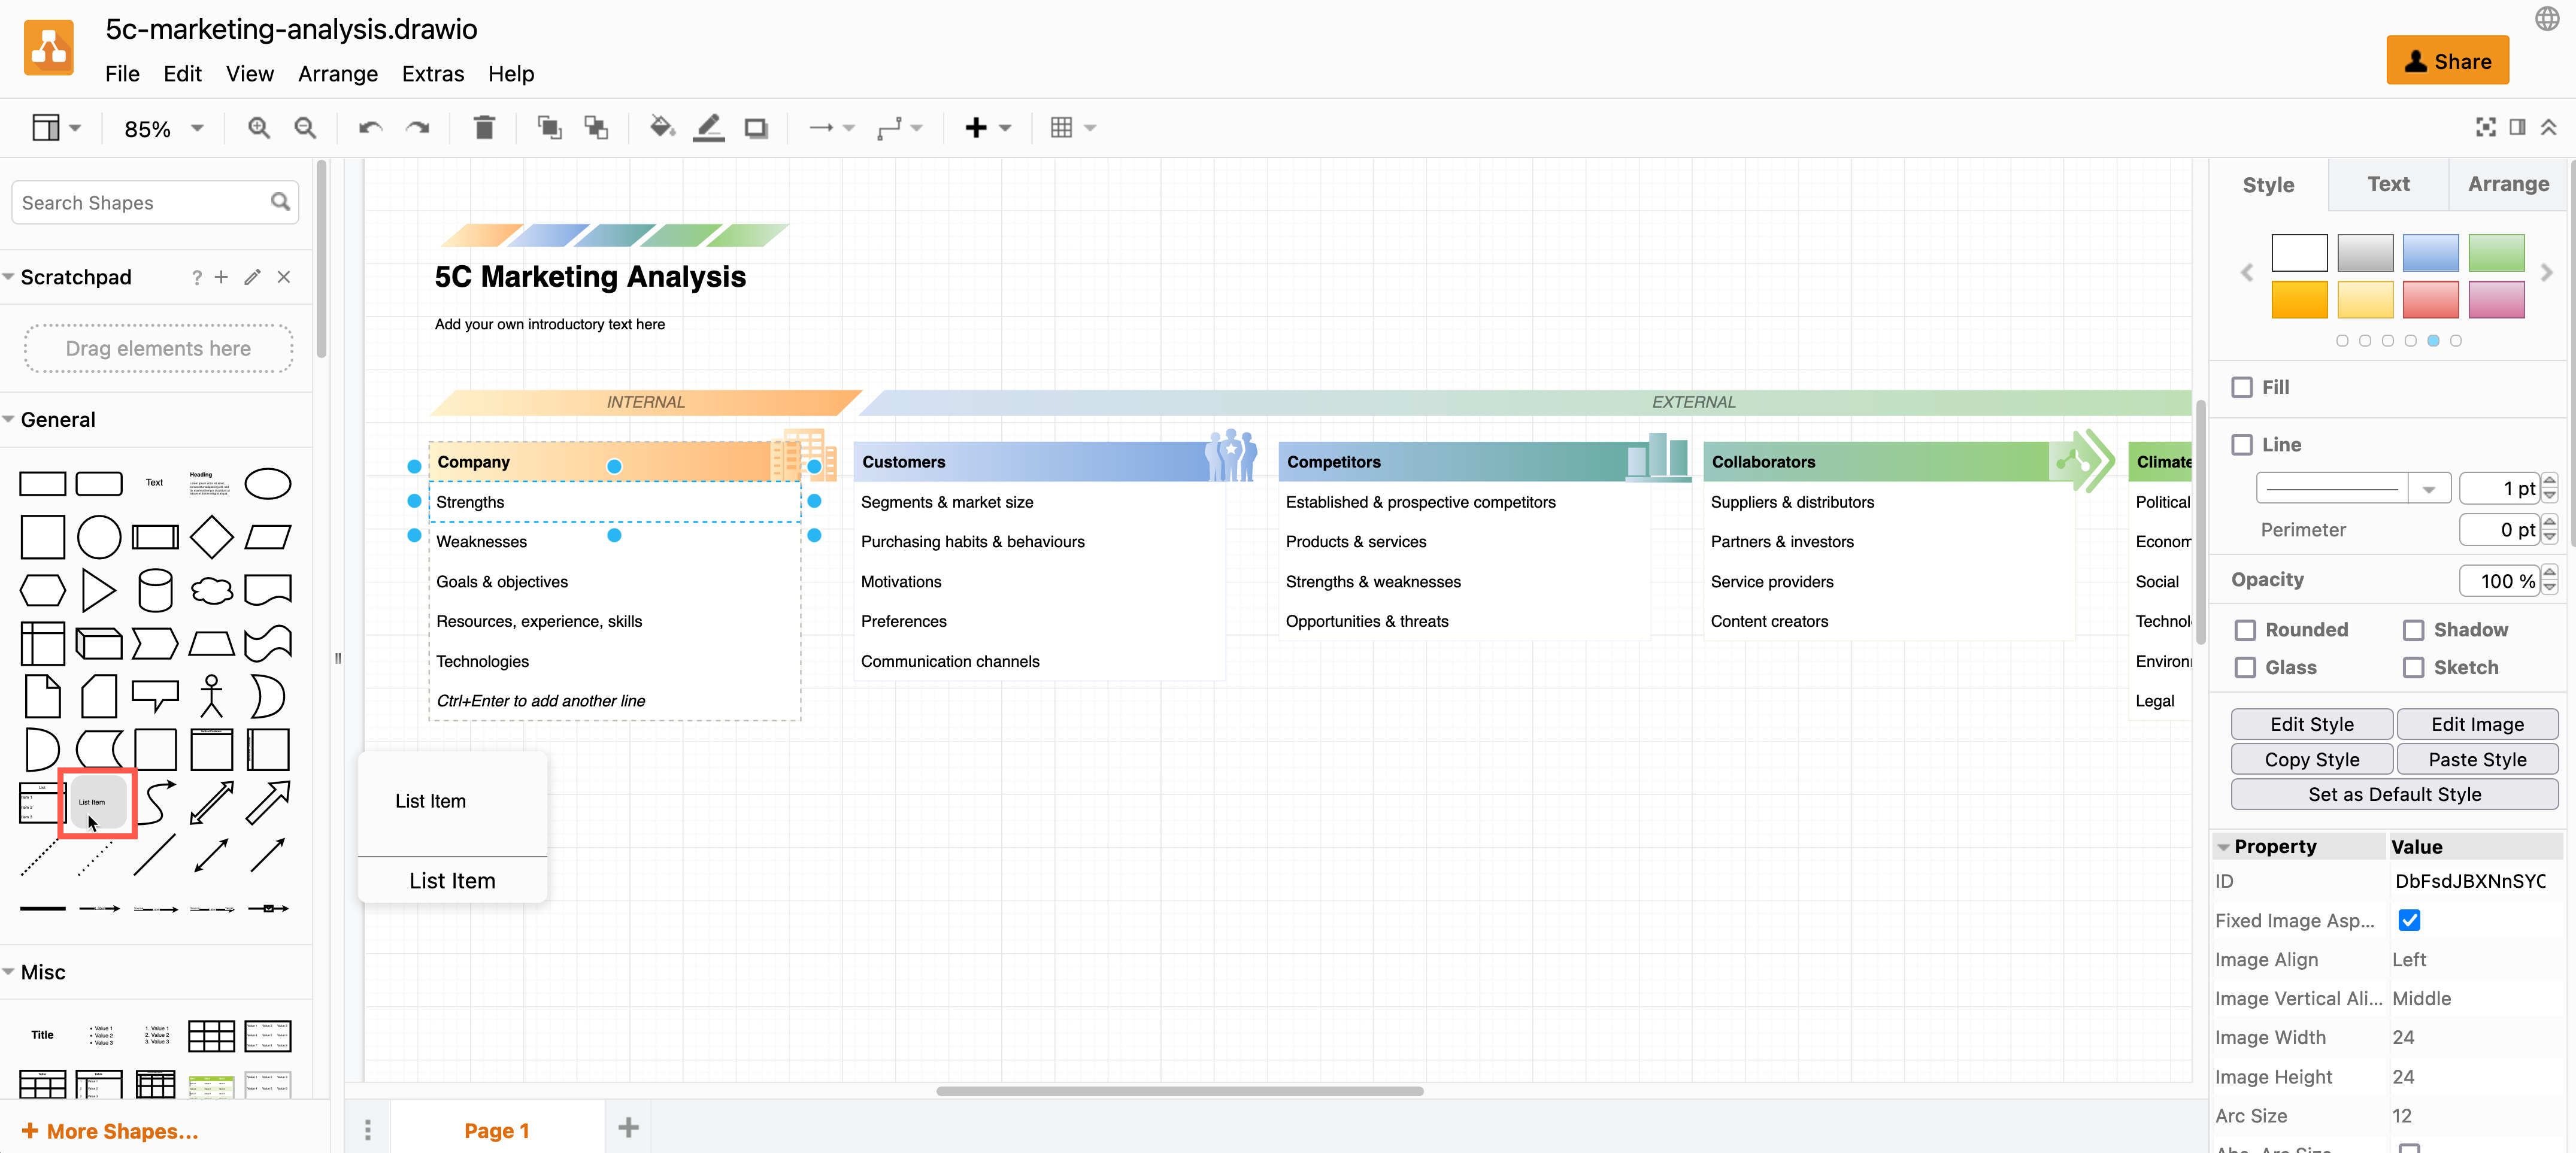
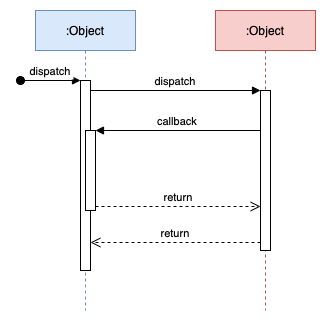
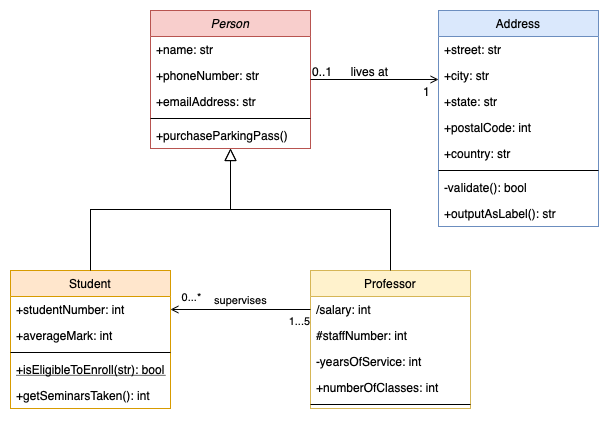
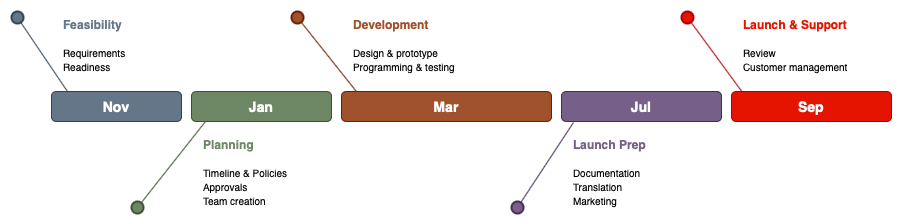
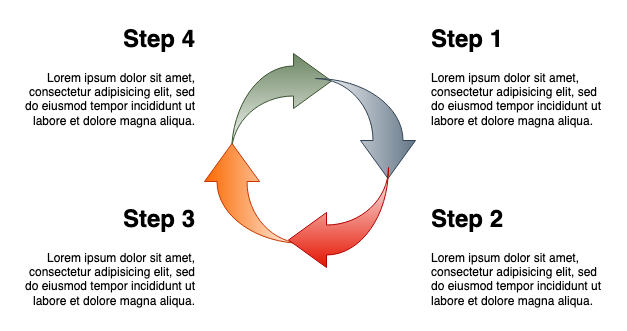
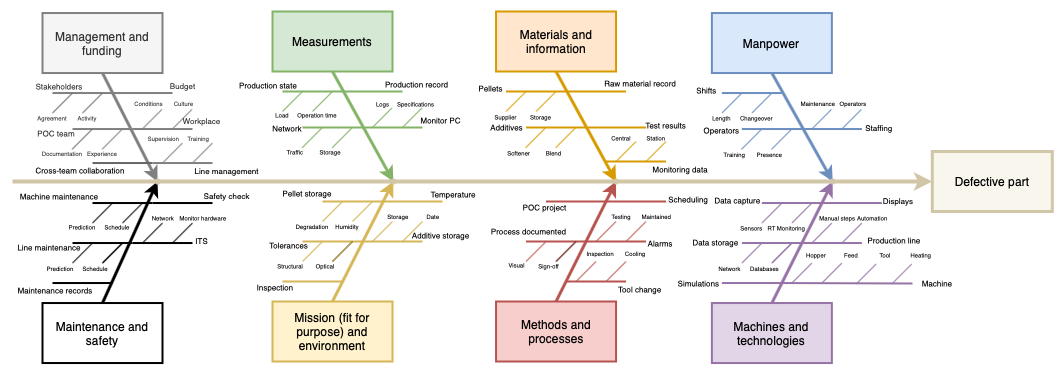
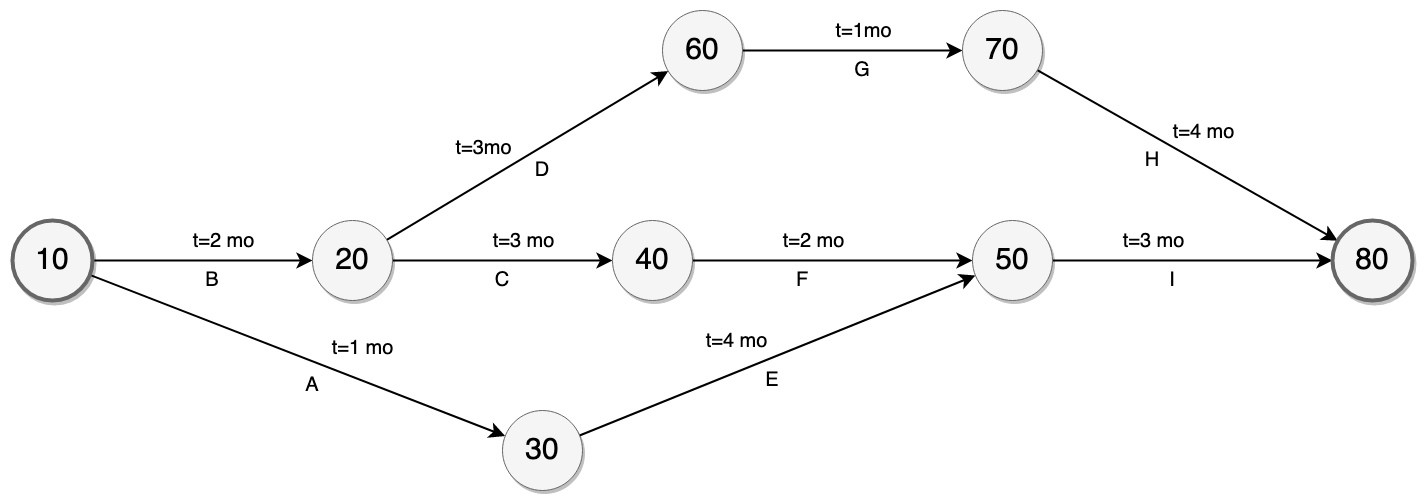
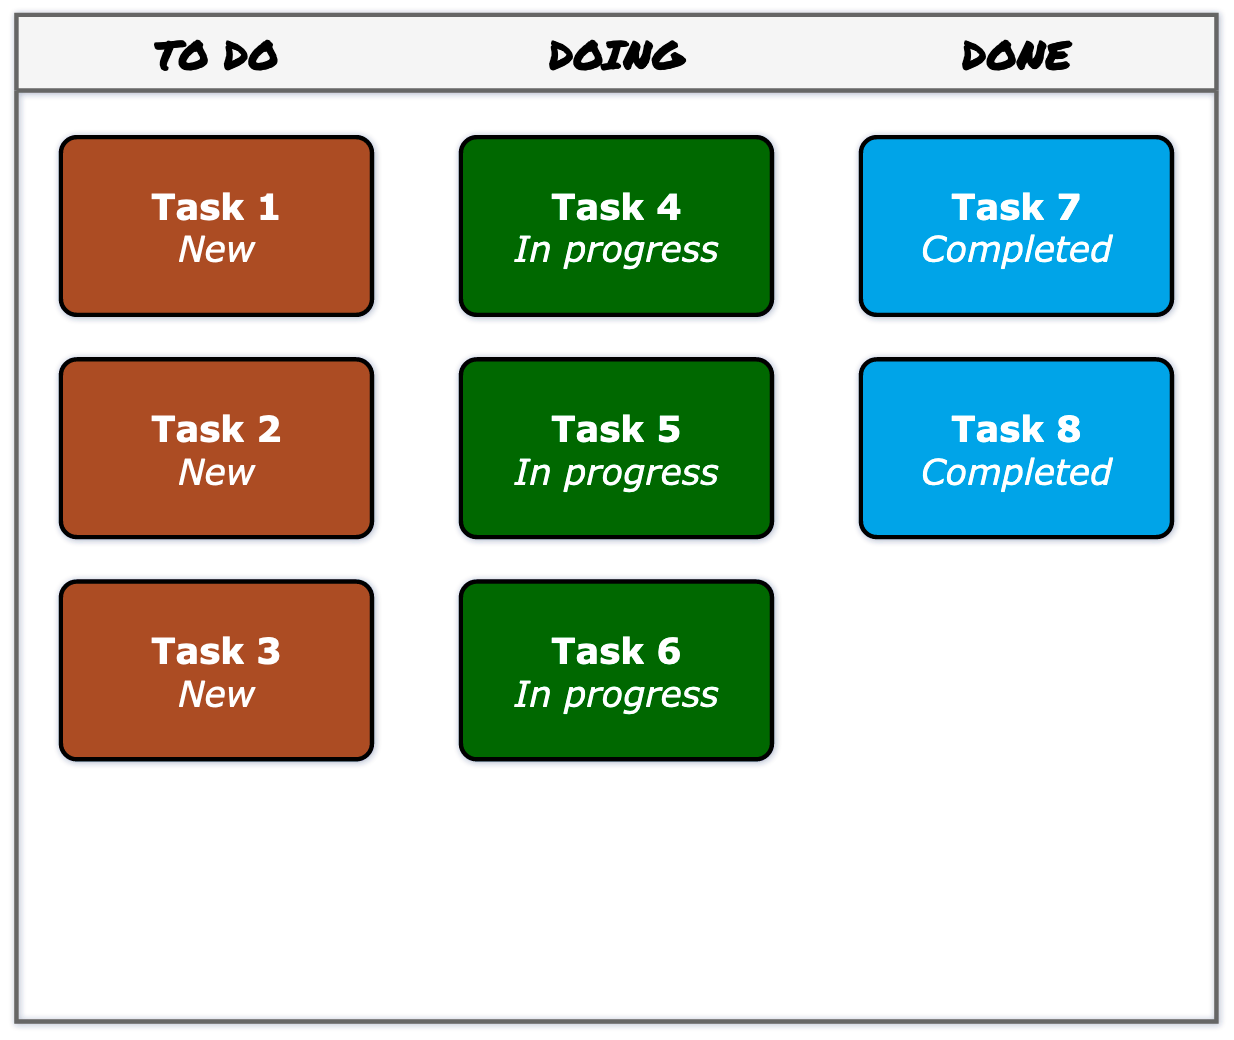
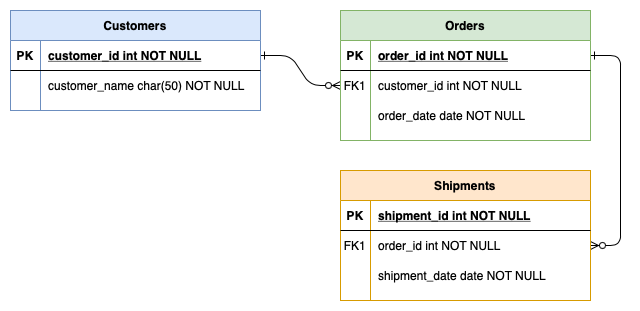
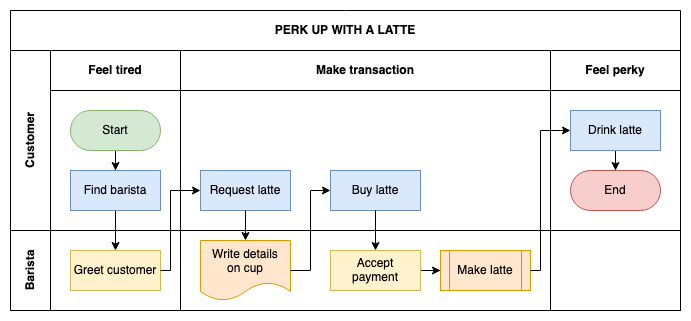
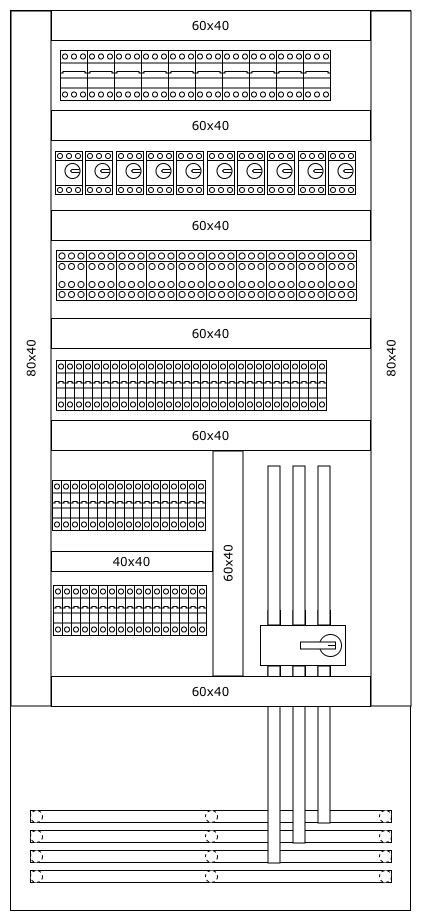
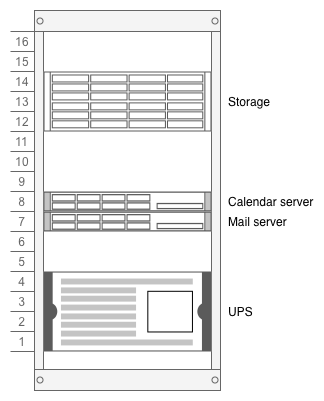
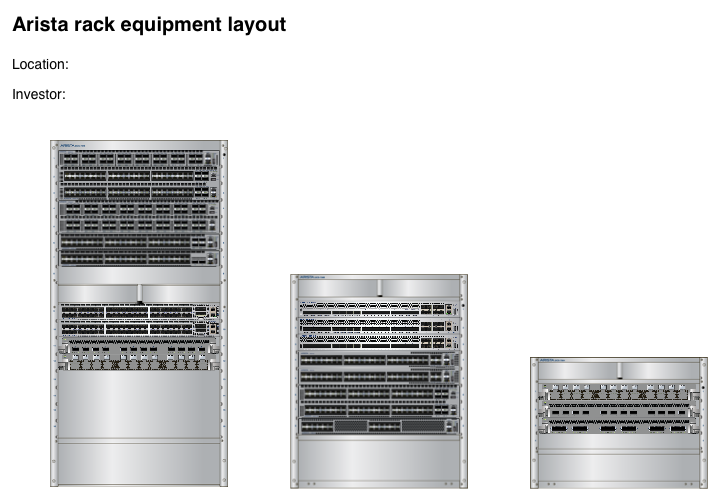
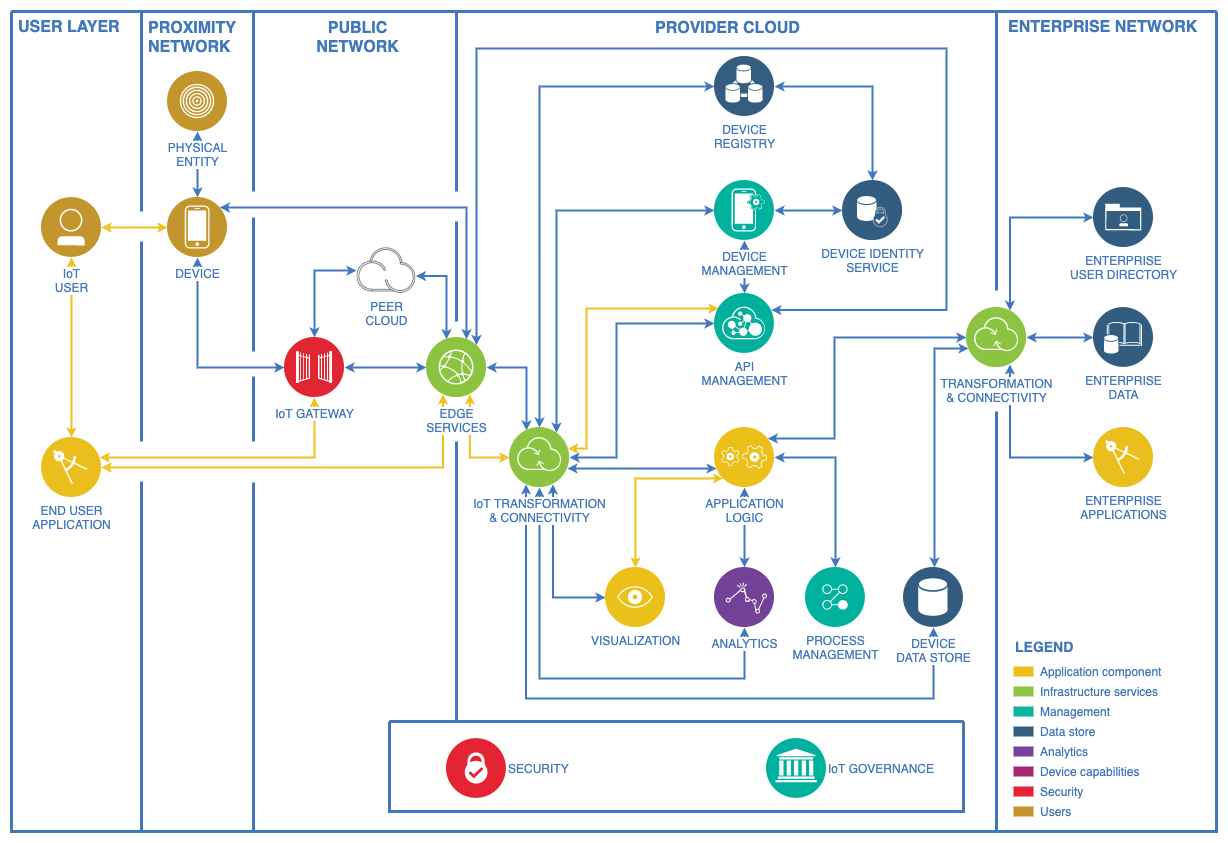
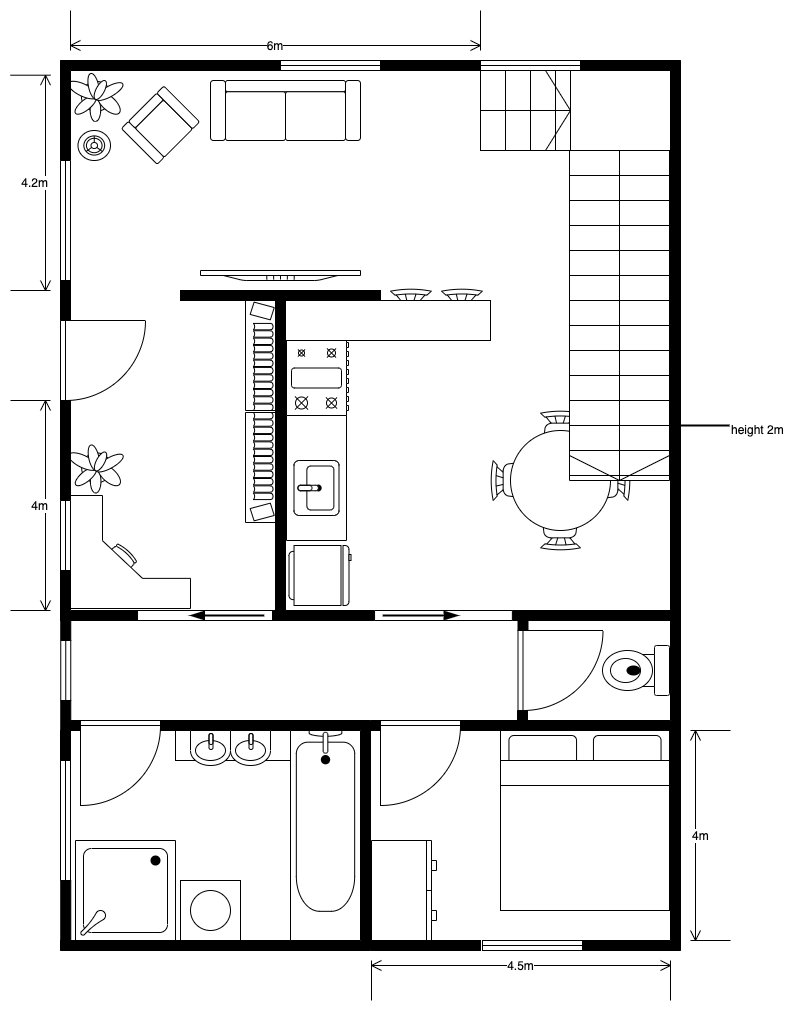
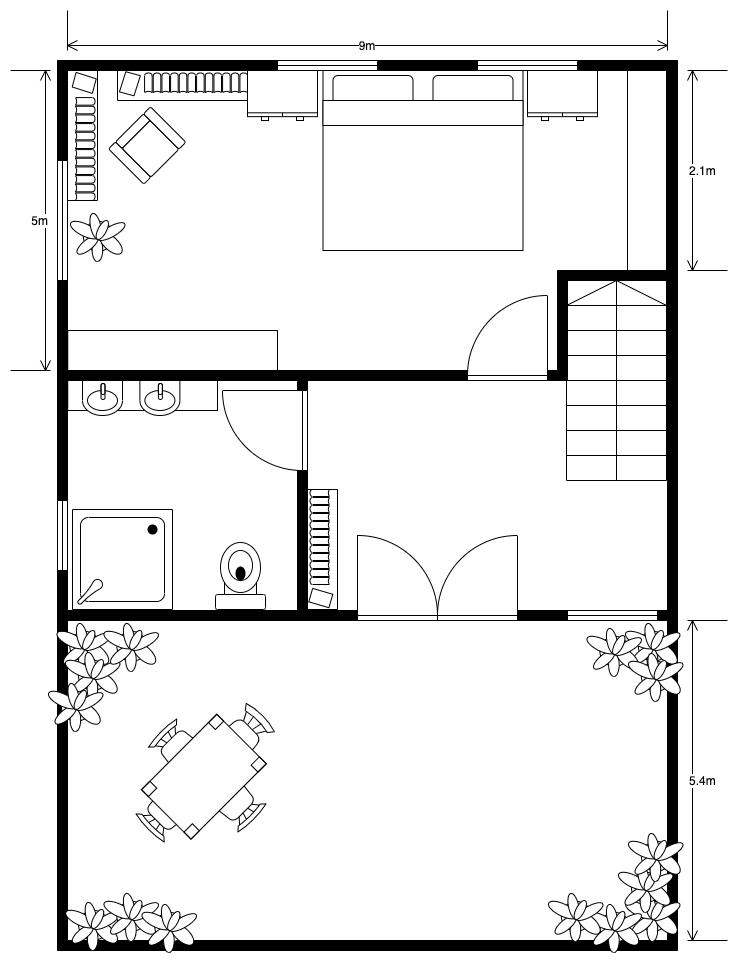
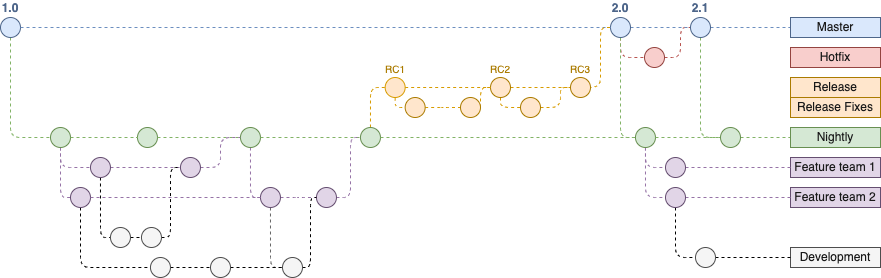
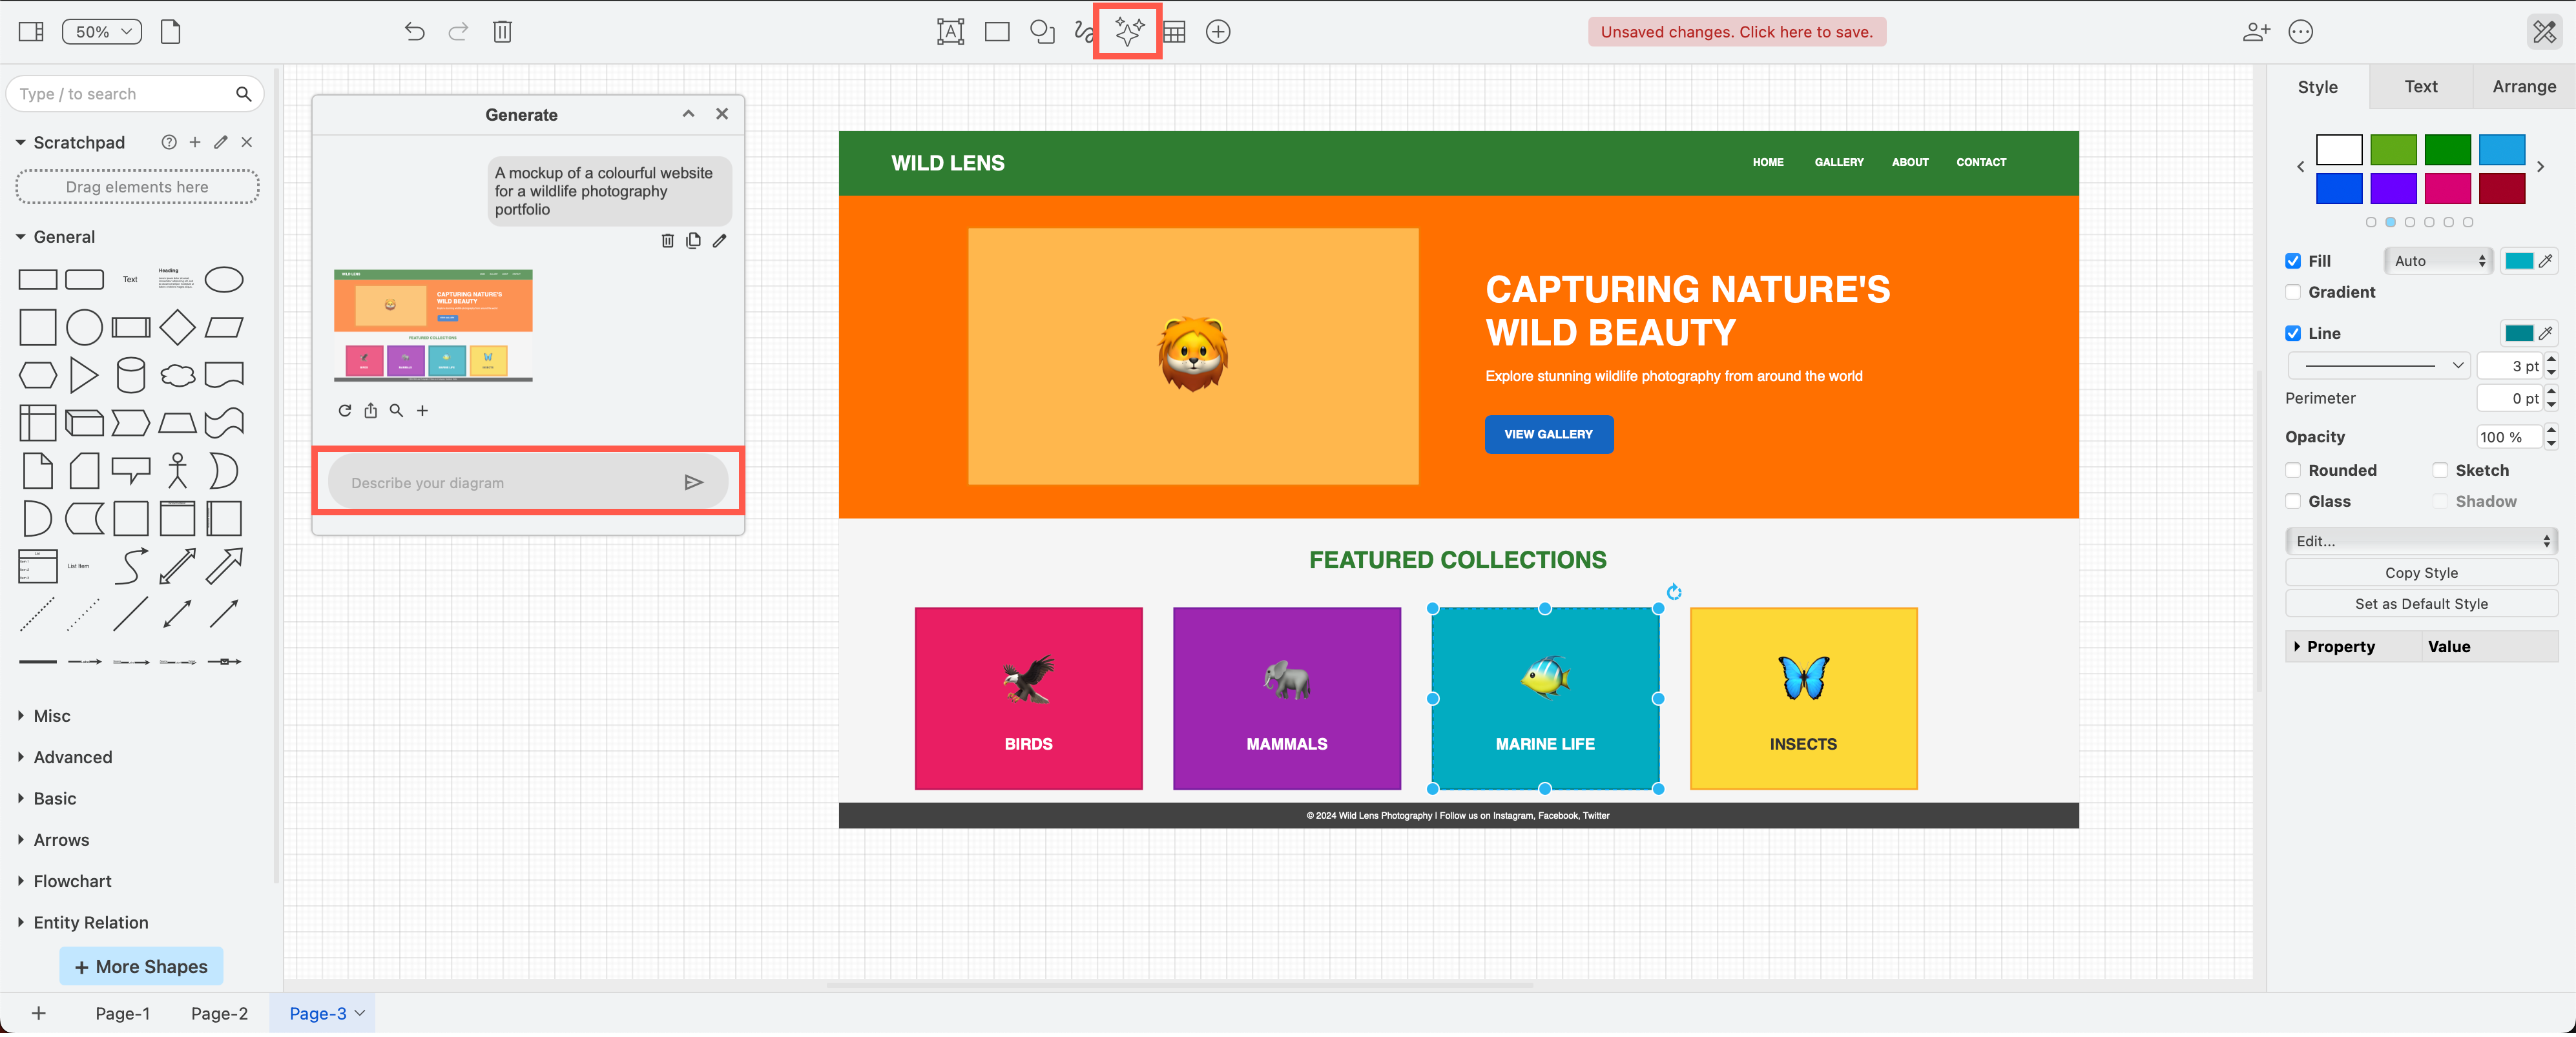
Generate more types of diagrams in draw.io with the new sparkle tool
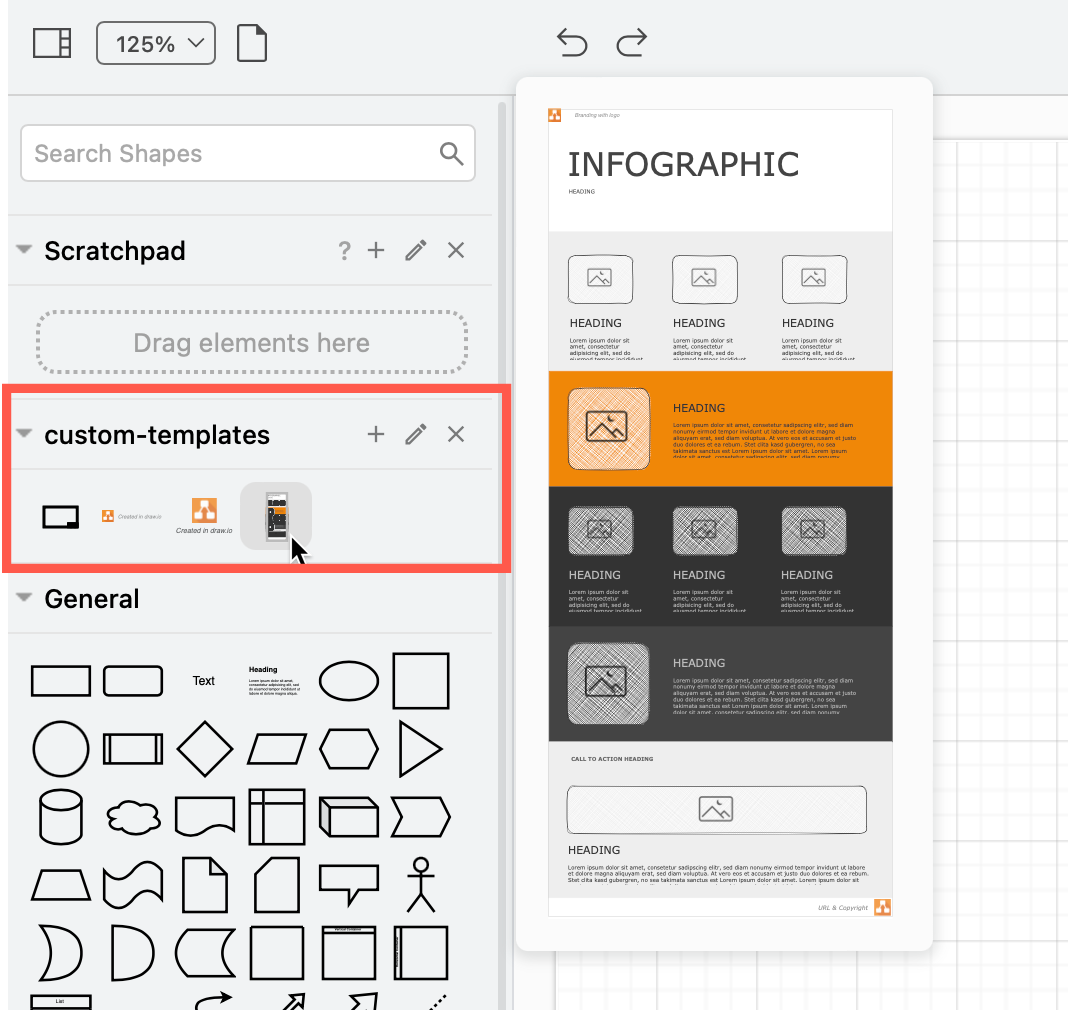
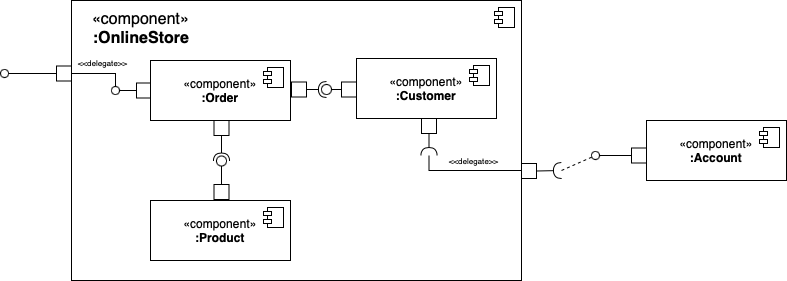
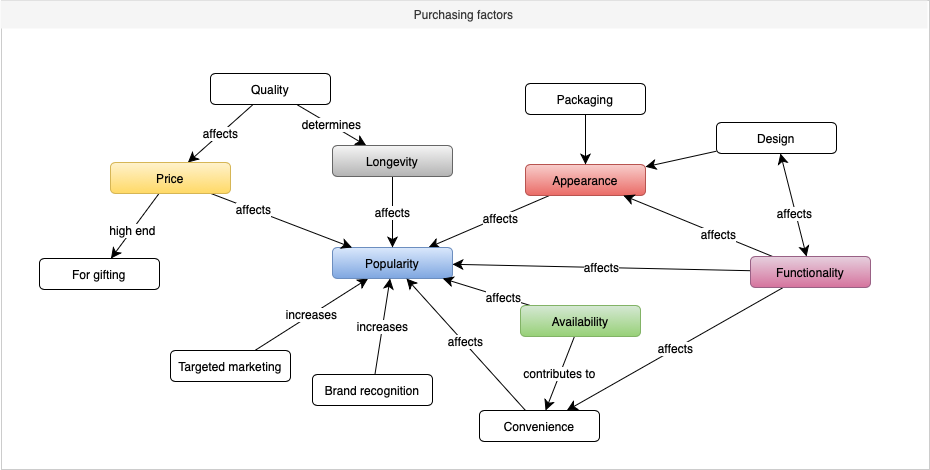
The smart templates feature has been upgraded - click on the new Generate tool (sparkle button) in the draw.io toolbar to generate a diagram. The Generate tool uses multiple AI generators to support a wider range of diagrams, including interface mock-ups, infrastructure diagrams, Mermaid diagrams and more.
01 Dec 2025