Salesforce diagrams
Salesforce diagrams let you visualise your system and solution architectures using a set of icons (shapes) recommended by Salesforce.
Salesforce have developed a set of icons that can be used in marketing and sales strategy diagrams as well as process and infrastructure documentation.
Tip: Click on any of the diagram images to open it in the draw.io viewer.
Open the Salesforce shape library
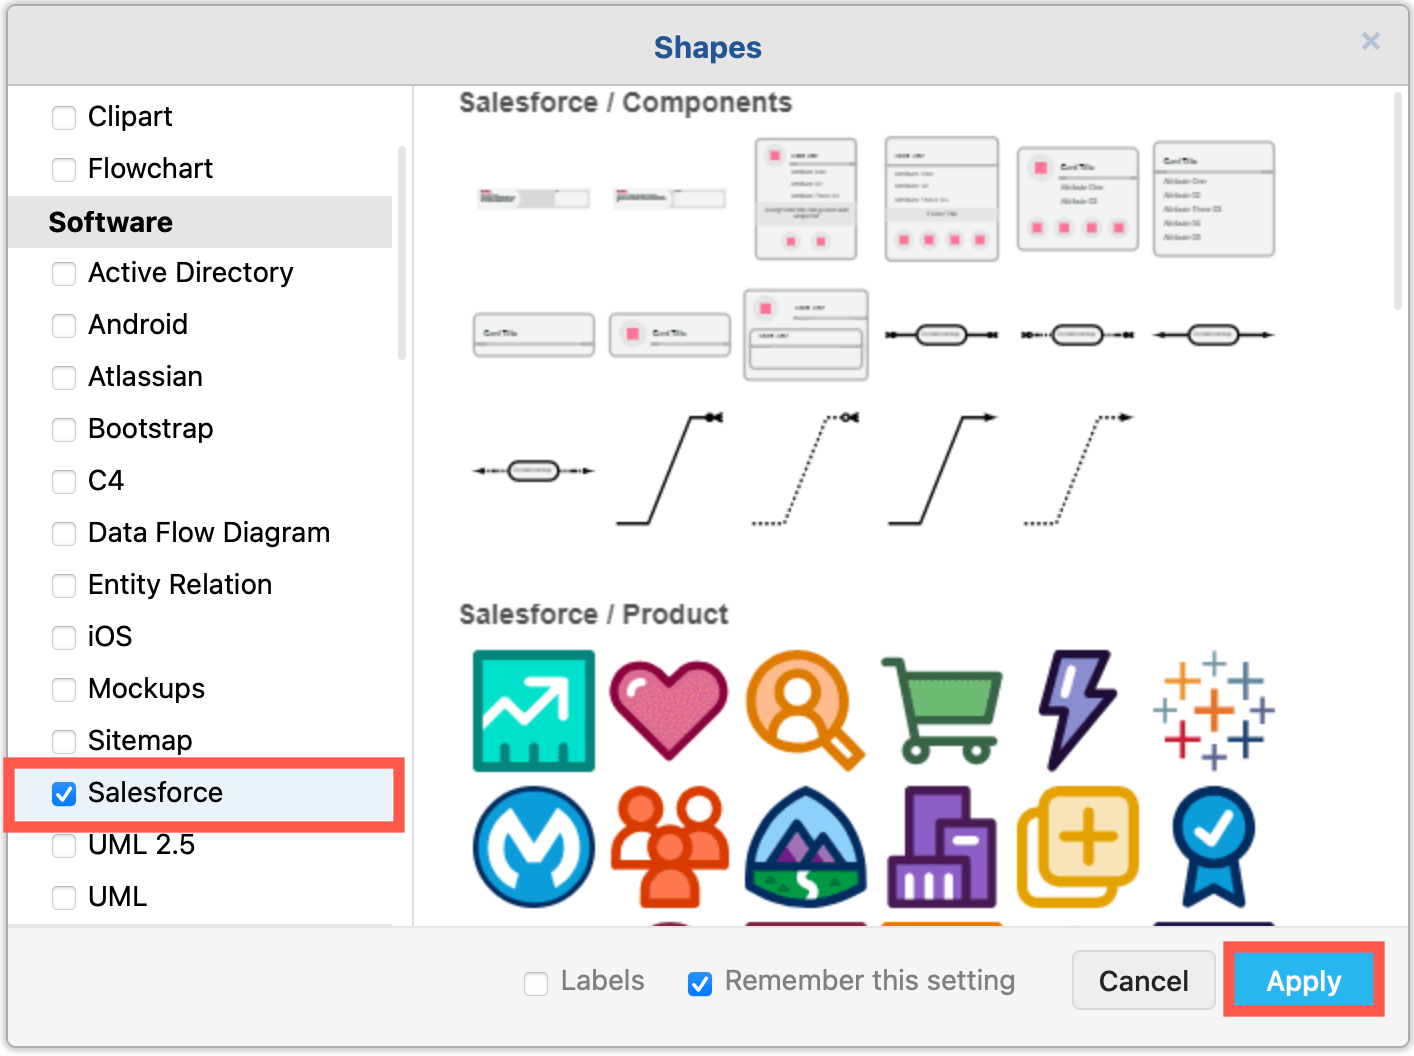
- At the bottom of the shape panel, click on More Shapes.
- In the Software category, make sure Salesforce is selected and click Apply.
Example: Salesforce diagrams for a large company
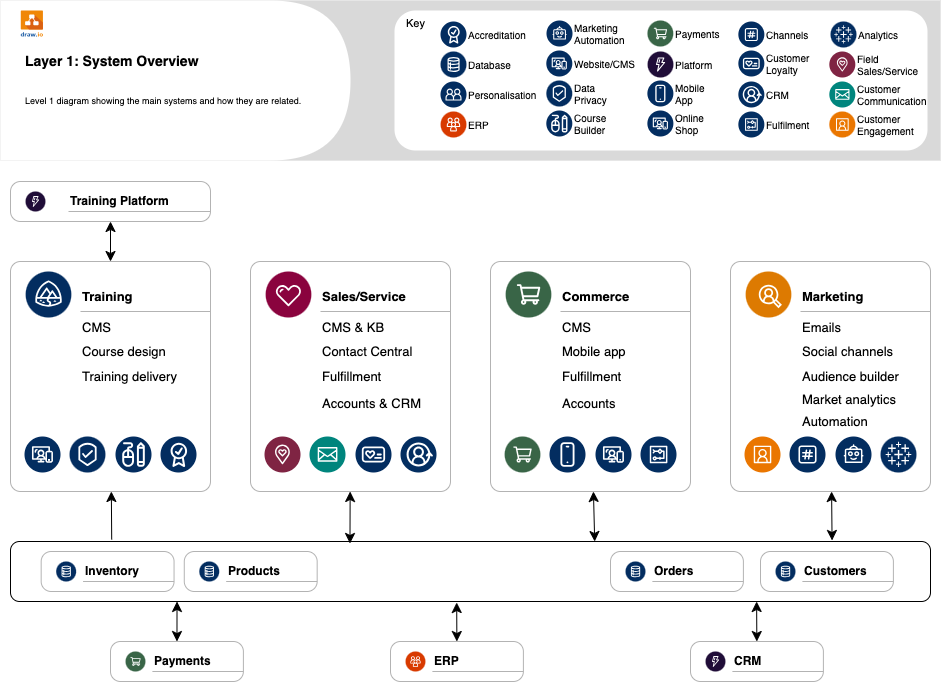
Salesforce documentation and implementation diagrams are tightly related to C4 models in that they are separated into four levels of detail.
In this example, the diagrams document a company that has several major teams - product development, sales, delivery and support; training course design, scheduling and delivery; as well as a robust marketing team.
Level 1 System Overview
An overview diagram visualises the entire system or solution (the big picture or system overview as above) showing how the subsystems relate to each other.
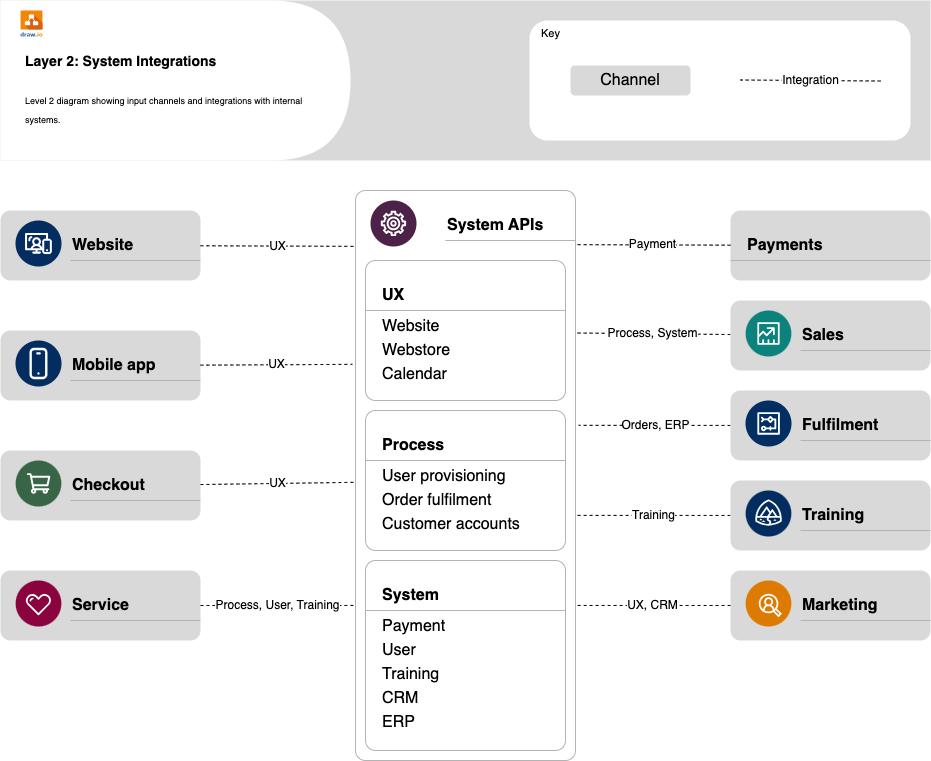
Level 2 System Integrations
A level 2 Salesforce diagram visualises a subsystem or related set of systems that form one piece of the whole solution.
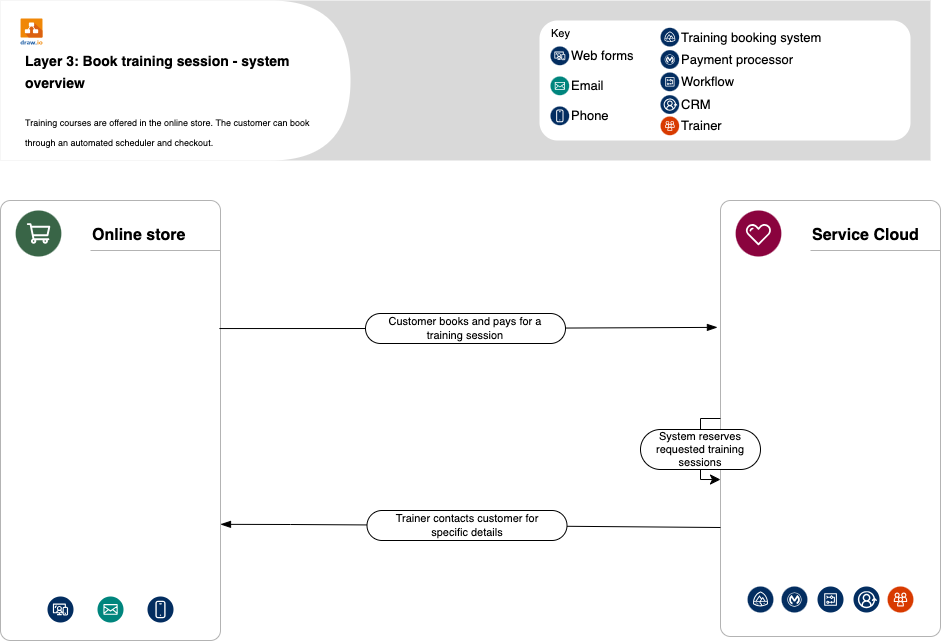
Level 3 Interaction Overview
This process or interaction view shows only the systems involved and the big process steps in the diagram.
Level 4 Detailed Process Flows
Specific process steps and detailed data structures are included in these 'double click' diagrams.
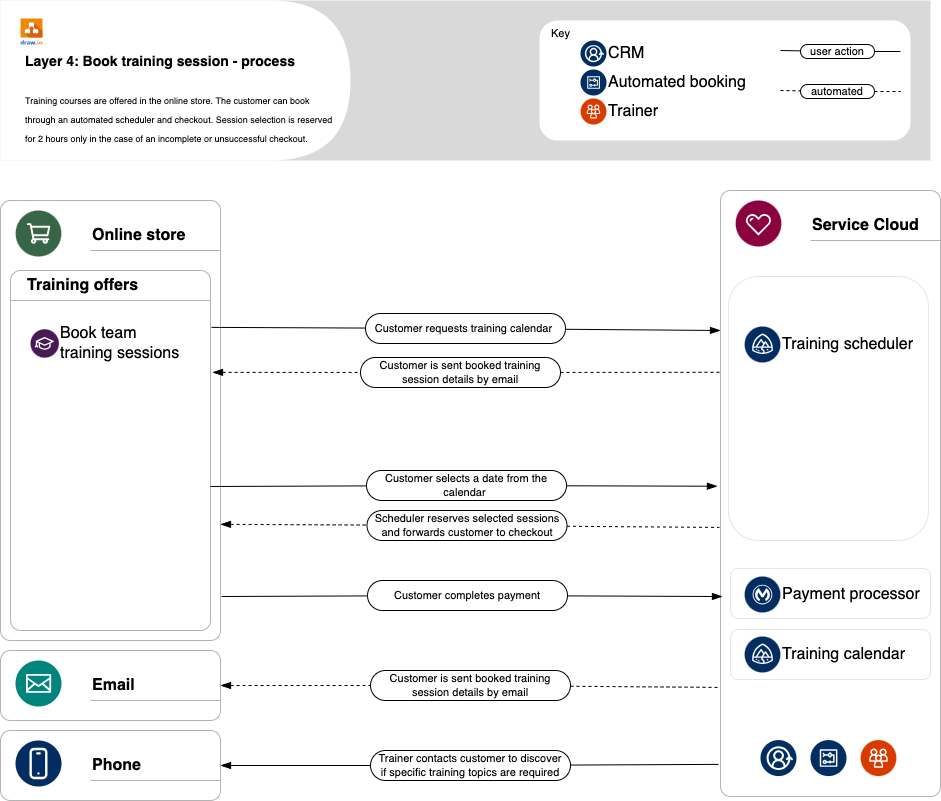
Tip: These diagrams follow the Salesforce Data Model Notation, and usually include a diagram key, as well as a diagram title and short description.
There is some overlap between level 3 and level 4 diagrams, as you can see in the example (open this in the draw.io viewer) - however, level 4 always has the highest level of detail of process steps or data structures.
Diagrams in your system documentation platform
There are many draw.io integrations that allow you to store and embed diagrams wherever you document your system and manage projects, including Atlassian Confluence or Jira, Notion, GitHub and GitLab, Google Workplace, Microsoft Office 365 and many others.
Learn more about draw.io integrations
Use Salesforce shapes in other diagrams
Salesforce shapes are useful in many types of diagrams, including capability maps, business models, customer journey models, support overview charts, asset management diagrams, service and system roadmaps, and many more.
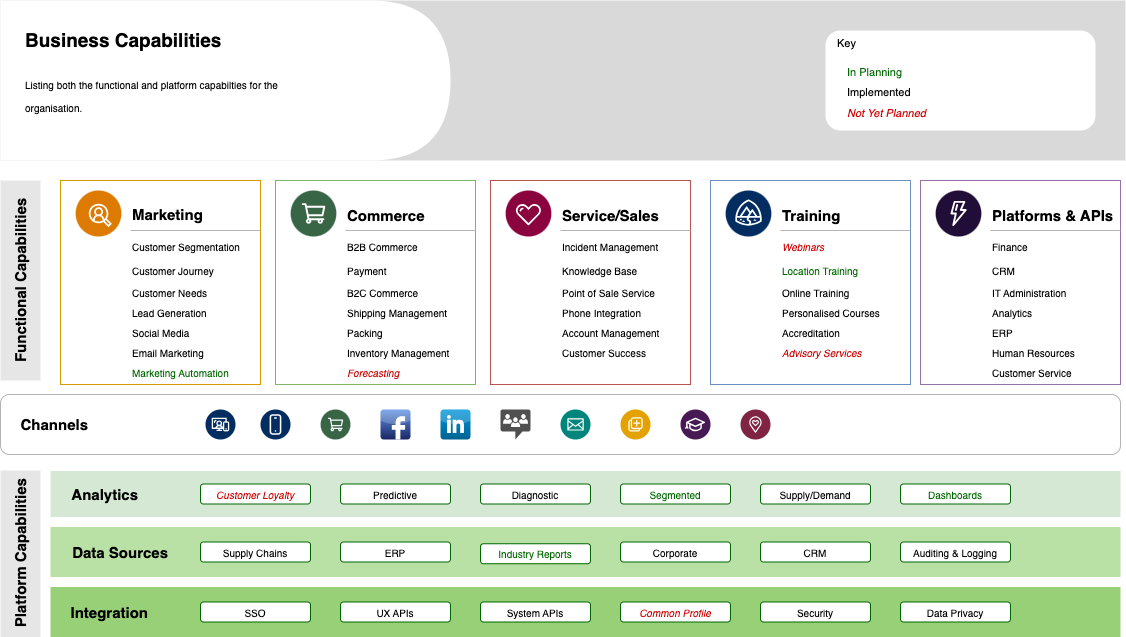
A capability diagram using Salesforce shapes for a consistent visual feel
draw.io has many other infrastructure and business modelling shape libraries in the Software, Networking and Business categories, including up-to-date AWS, Azure and GCP libraries, as well as logos of common online and service platforms.
You can search for the logo or shape in the shapes panel, or open one of the publicly available custom draw.io shape libraries.