Cross-functional flowcharts
Cross-functional flowcharts are drawn using container tables. These diagrams use both horizontal and vertical swimlanes, allowing you to add more contextual information and improve cross-team communication. In draw.io, cross-functional flowchart shapes are an advanced form of table, where you can add and remove columns and rows (swimlanes) using the Arrange tab of the format panel on the right.
Just as with swimlane diagrams, there are templates under the Basic and Flowcharts template categories to give you an idea of how cross-functional flowcharts work. The basic cross-functional flowchart template organises the steps into two actors, and notes the state of one of the actors as the process is stepped through.
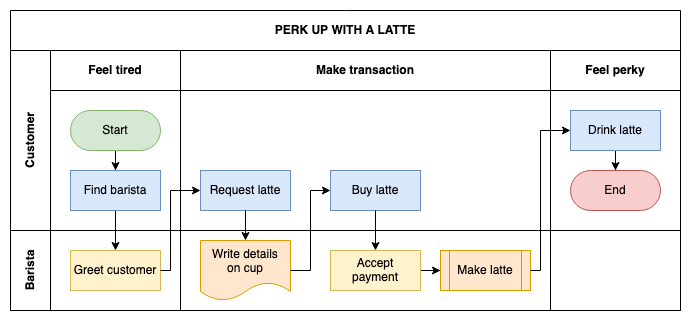
Open an uncoloured version as a template in our diagram viewer
The basic cross-functional table shape is in the Misc shape library. Alternatively, you can add your own empty cross-functional table shape using the table tool in draw.io.
Add a container table
Create a table with horizontal and vertical swimlanes using the Table tool in the toolbar.
- With nothing selected in your diagram, click on the Table tool in the toolbar.
- Select the Container checkbox, or hold down the
Ctrl/Cmdkey while you select a table with the number of rows and columns you need. Click to add the table with cross-functional swimlanes to the drawing canvas.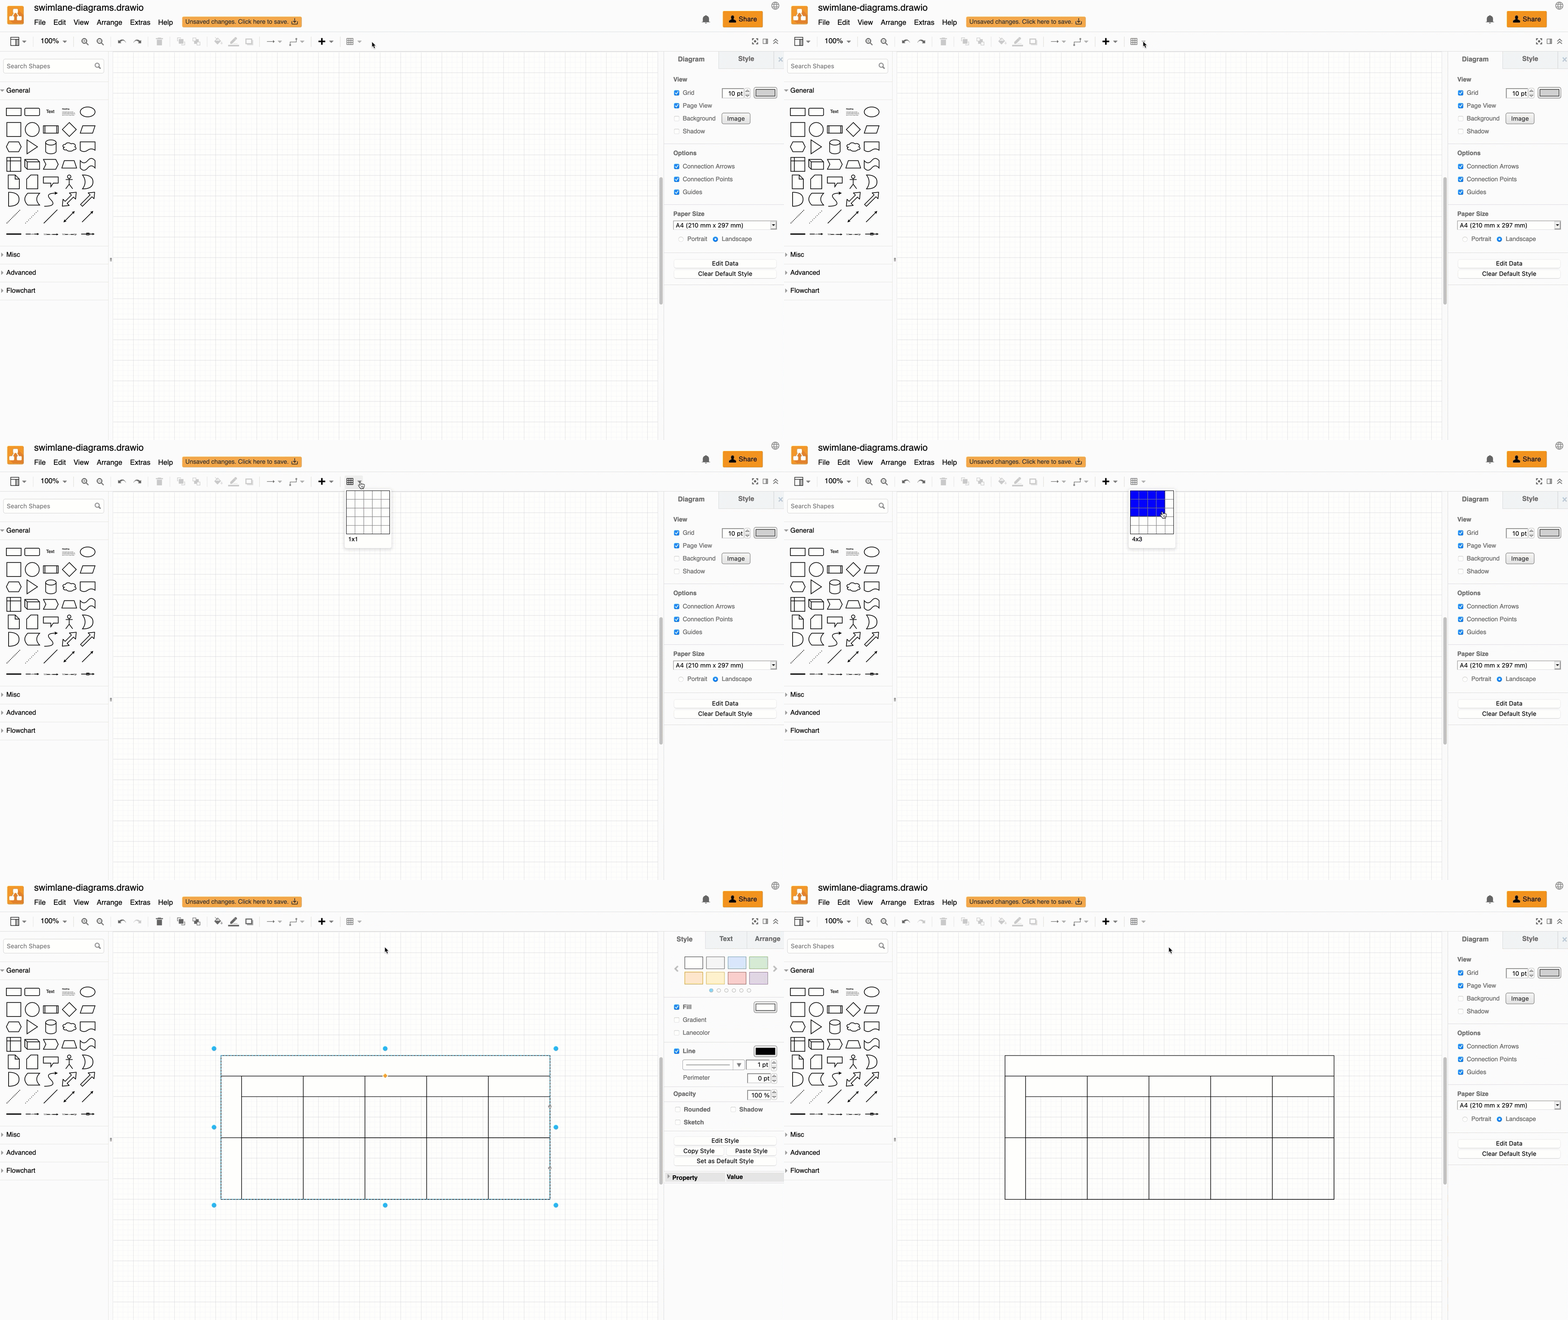
Tip: To resize all rows or columns at once and make them a consistent size, hold down Shift as you resize one of rows or columns.
Draw the flowchart in the table
As the cells in a cross-functional table function as container shapes, you can add shapes to them. Build your flowchart by placing the steps in their cells and then joining them with connectors.
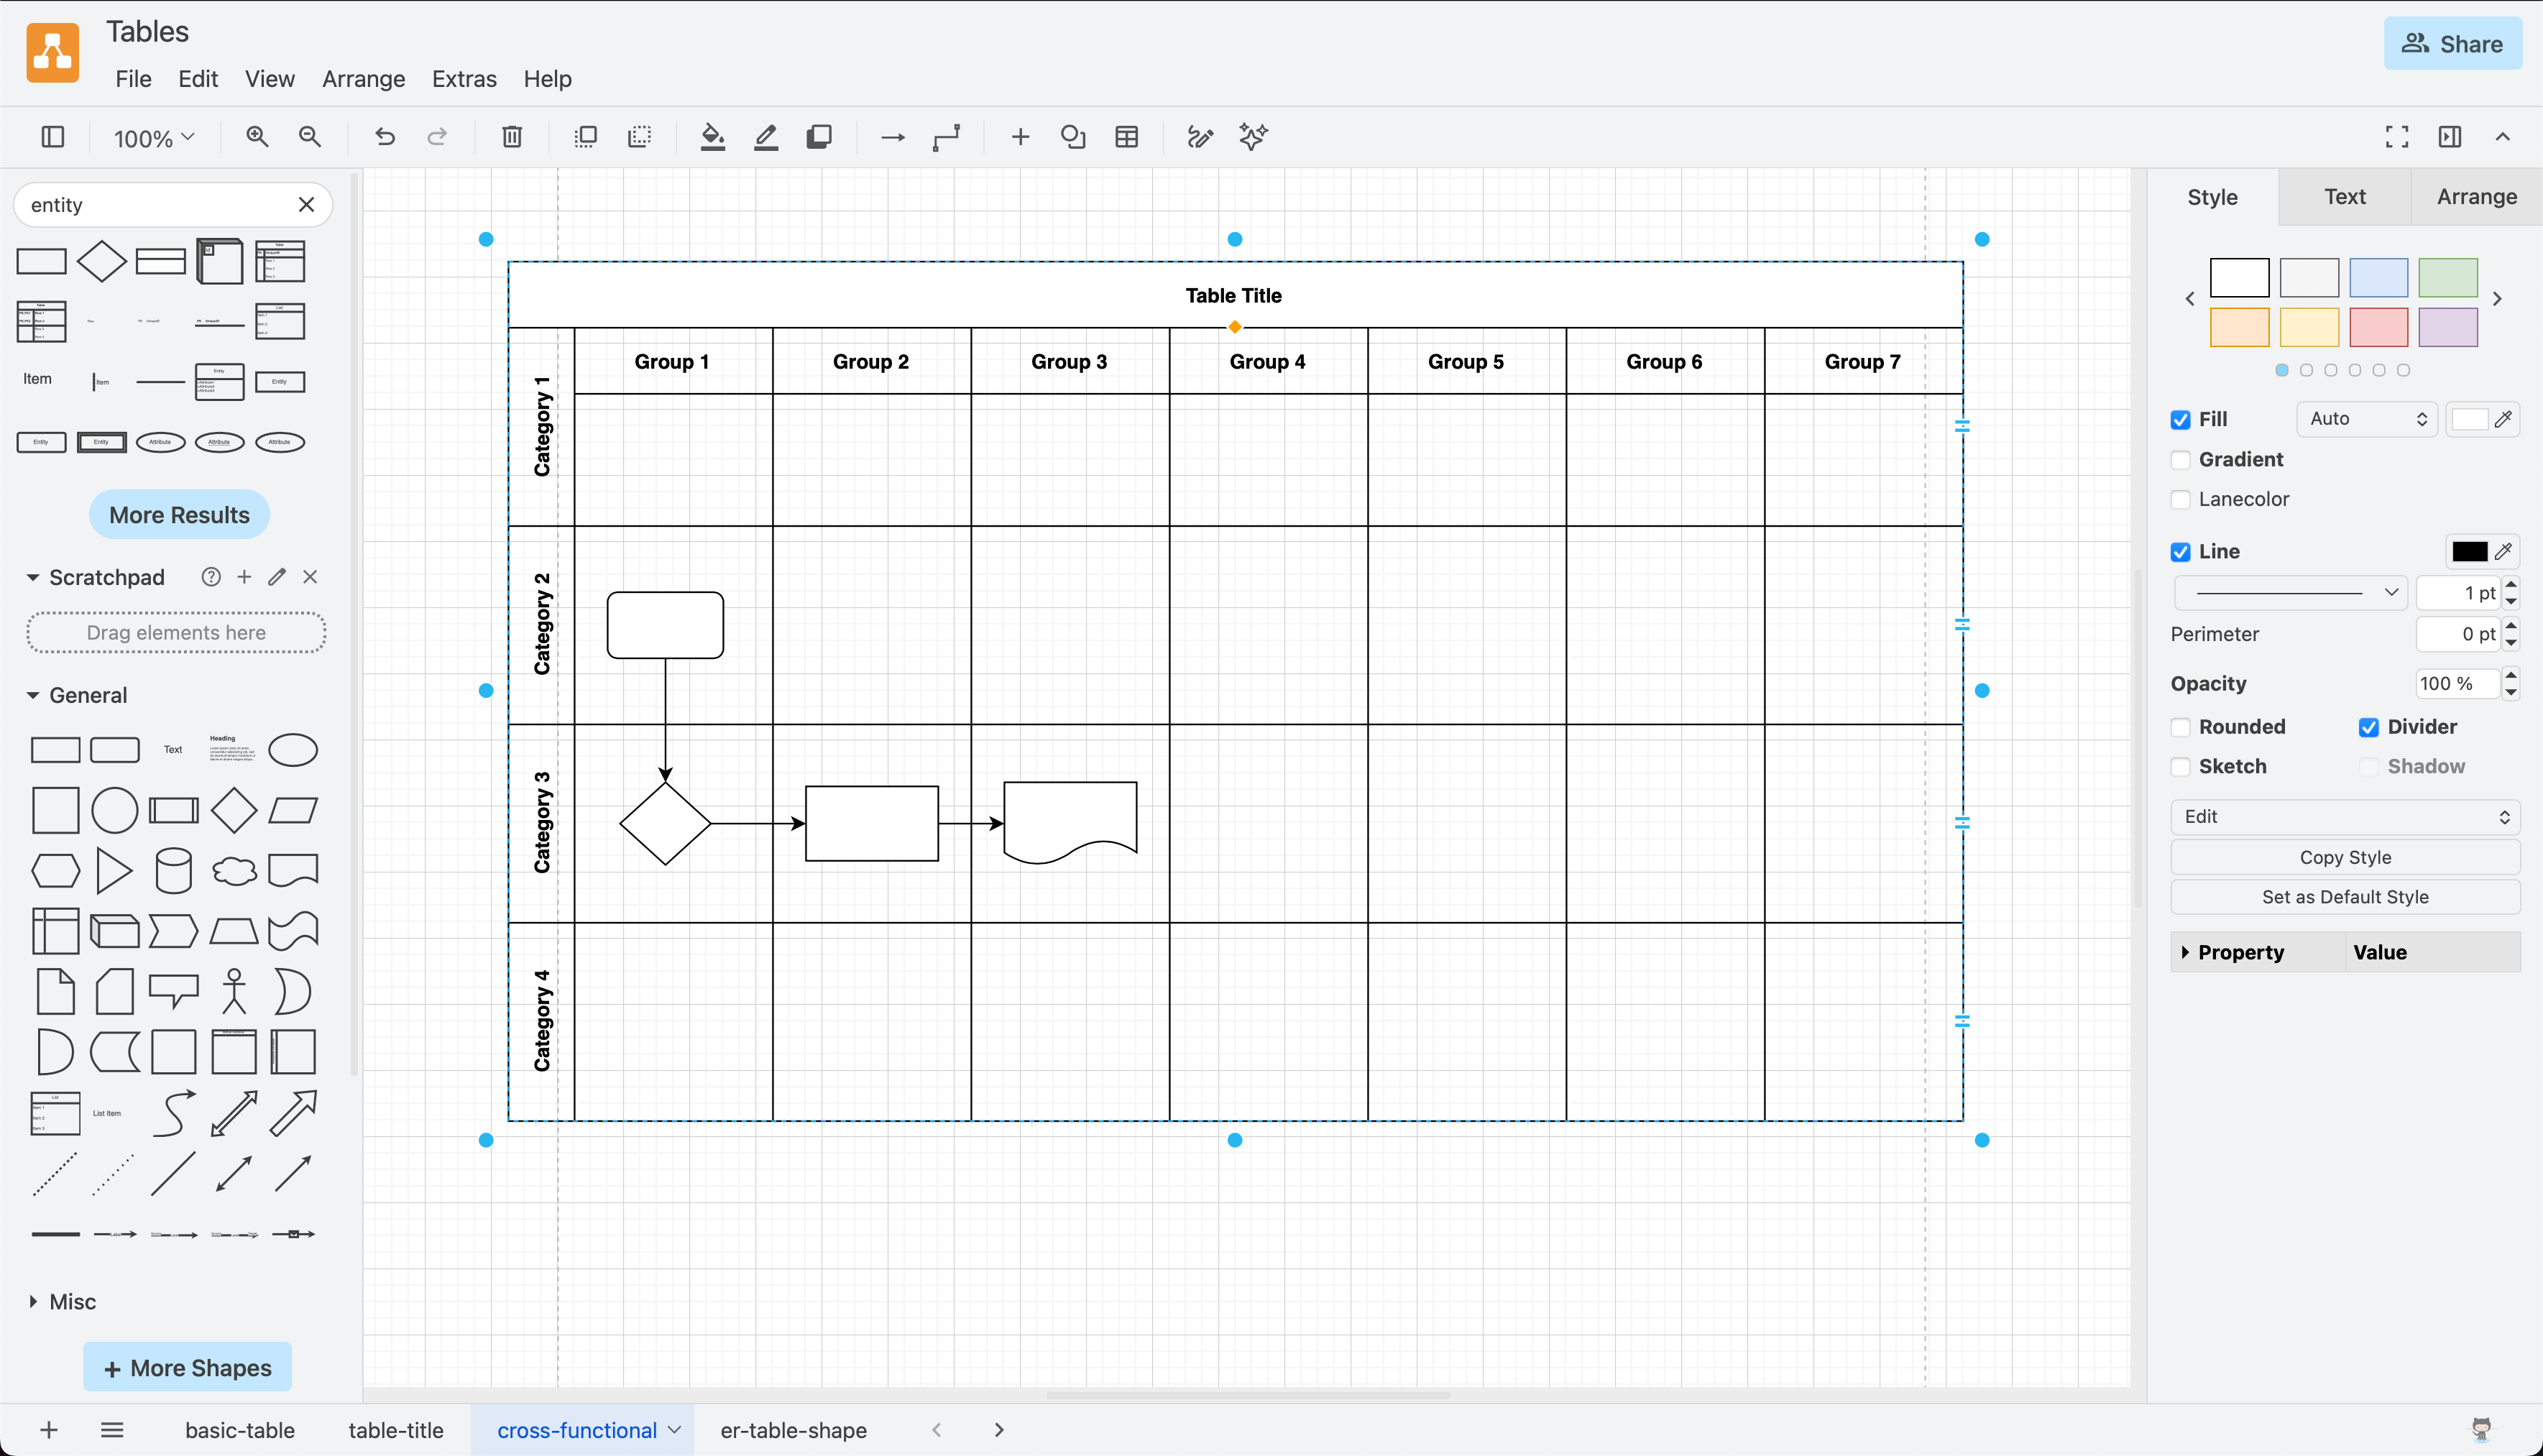
Add shapes: Drag shapes from the shape library or toolbar into a table cell when the outline of the cell is highlighted. You may need to drag the column and row borders to fit the new shape neatly, or resize the shape.
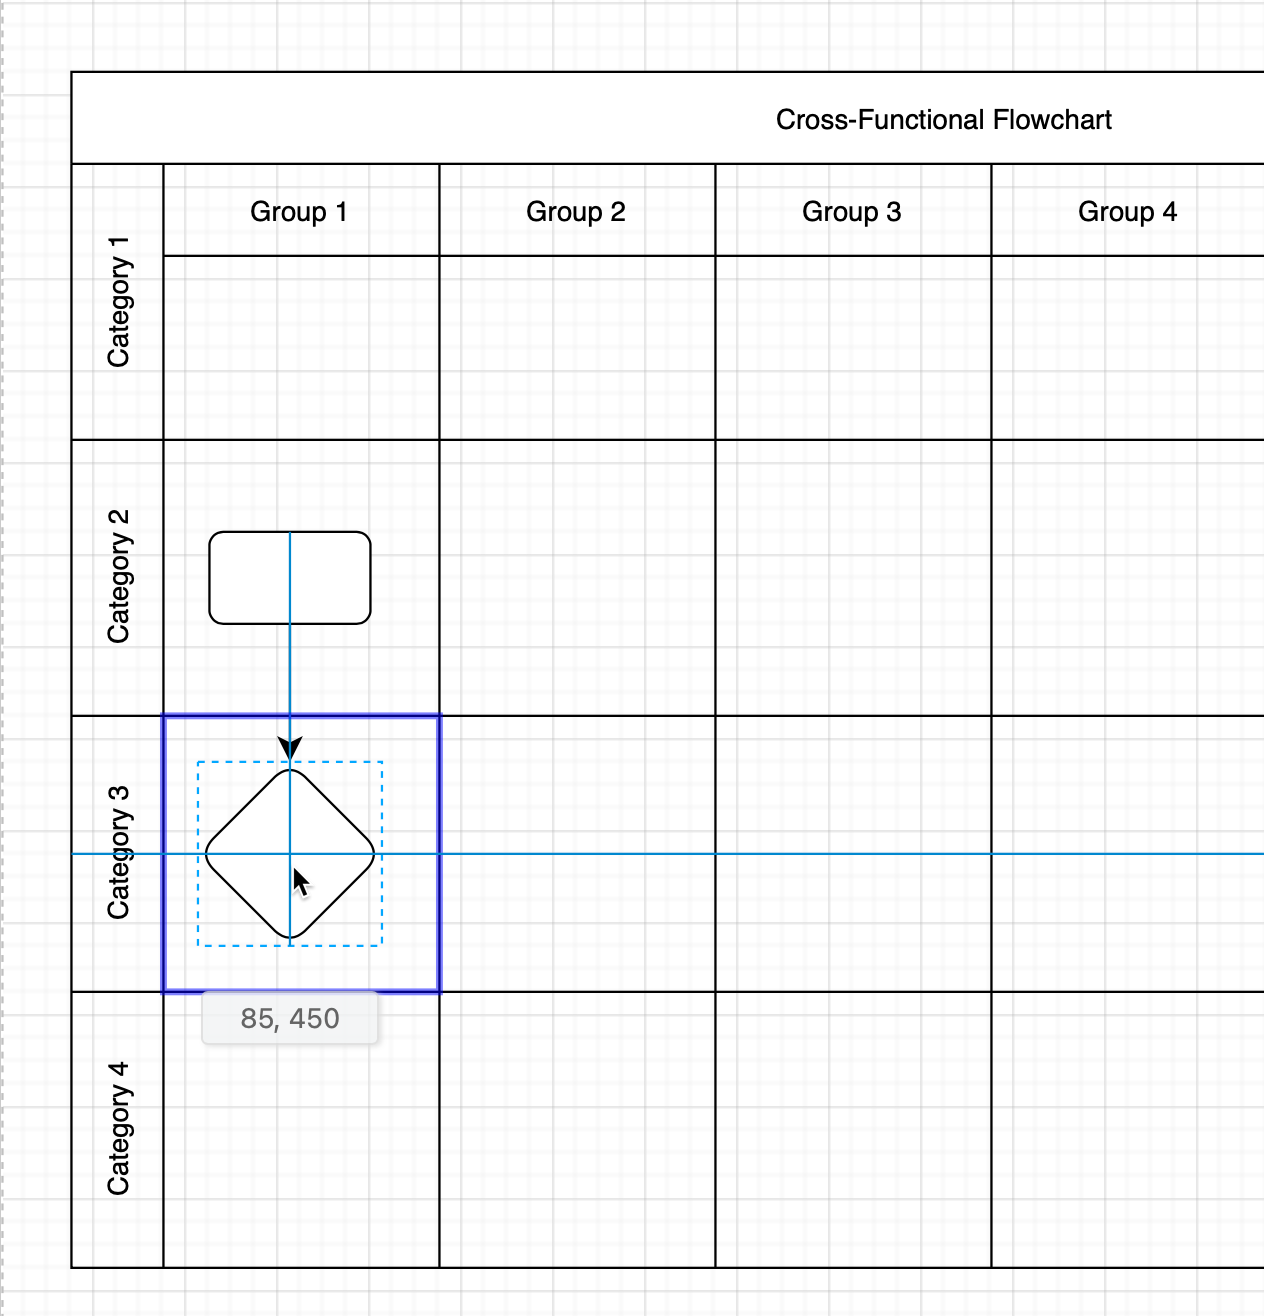
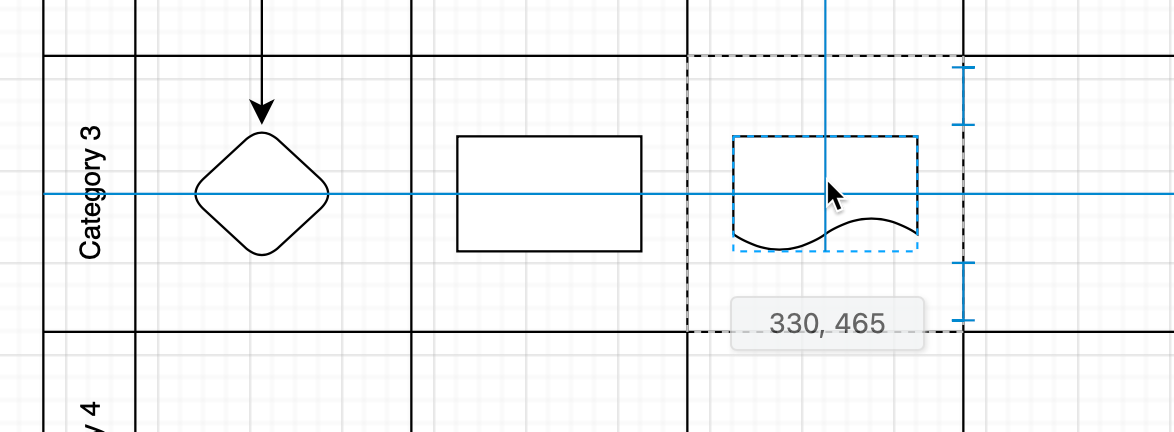
Align neatly using guides: Use the blue guide lines that appear to help you space and align shapes inside the table cells or in relation to other shapes.
Connect shapes: Hover over a shape, drag a connector from one of the direction arrows or fixed connection points, and drop it on a target shape to connect them.
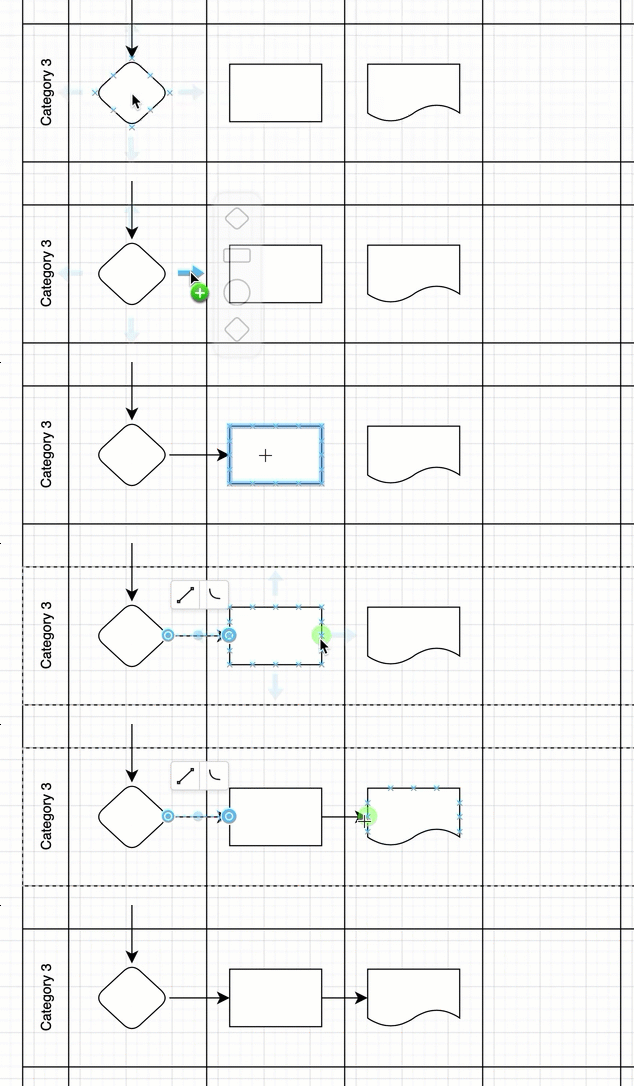
Shapes added to container cells will move and be resized along with the entire table. If you have changed a connector's path, you may need to remove the connector waypoints to re-route the connector.
Overlap a shape and a container table
If you don't want to add a shape to the container cell inside a cross-functional table, you can overlap them with a keyboard shortcut. Hold down Alt on Windows or Option key on MacOS as you drag and drop the shape on top of the table cell.
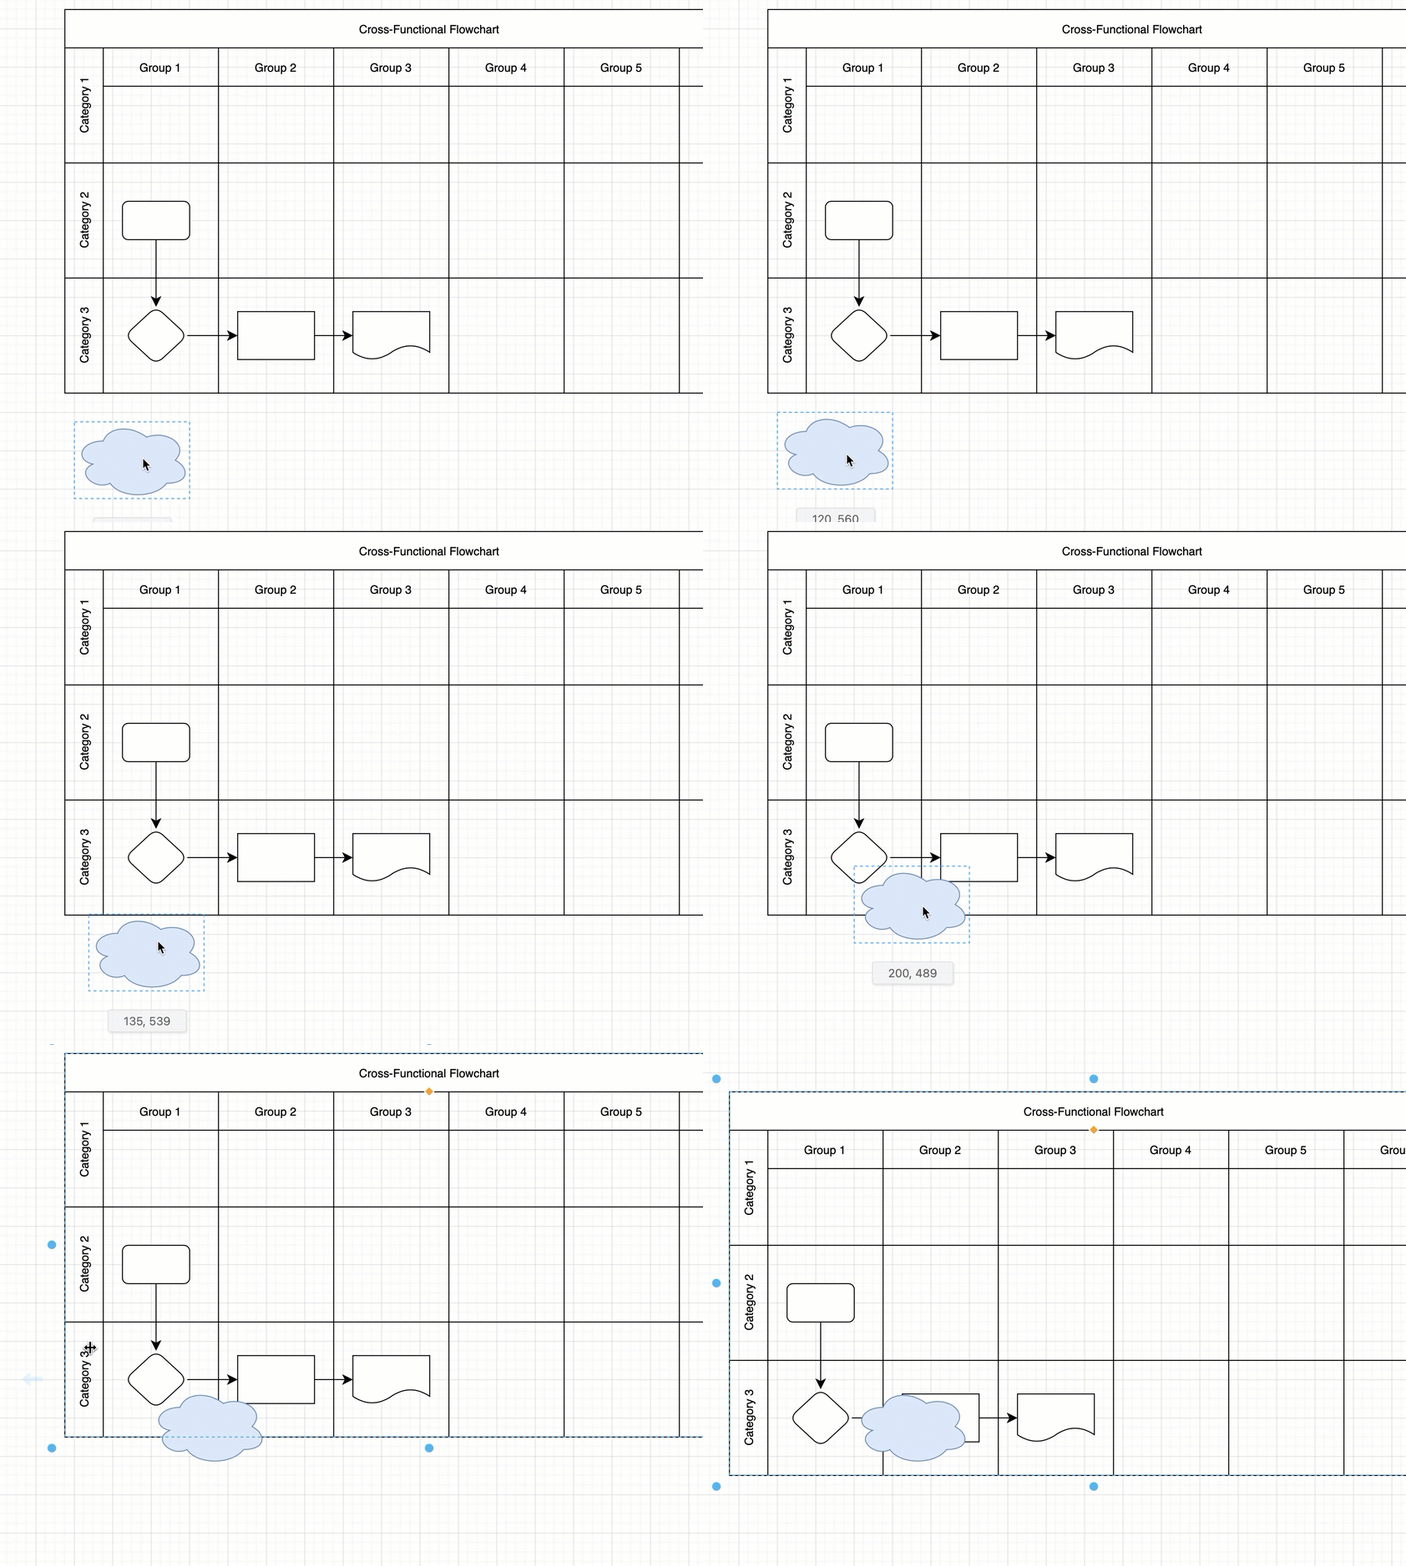
Now, when the table is moved underneath the shape, the shape will stay in position as it has not been added to any container cell.
Add labels to name your categories
- Click on the title cell of the row or column to select the table, then click again to select that cell.
- Enter the title text.
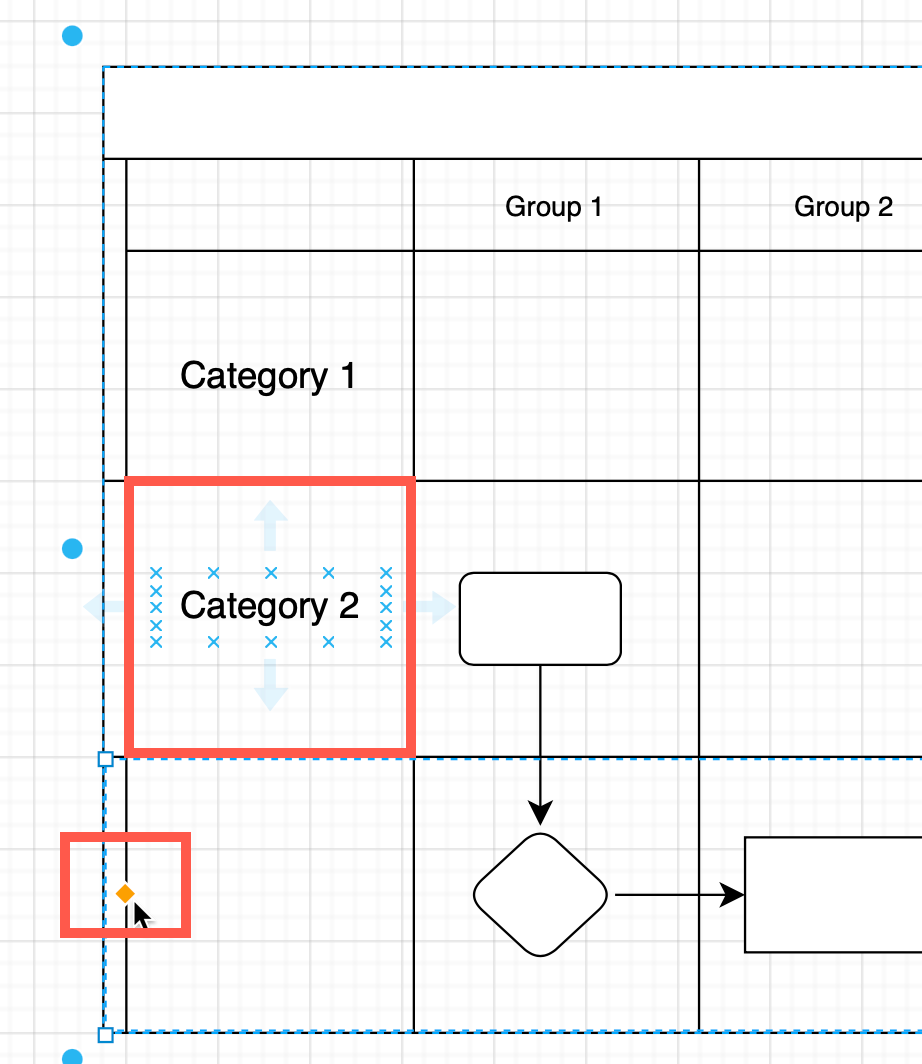
Note: The horizontal rows have labels on their side that can't be rotated. If you need the labels to be upright, drag the grab handle for the title region on one of the rows and decrease it until it disappears, then add text shapes into the first cell of each row with the row titles.
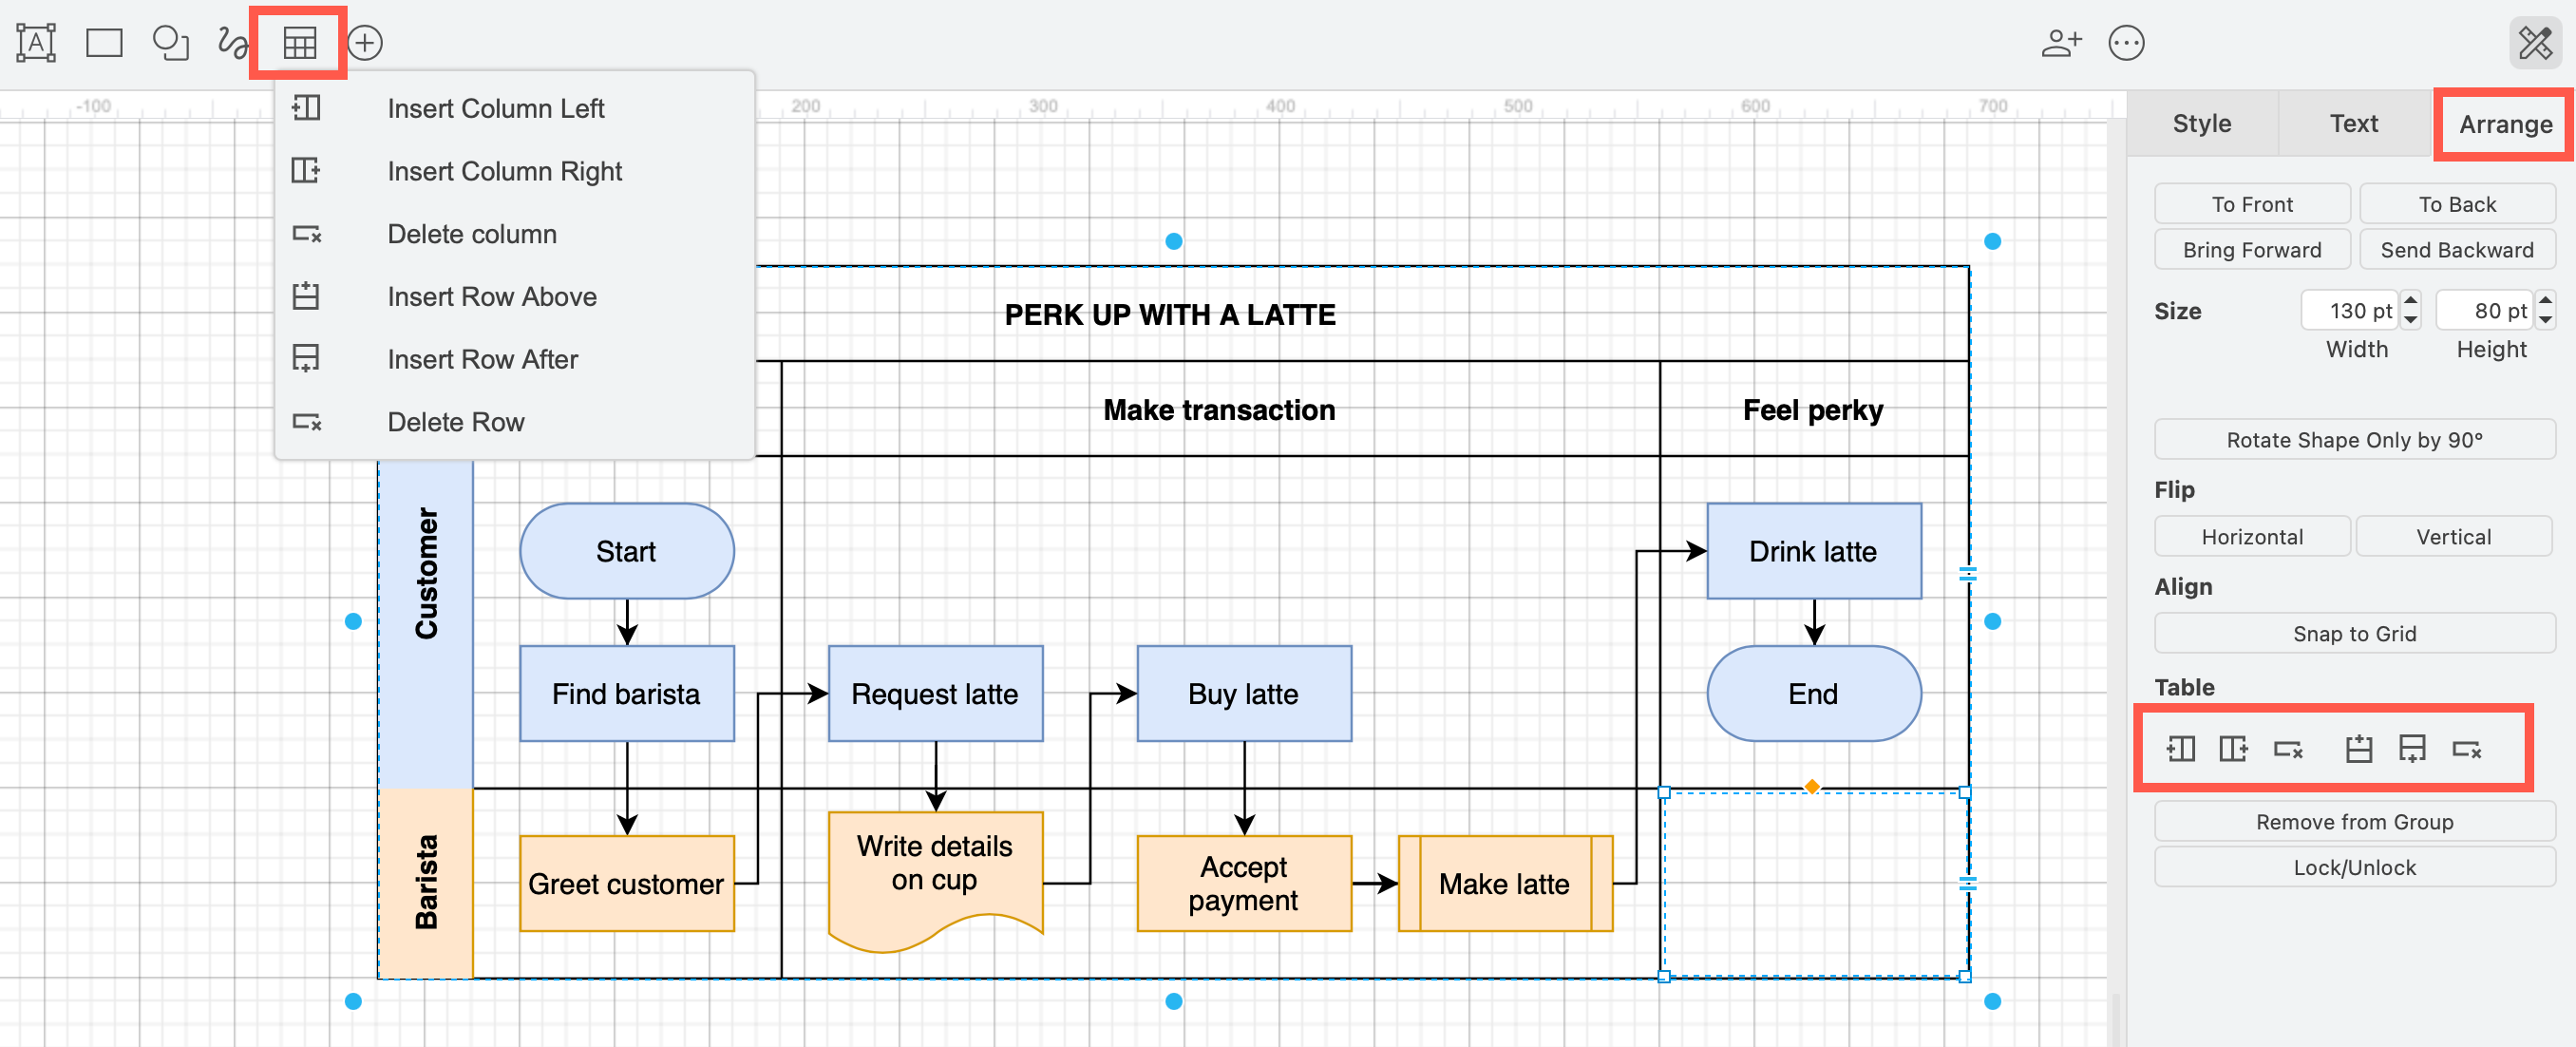
Add or delete rows or columns
Use the Arrange tab in the format panel, or the table tool in the toolbar to add and delete columns and rows.
Related
There are many more ways that container tables can be used in different types of diagrams, more than just a cross-functional flowchart.
See how to work with tables in draw.io, and speed up diagramming with keyboard shortcuts specifically for table shapes.