Diagram use cases by profession
Technical diagrams are used throughout many different professions and industries, both for internal documentation and to help customers or provide training. Many of these fields have their own specific types of technical diagrams.
All technical diagrams on this page were created in draw.io.
Technical diagrams by profession
Business analysts
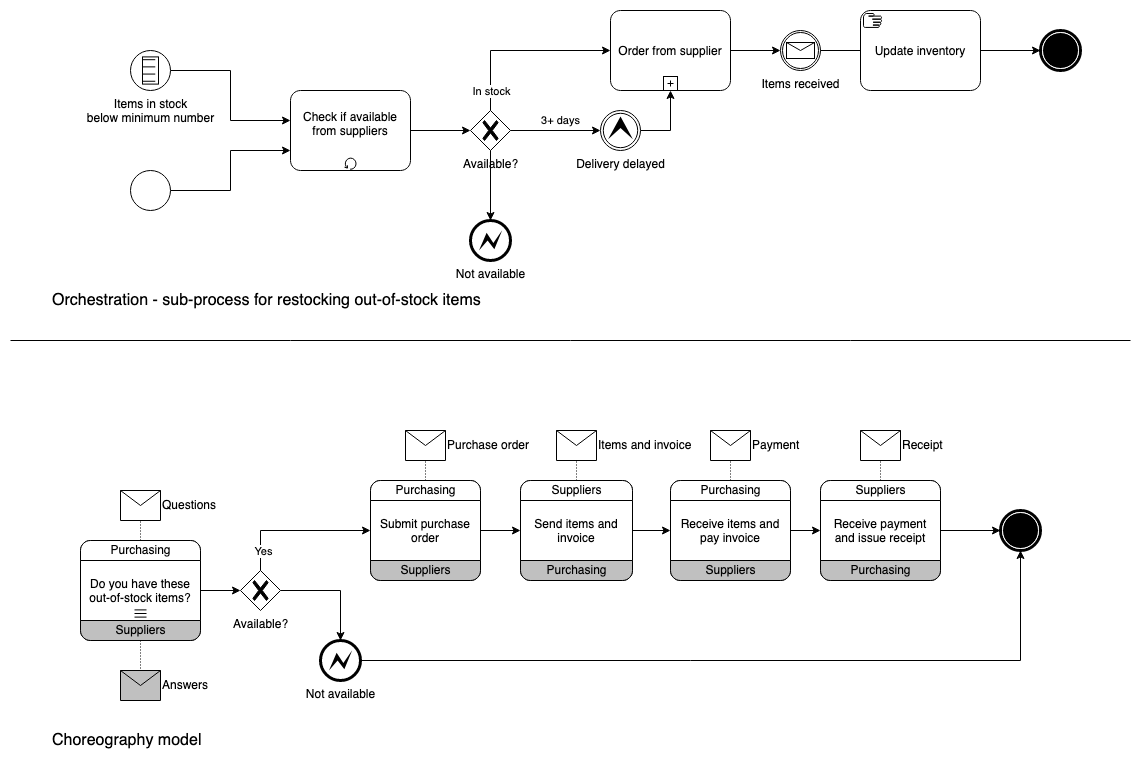
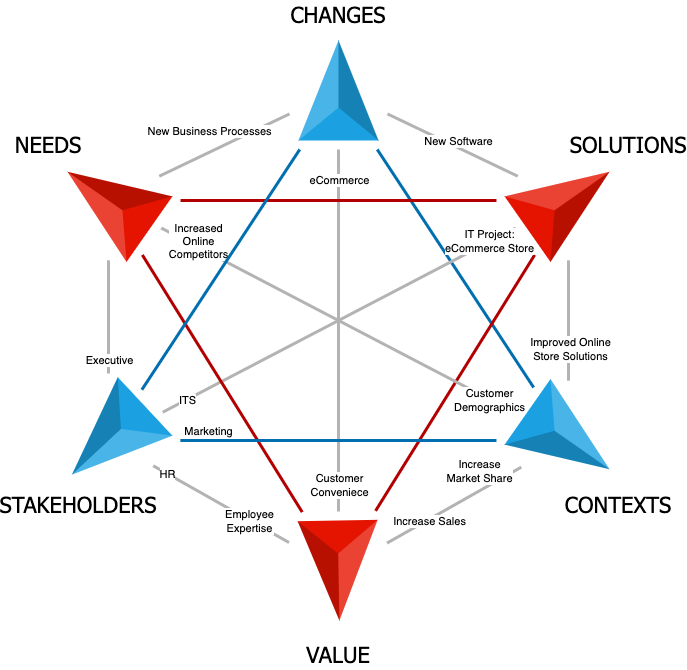
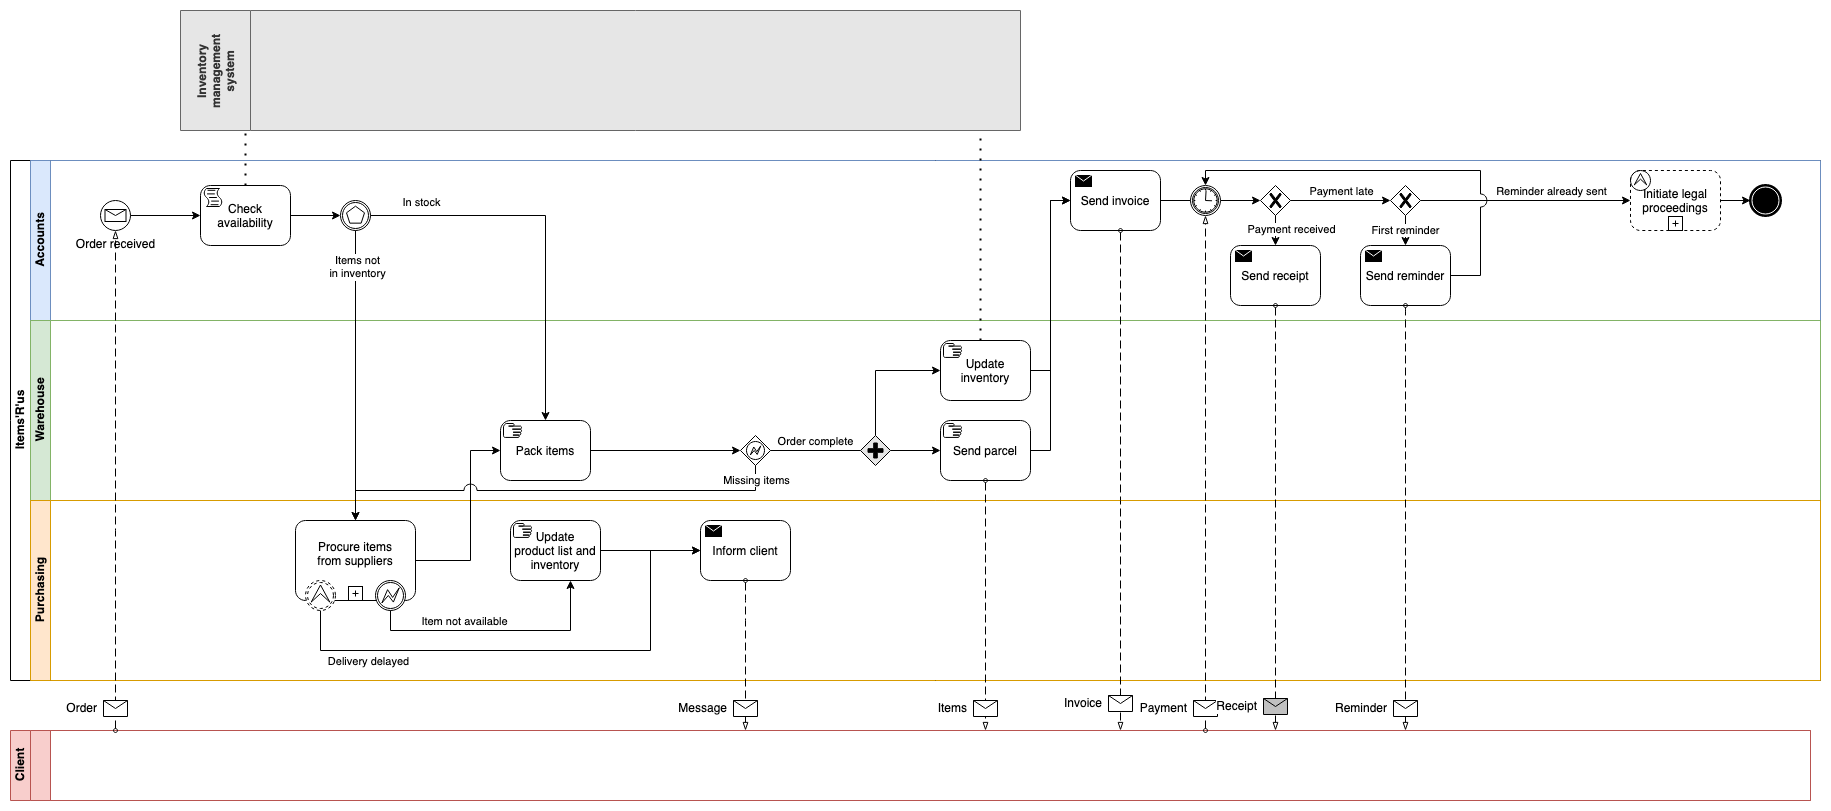
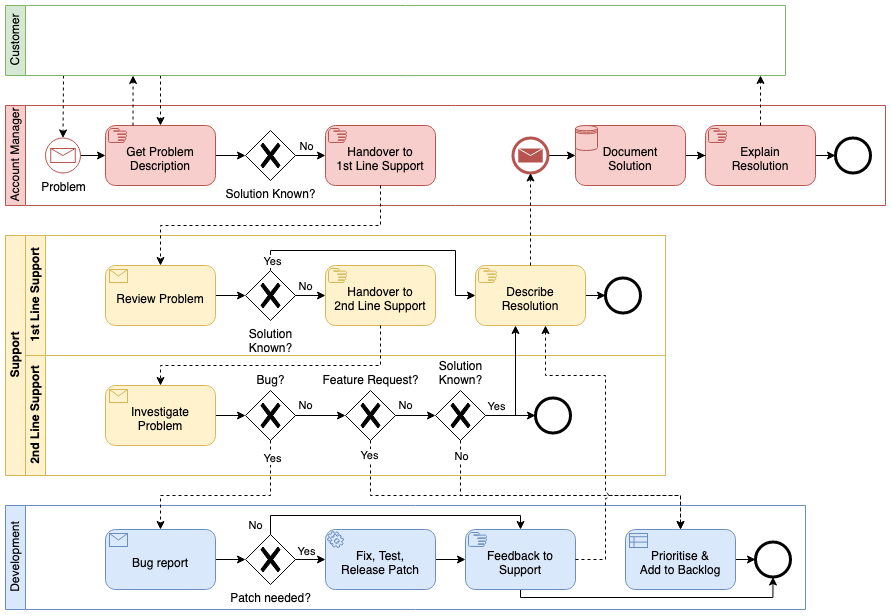
Business analysts draw flowcharts and BPMN diagrams, system context diagrams, business models, state charts, concept models, and use case digrams. Business analysts make use of data to evaluate and improve processes and systems, visualising them in diagrams helps stakeholders sign off on projects and changes to their enterprises.
Data analysts
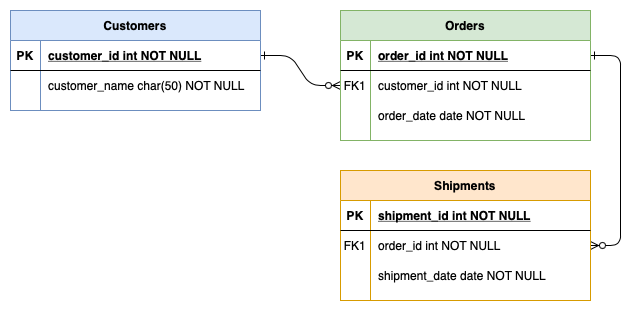
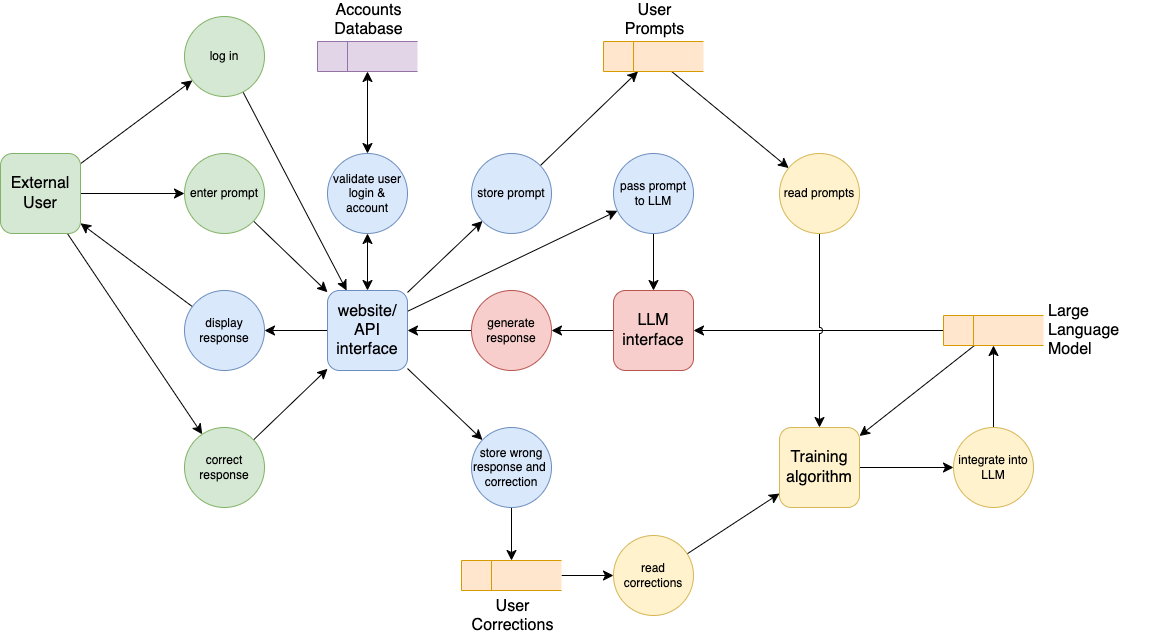
For data analysis, these professionals draw entity relationship and schema diagrams, data flow diagrams, decision trees for sorting data, and IDEF1X graphical information models. While the analysis of large sets of data typically produces charts and graphs, setting up the data repositories, the data schemes and relational database structures requires data analysts to draw many other technical diagrams.
IT support and cloud architects
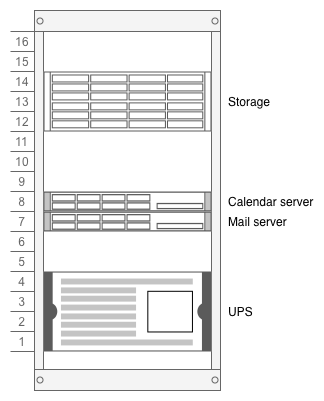
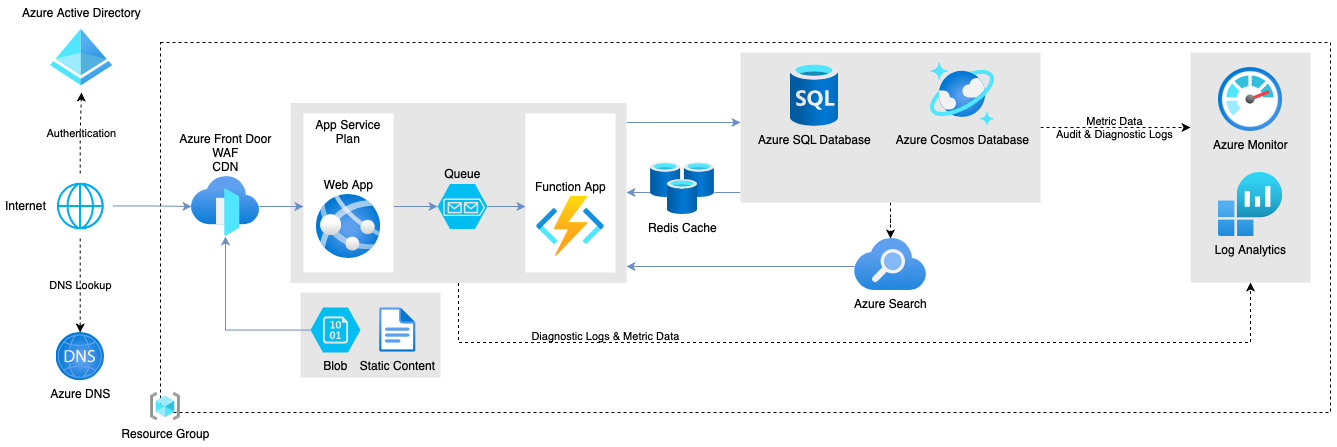
These professionals draw system models, deployment diagrams, rack diagrams, user flows, swimlane diagrams, data flow models, and cloud and network architectures. There is a lot of overlap between IT support and software development and business analysis, and the drawn architectures need to take into account soft business processes, user flows, and technical limitations of both the hardware and software.
Education and research professionals
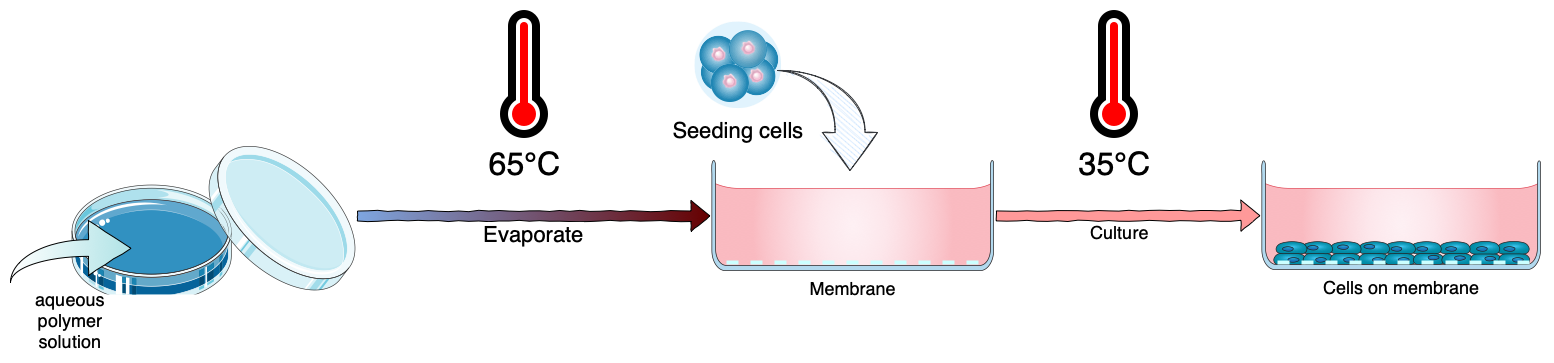
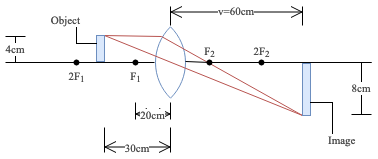
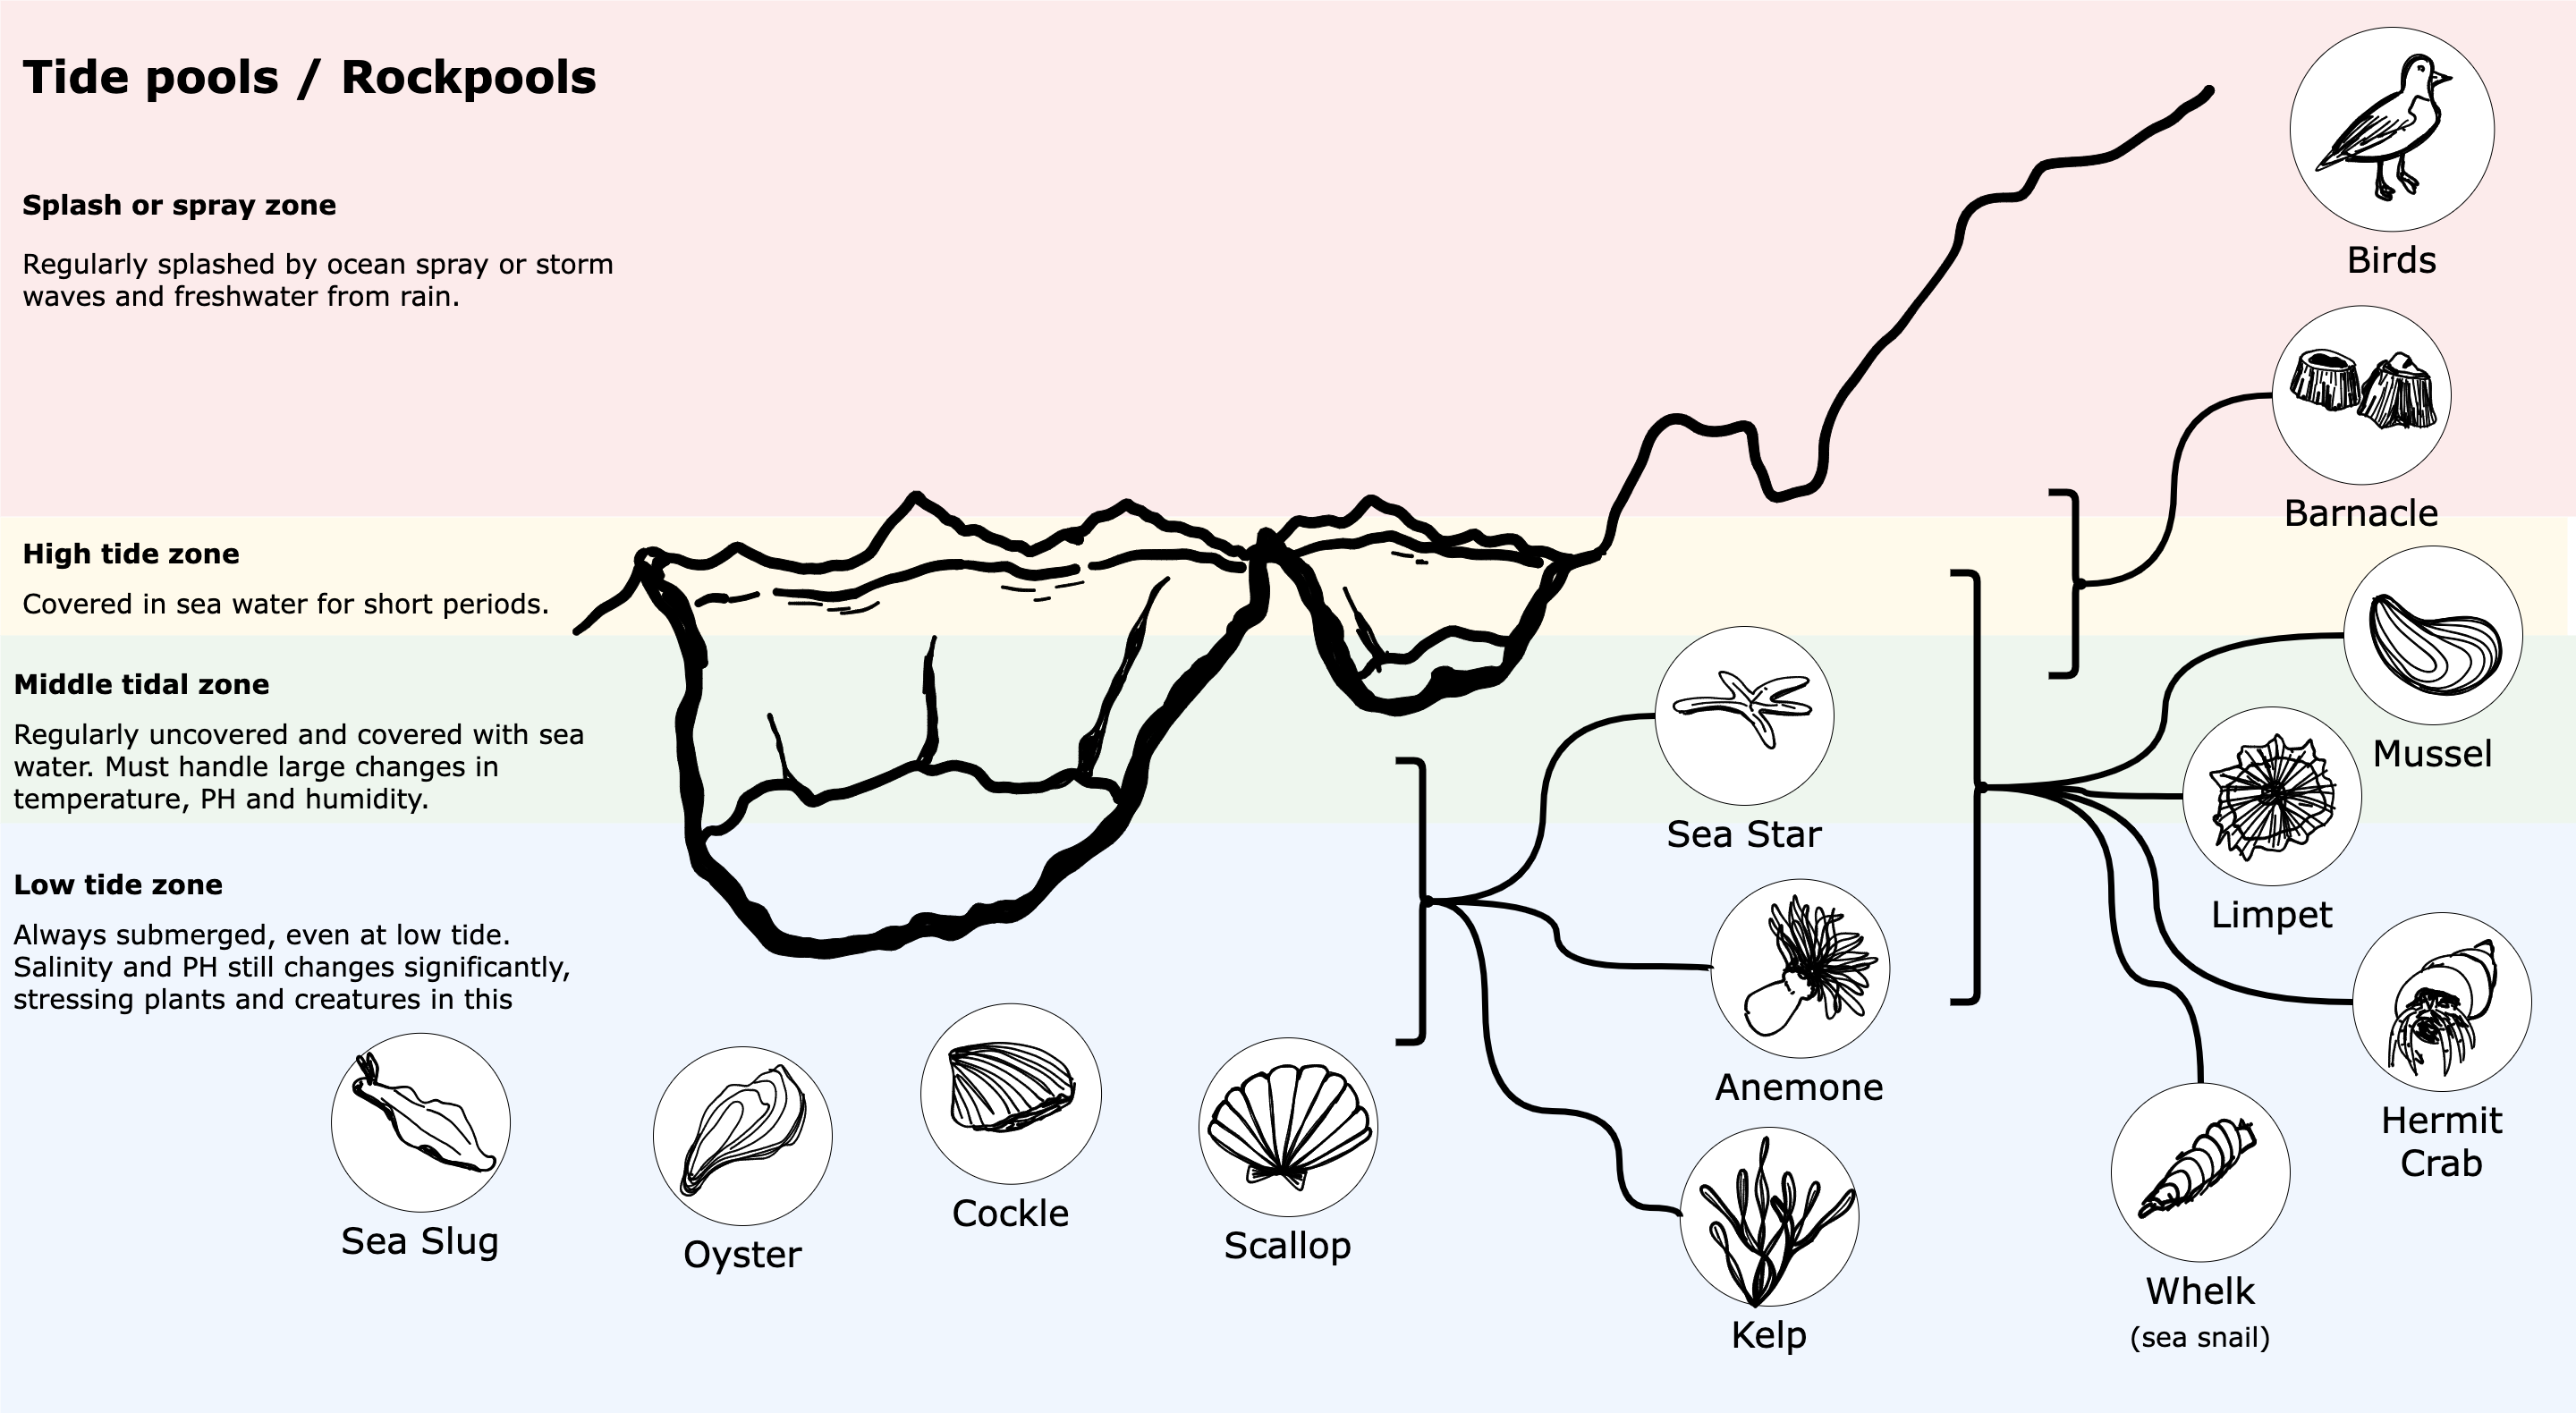
Teachers, researchers and writers draw labelled technical illustrations and photos, dendrograms, mathematical diagrams, and charts and graphs. The Bioicons shape library integration lets you create diagrams for chemistry and biology courses, process flows, and presentations easily. With standard shapes and math typesetting, you can visualise scientific concepts quickly.
Electrical, chemistry, industrial and process control engineers
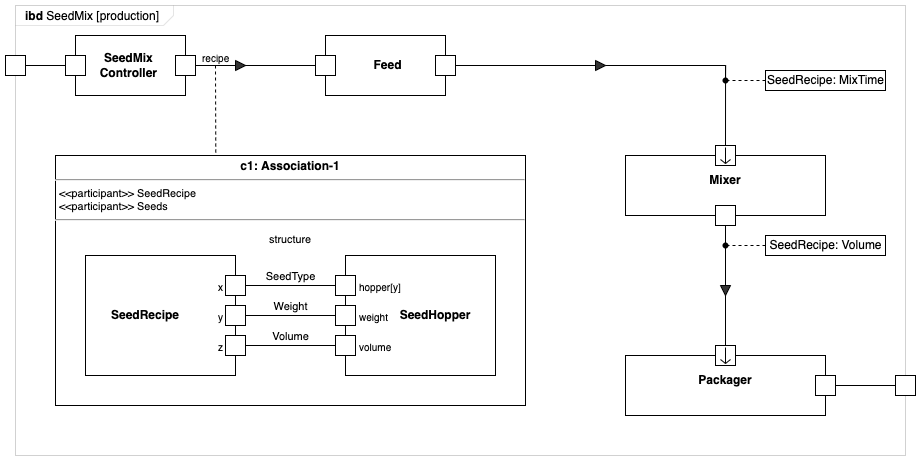
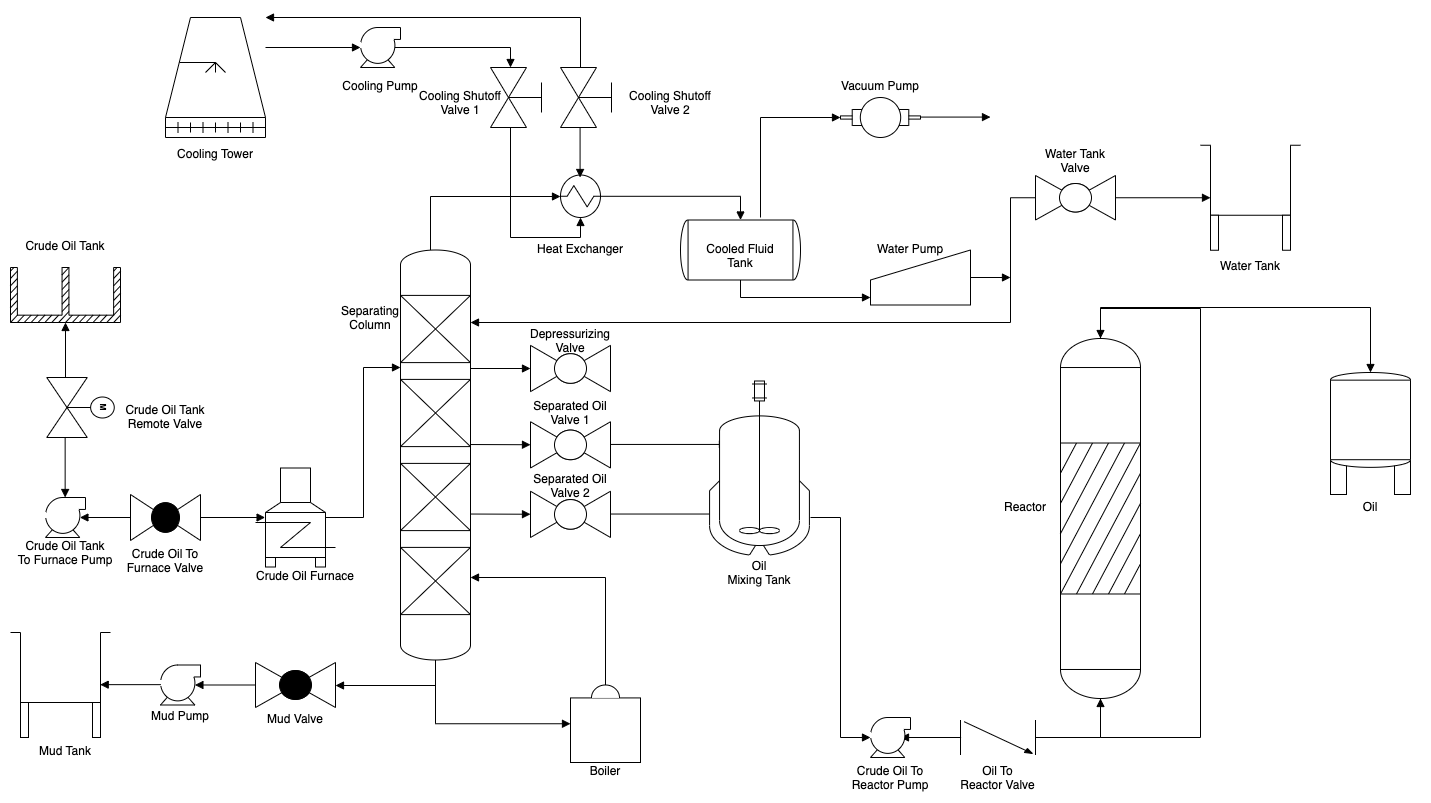
These engineers draw block diagrams, event-driven process chains, catalytic cycles, process flows, IDEF0 manufacturing models, and timing diagrams.
Human relations and accounts
HR and accounting professionals draw organisation charts, mindmaps, timelines, floorplans, responsibility diagrams, visual processes and workflows, and many other less technical diagrams for presentations and documentation.
Marketing and event planners
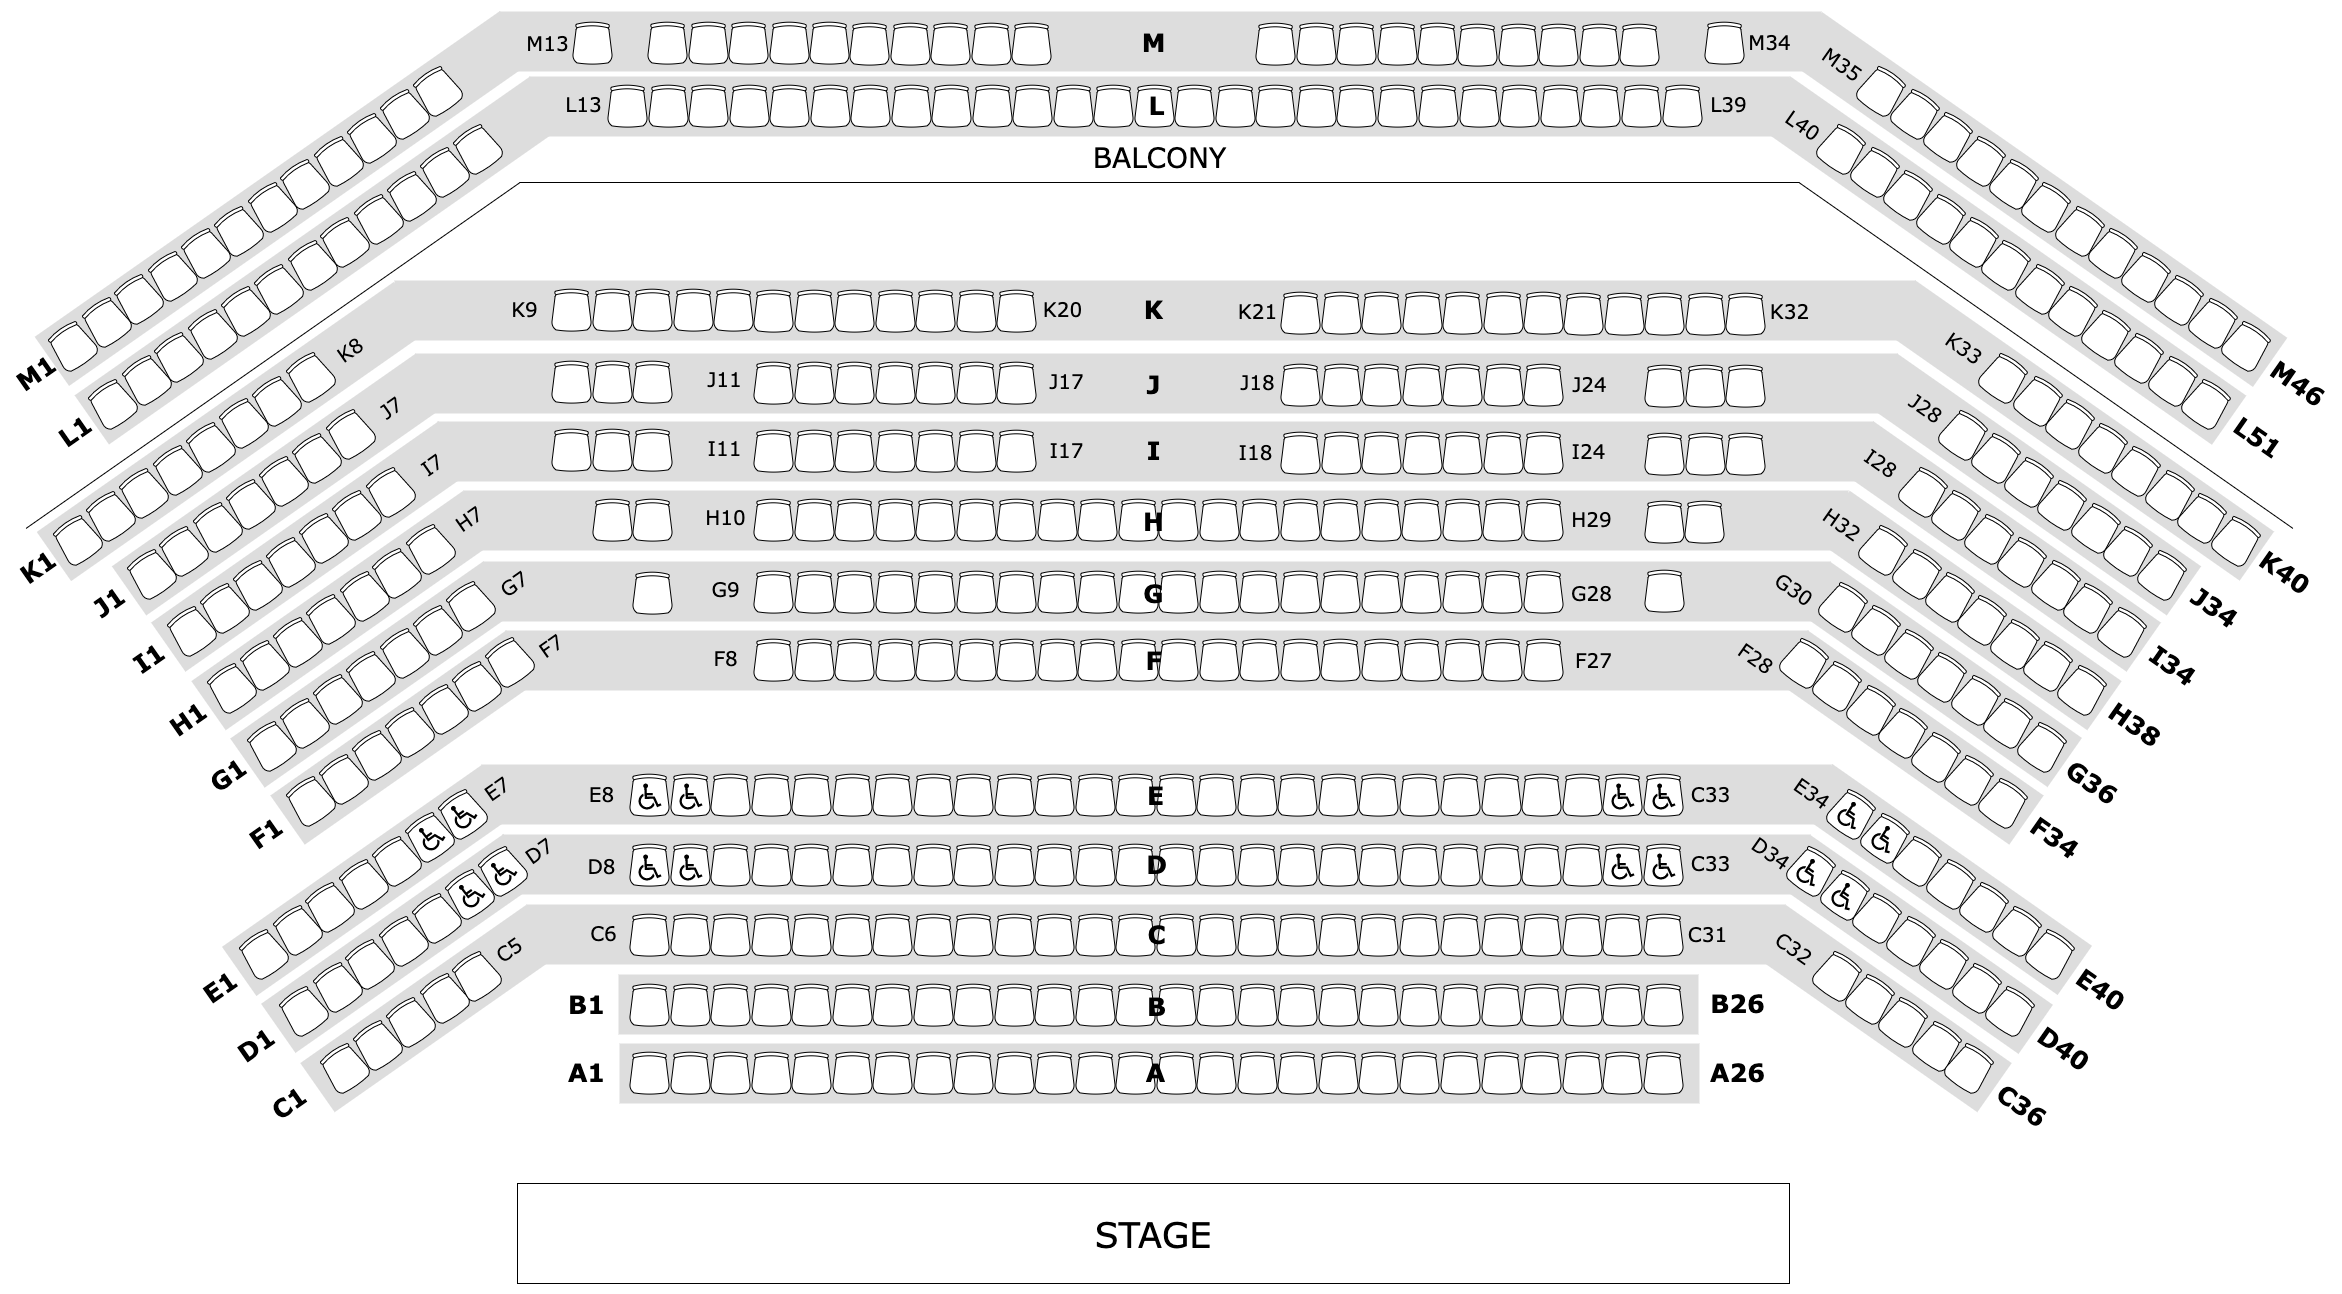
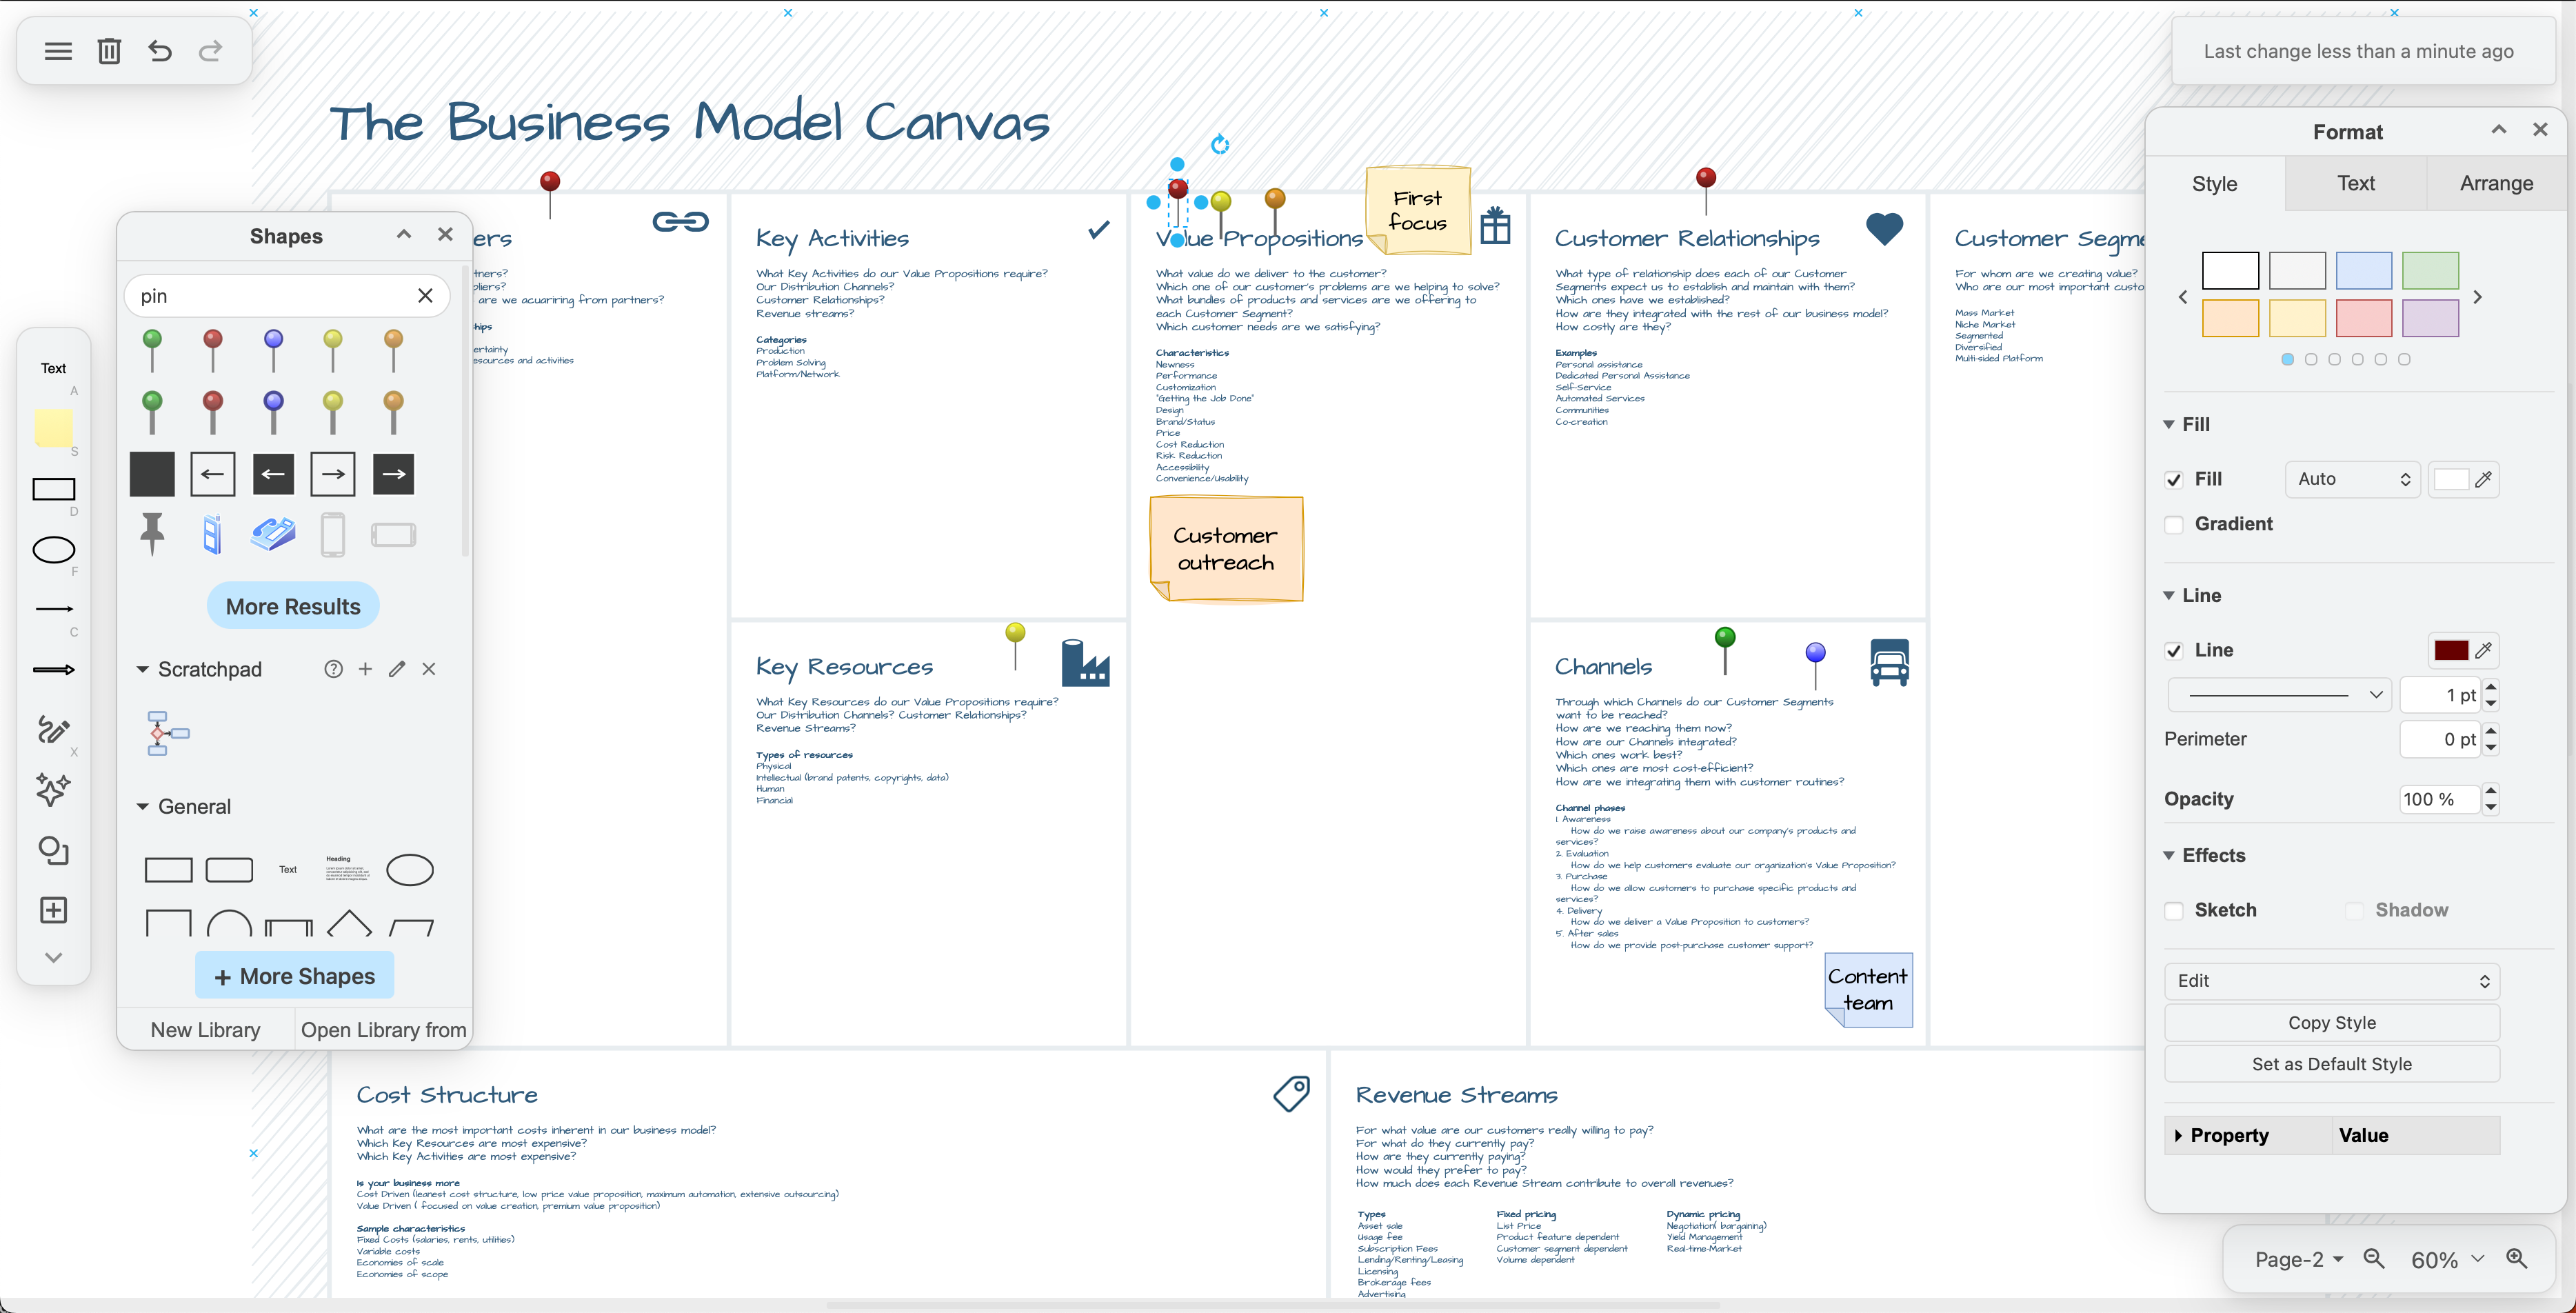
In marketing, customer journey maps, context diagrams, storymaps, floorplans and layouts are important technical documentation. Graphics designers and marketing also need to create a wide array of not-so-technical yet informative diagrams for presentations, brochures, customer websites, whitepapers and more. You can also create these in draw.io.
Manufacturing and logistics engineers
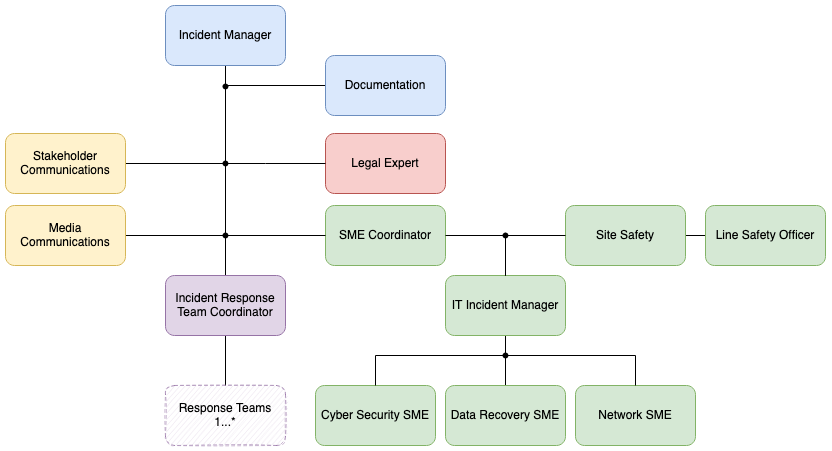
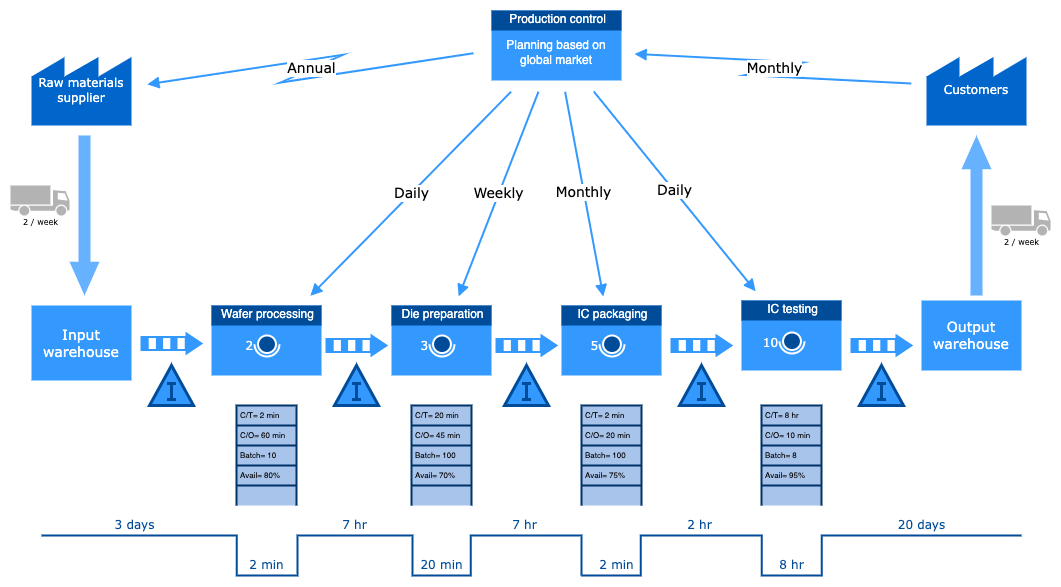
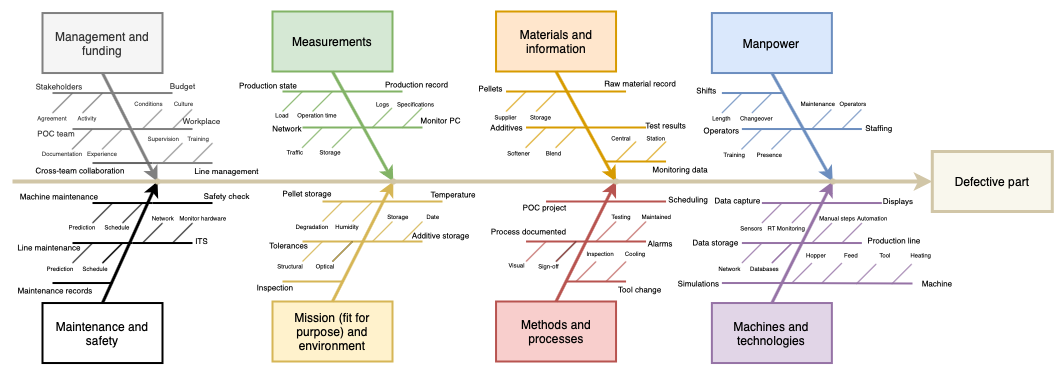
In manufacturing process diagrams and flows, supply chain models, Ishikawa (fishbone) diagrams, data-driven dashboard skeletons, routing diagrams, value stream and lean maps can often be life-critical diagrams, especially when incident response planning.
Project, product and team managers
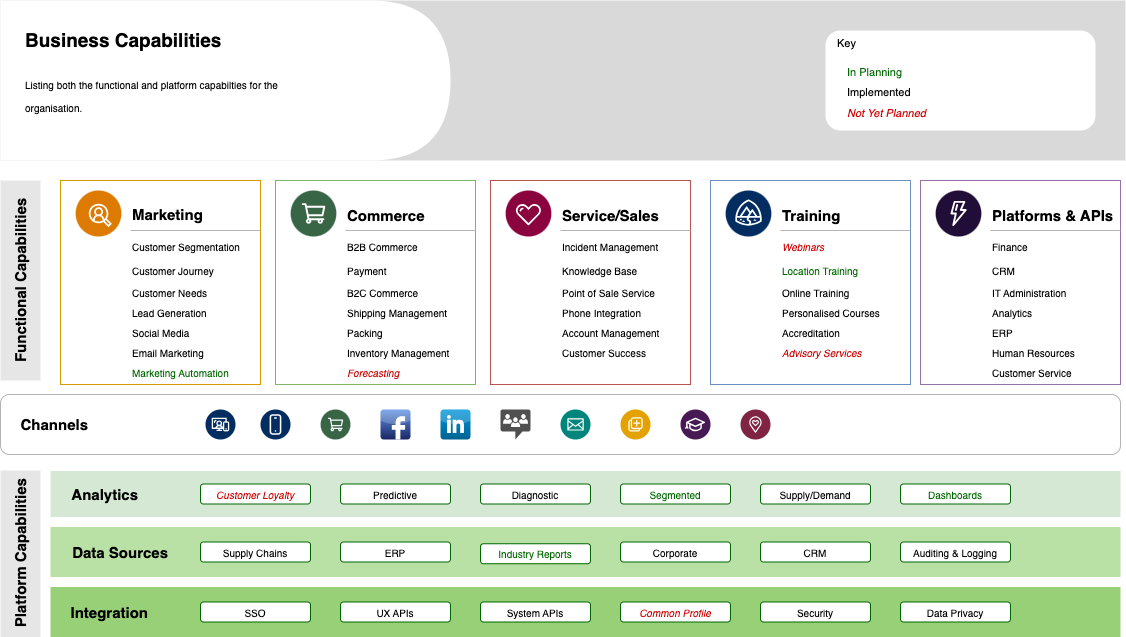
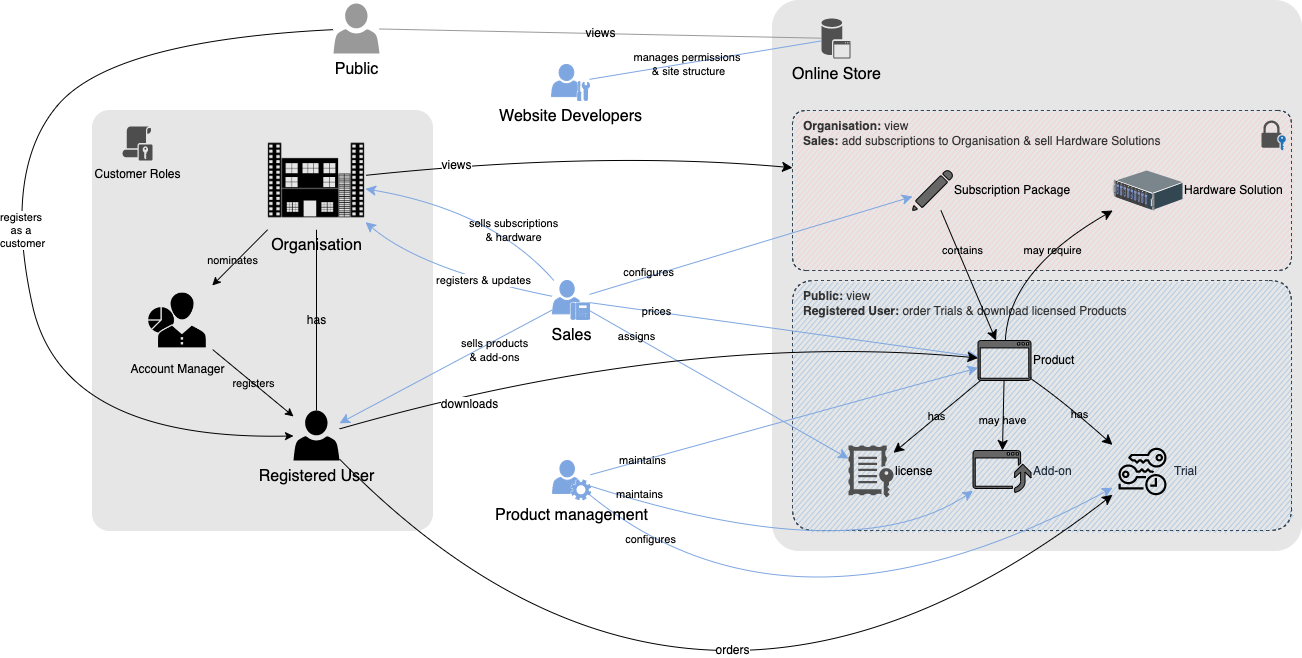
Across all teams, workflows, activity diagrams, organisation charts, responsibility diagrams, capability diagrams, roadmaps, capability diagrams, Gantt charts and PERT charts are used to document projects and in product development.
Risk management and security experts
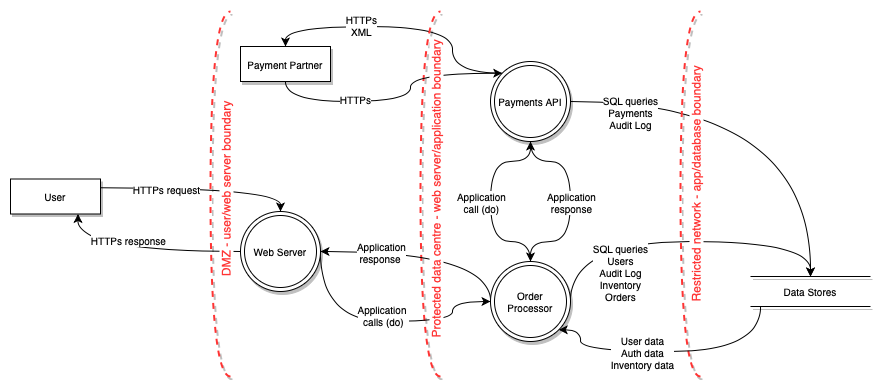
Consultants and data security teams need to draw decision trees, data and process flow diagrams, incident response documentation, attack trees and influence diagrams. This field overlaps heavily with cloud and system architecture, software development and business analysis.
Software developers
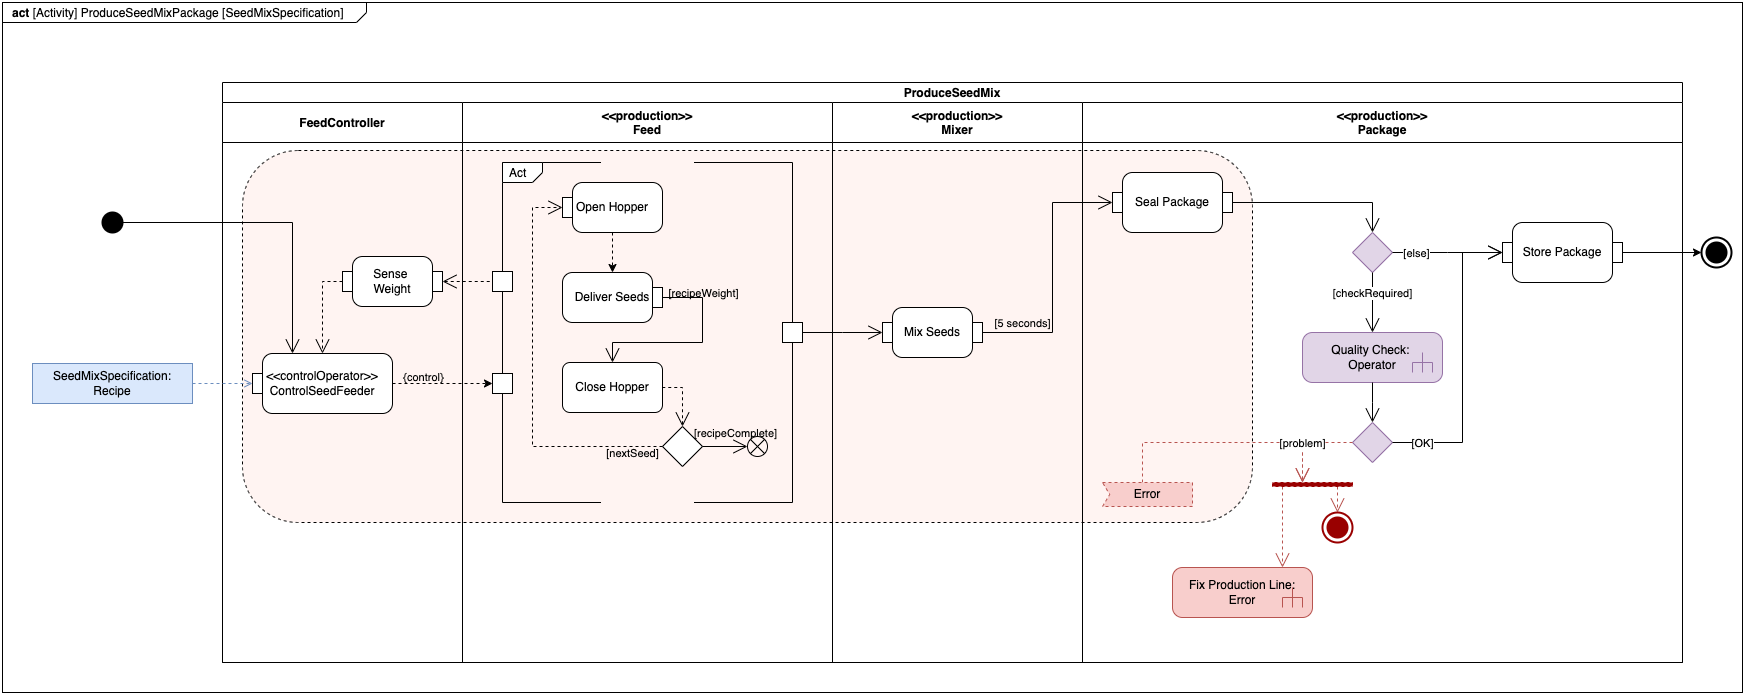
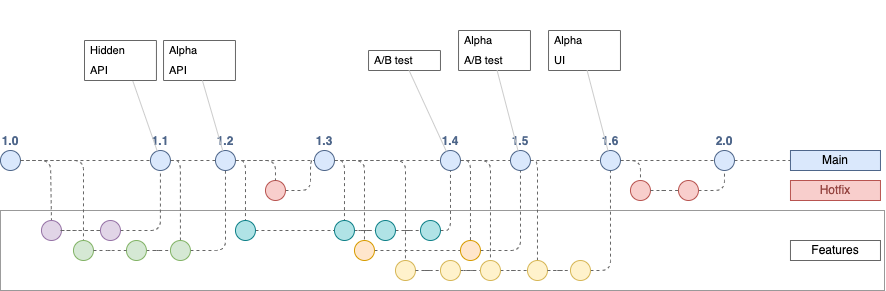
In software develpment, gitflows, UML diagrams including activity diagrams, state charts, user flows, mockups, architecture diagrams, database models, entity relationship diagrams, dependency graphs, sequence diagrams, C4 models and many more technical diagrams are needed to plan, implement and maintain software applications and systems.
User experience specialists
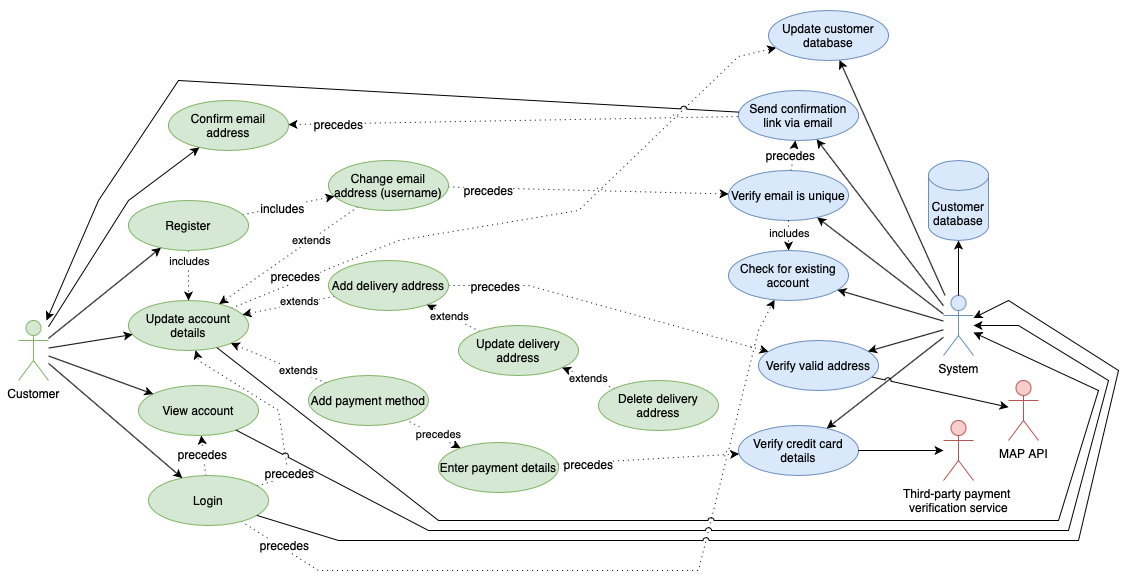
UX professional draw mockups and wireframes, concept maps, use case diagrams, user stories, and experience models, to help with product development and testing, and ensure accessibility.

Diagrams for presentations, documents and online content
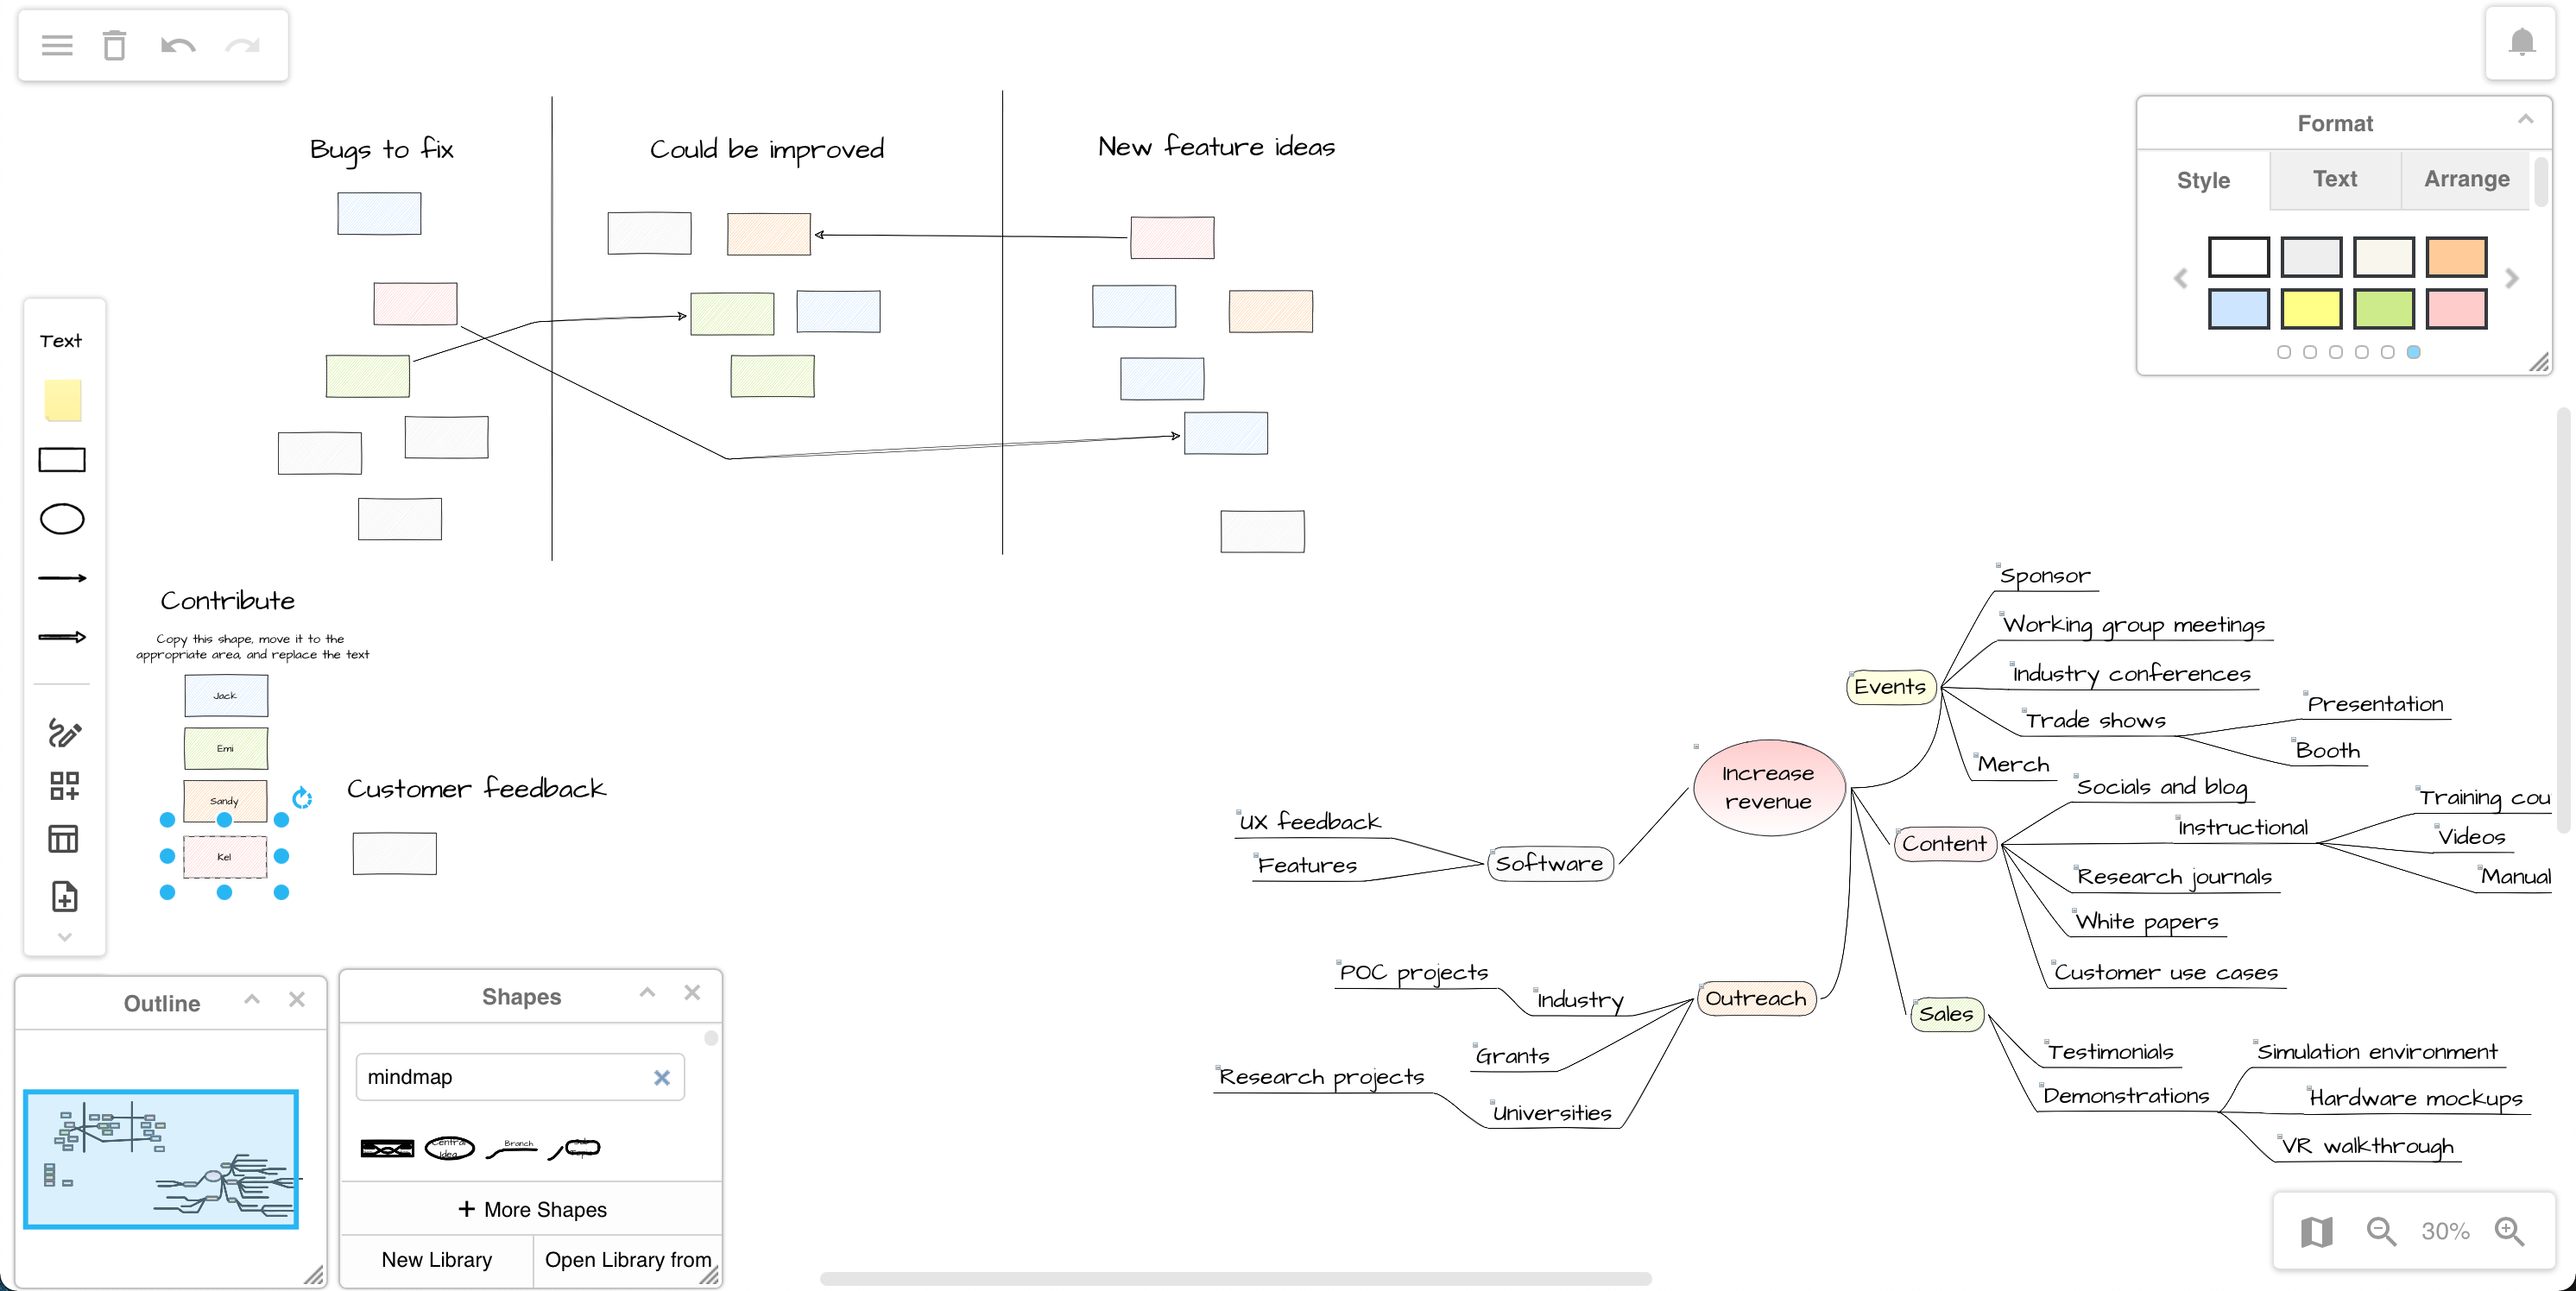
Of course, you can also create non-technical diagrams in draw.io, including infographics, freehand line drawings, charts, Venn diagrams, brainstorming boards, mindmaps, and many more.
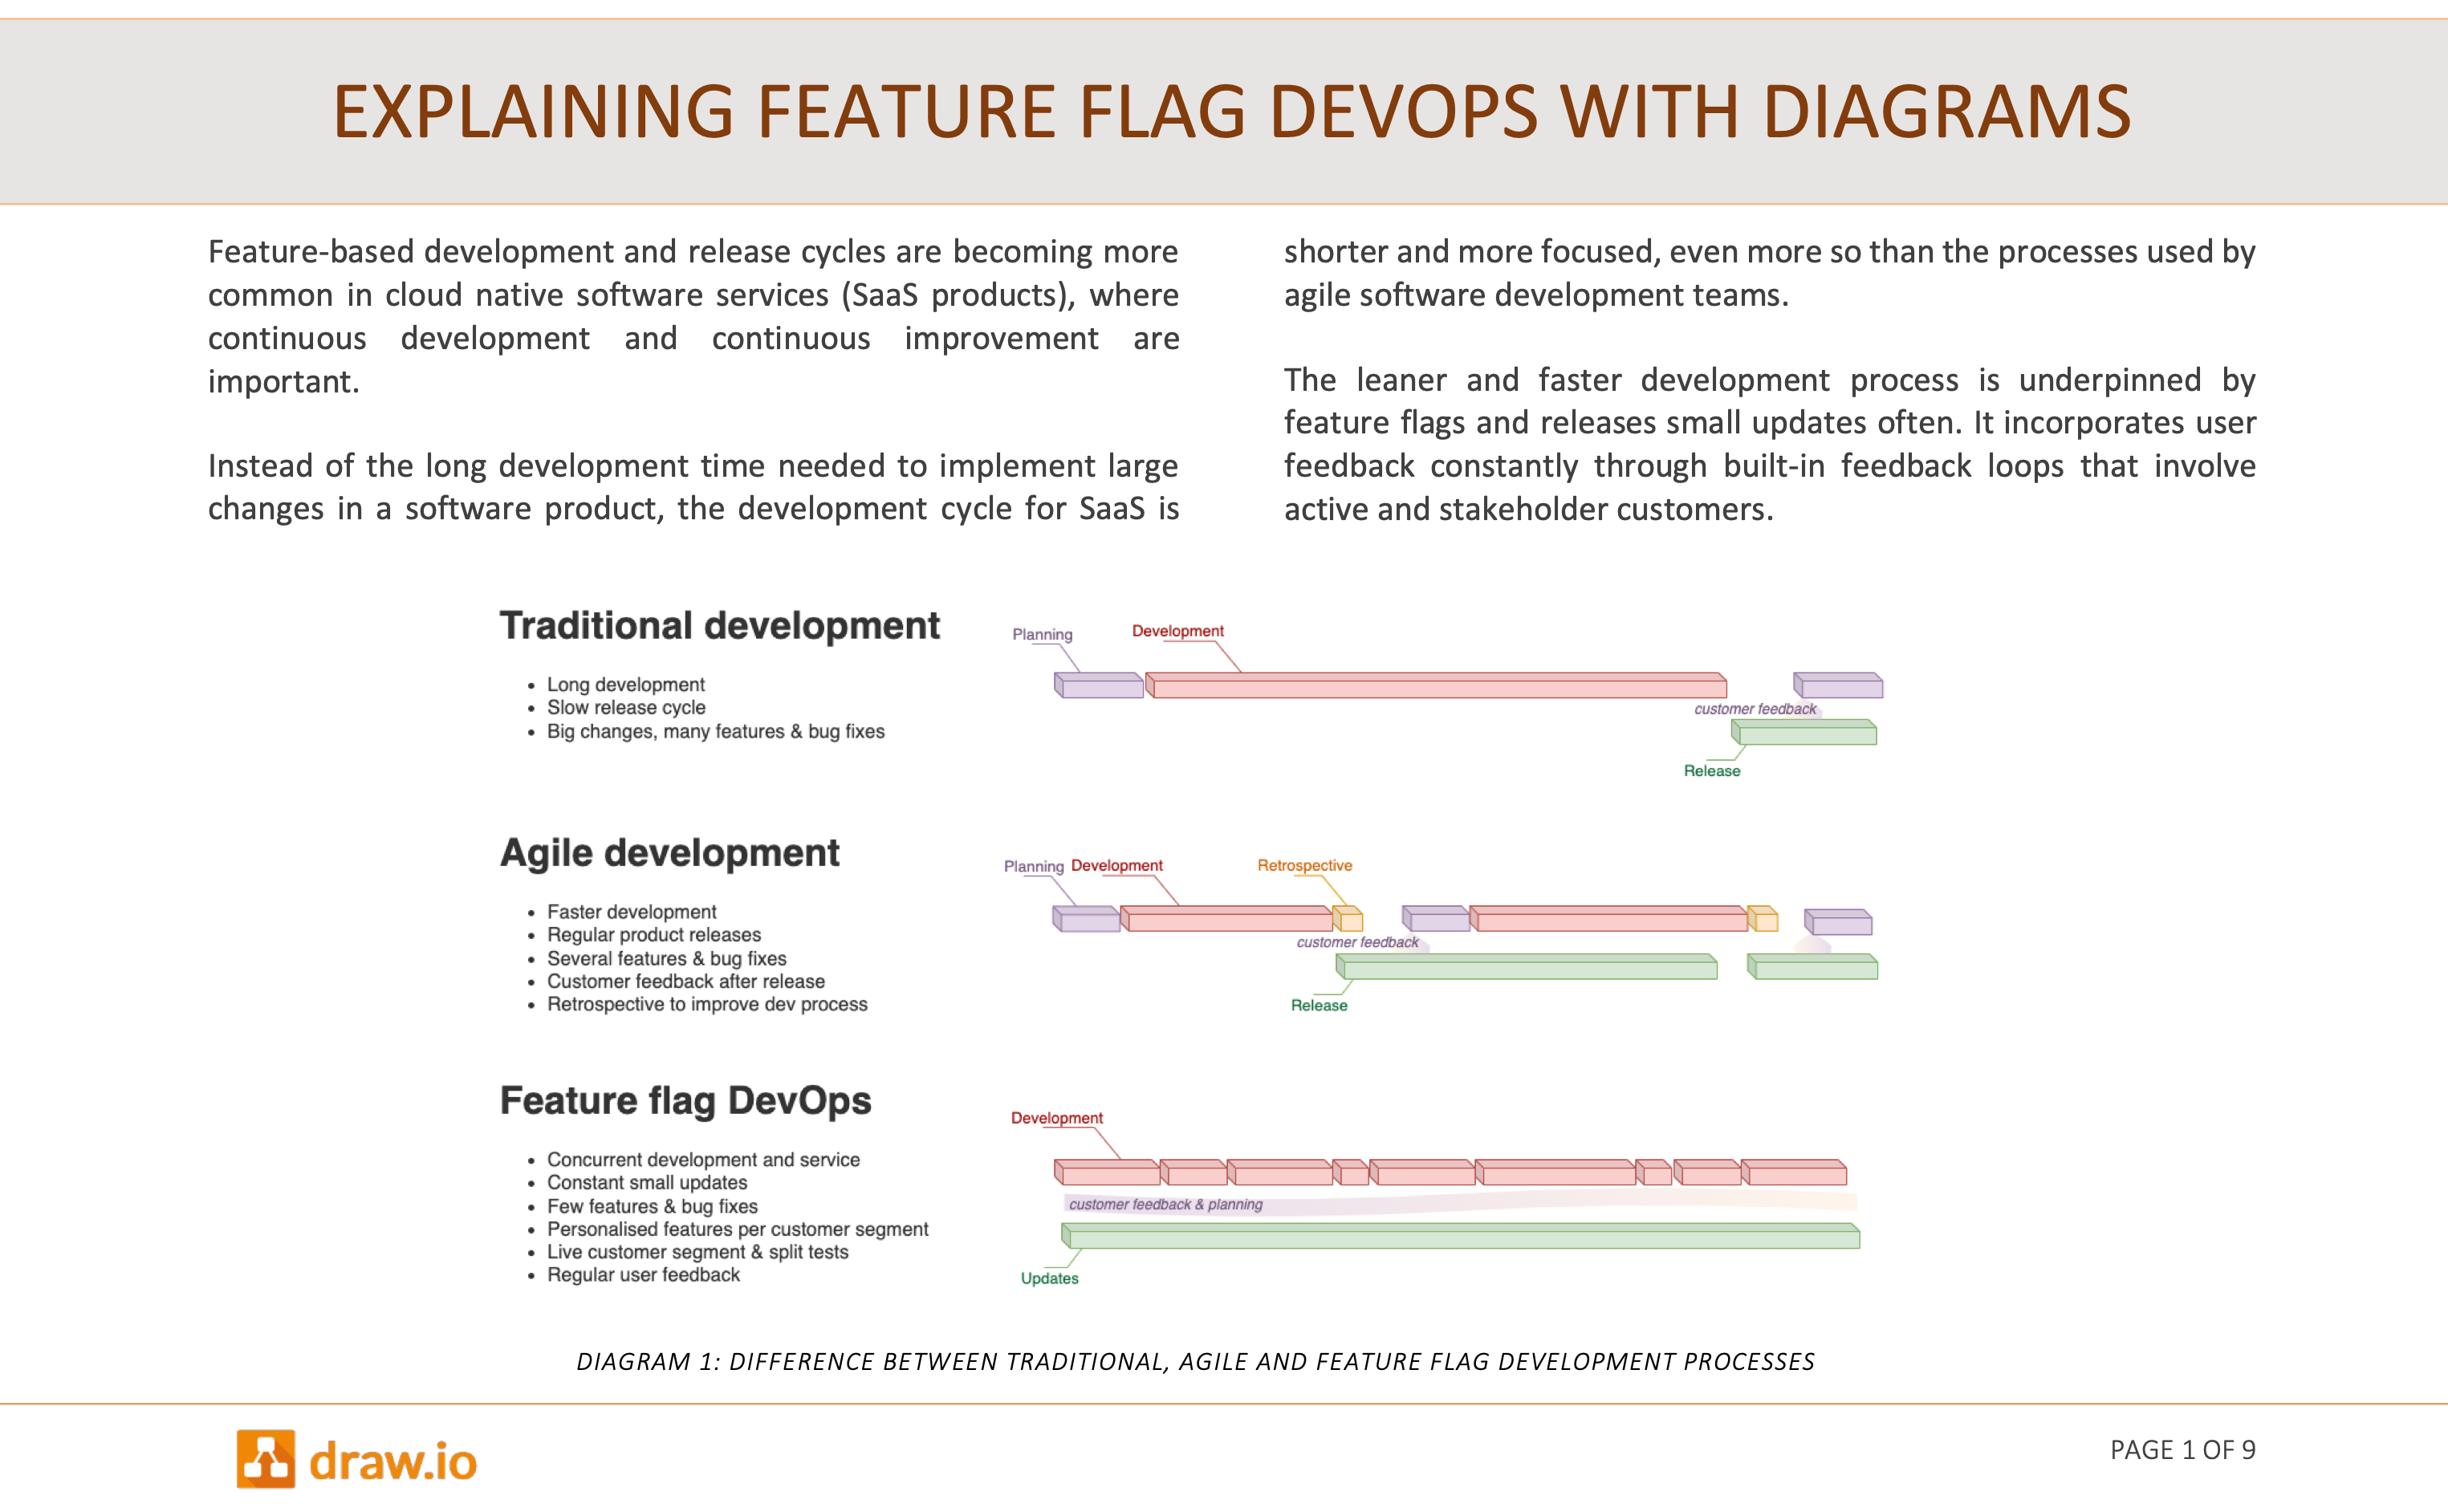
With our vast shape libraries, templates and examples to suit a wide range of diagrams, and even more with the custom libraries created by our users available on GitHub, it's easy to create whatever graphics you need in draw.io for presentations, documents, and online content.
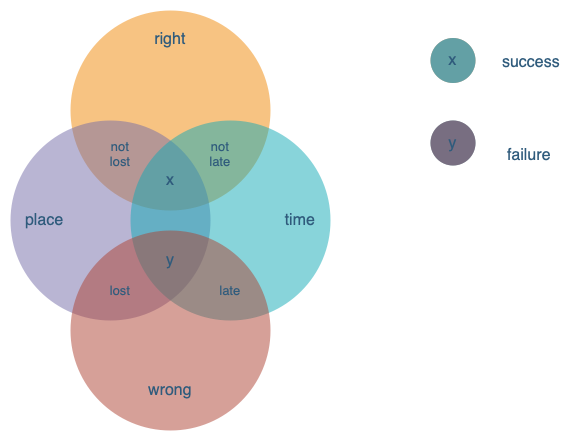
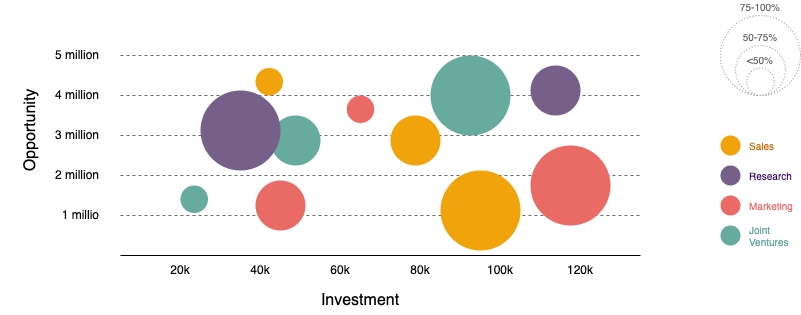
Executive assistants can create attractive graphs and charts, Venn diagrams, and presentation graphics with the draw.io plugins for Microsoft Office and Google Workspace.
Diagrams for daily team work
You can use any drawing app that supports real-time collaboration in several integrations with shared cursors as an online whiteboard with your team. While these diagrams are not considered technical, they are used by almost all of the teams above as they get their work done.
With draw.io, your team can co-create Kanban boards and Gantt charts for planning and tracking tasks in a project, T-charts, mindmaps, flowcharts, SWOT charts, bubble maps, layer diagrams and whatever you need for your online meetings.
With the freehand tool (via the toolbar, or Arrange > Insert > Freehand), you can draw freehand shapes, annotate or mark up your meeting notes quickly and easily.
Diagrams for every day life
Diagrams are not only useful in work situations, but in many every-day life situations where you need to communicate complex information.
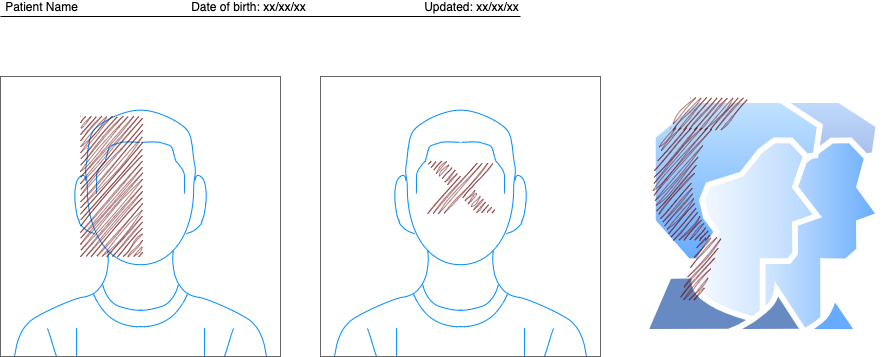
In particular, diagrams help patients detail medical issues to doctors in a way they can understand quickly, and without the pressure of needing to explain on on the spot. Of course, specialists also use diagrams to explain therapies to patients - in draw.io, you can easily add labels to images inserted into the diagram.