Timelines and roadmaps
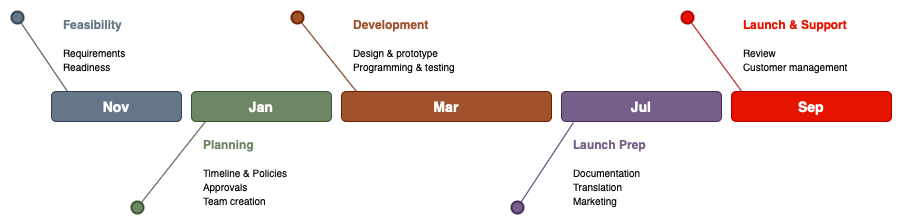
Timelines, roadmap and milestone diagrams feature in a range of documentation - project development documents, infographics and presentations being some of the most common. There are many shapes and templates in draw.io and our draw.io branded apps that you can use to quickly draw an attractive diagram that you can embed in your presentation or documentation.
Use the Infographic shape library
While you can create a timeline from many of the shapes in the basic libraries, as with the example above, the Infographic shape library has a selection of ready-made roadmaps and timelines.
Enable the Infographic shape library
- In the left-hand panel of the draw.io editor, click More Shapes.
- Scroll to Other section, click on the checkbox next to the Infographic shape library, then click Apply.
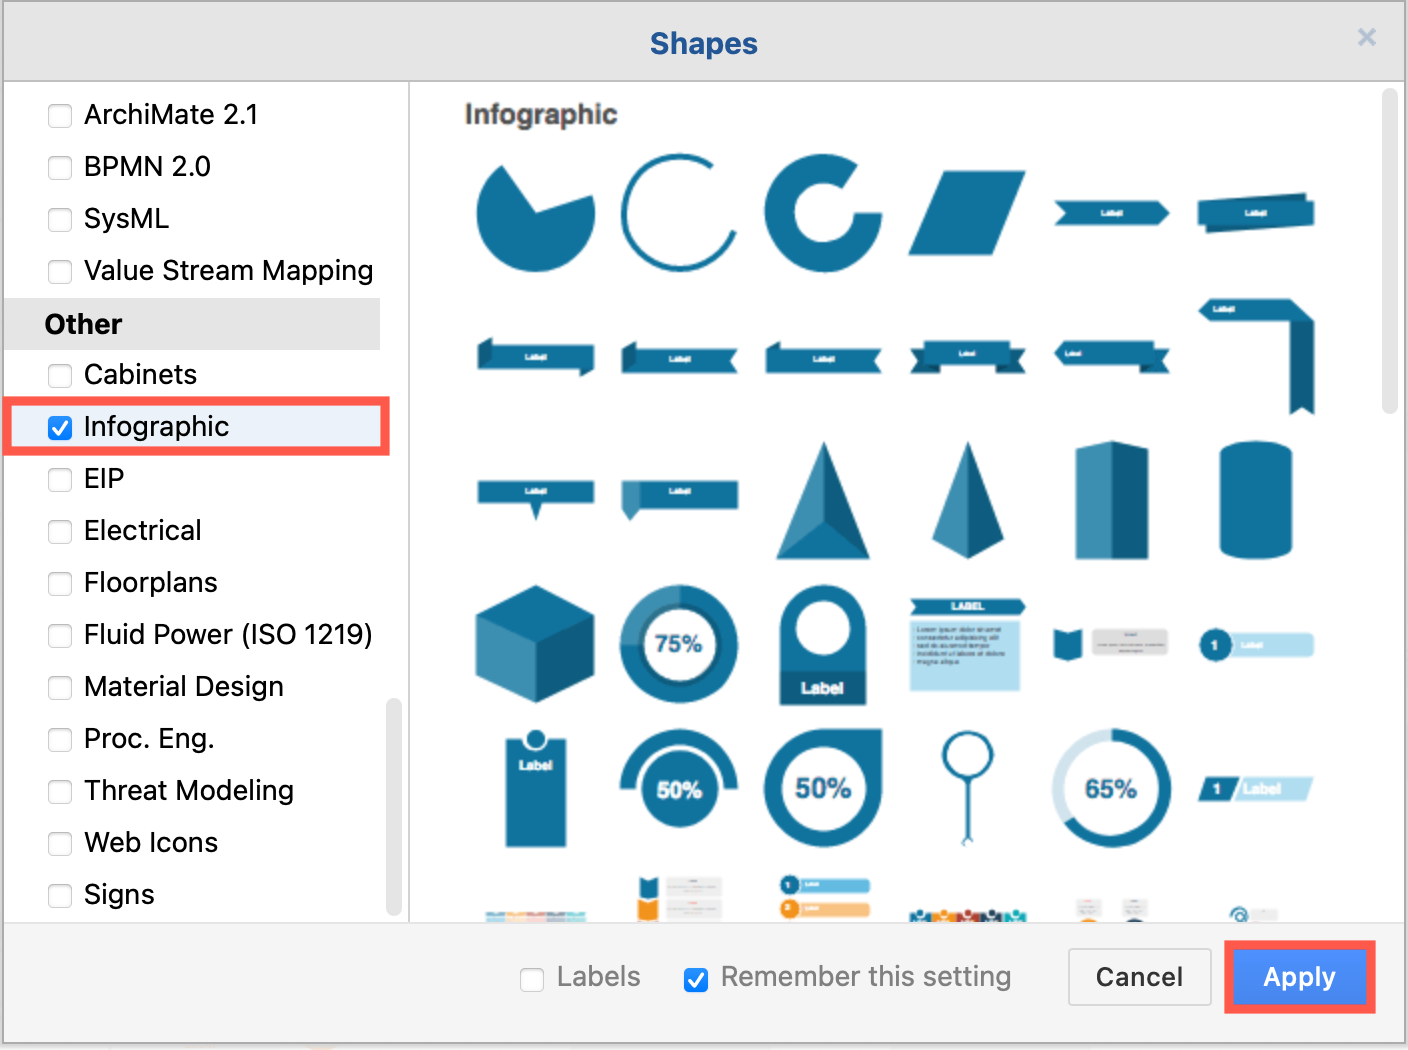
Most items in the infographic shape library are a collection of shapes and labels already styled and arranged neatly, just like a template.
Start a new diagram with the infographics library already enabled
Draw your timeline using the Infographic shape library
- Hover over a shape in the shape library to see a larger preview.
- Click on a shape to add it to the drawing canvas.
- Double click on the text to edit the labels.
- Change the shape and text styles via the format panel on the right if needed.
- Copy and paste parts of the diagram on the drawing canvas or drag the matching component shapes from the Infographic shape library to extend your timeline as needed.
Horizontal timeline and roadmap shapes
There are two horizontal roadmaps with different styles, as well as a bar graph in the Infographic shape library that are well suited to use as a timeline or milestone diagram in a presentation or when planning projects using draw.io as your team's online whiteboard.
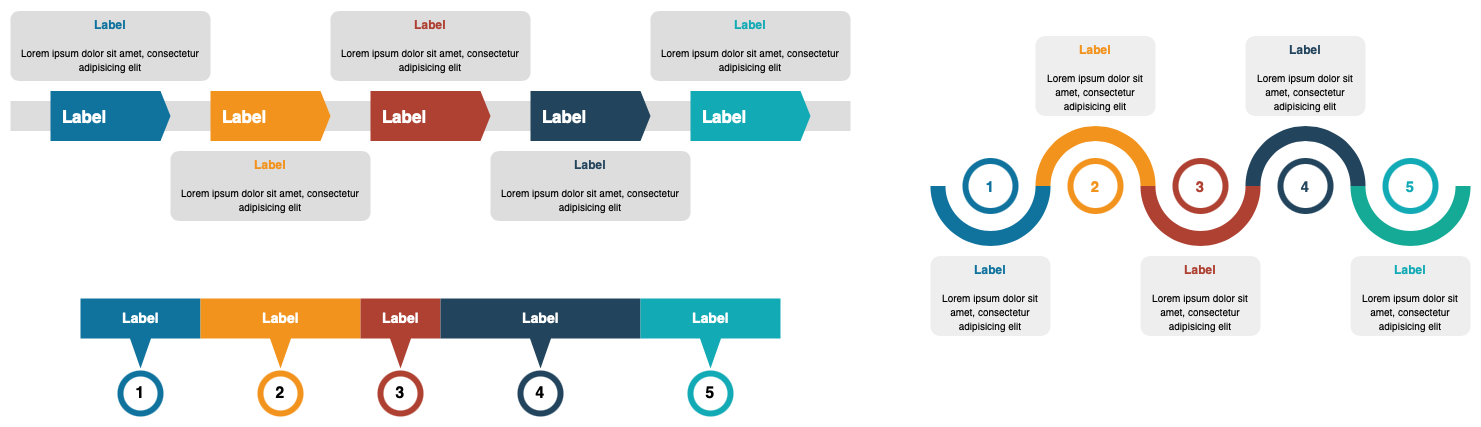
Open these horizontal timelines in our diagram viewer
Some others in the Infographic library that work well as a horizontal timeline when you edit their label text include the following: list, circular dial list, percentage list and the roll.
Tip: For a more detailed timeline with multiple text boxes for each time step, use the Chevron list shapes.
Vertical timelines and roadmap shapes
If you need to print a diagram or use it as part of a larger infographic, your timeline may be more readable when vertical. The vertical roadmaps, numbered lists, and swirl shapes, along with the various angled and arrow lists in the Infographic shape library are well suited for printed documentation.
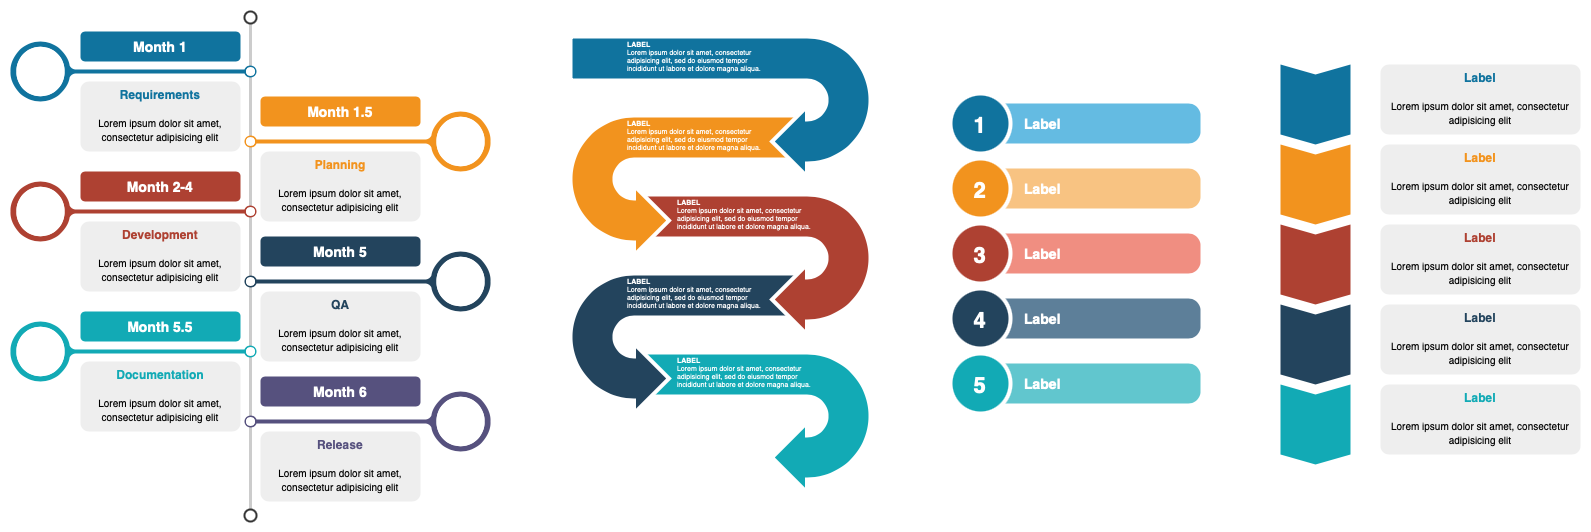
Open these vertical timelines in our diagram viewer
Use a timeline template
There are also several timeline and roadmap templates in the Business section of the template library.
- Open a new diagram to see the template library, or select Arrange > Insert > Template in the draw.io editor.
- Select the Business section on the left, and scroll to the bottom of the the section. Click on the magnifying glass to see a larger preview of any template.
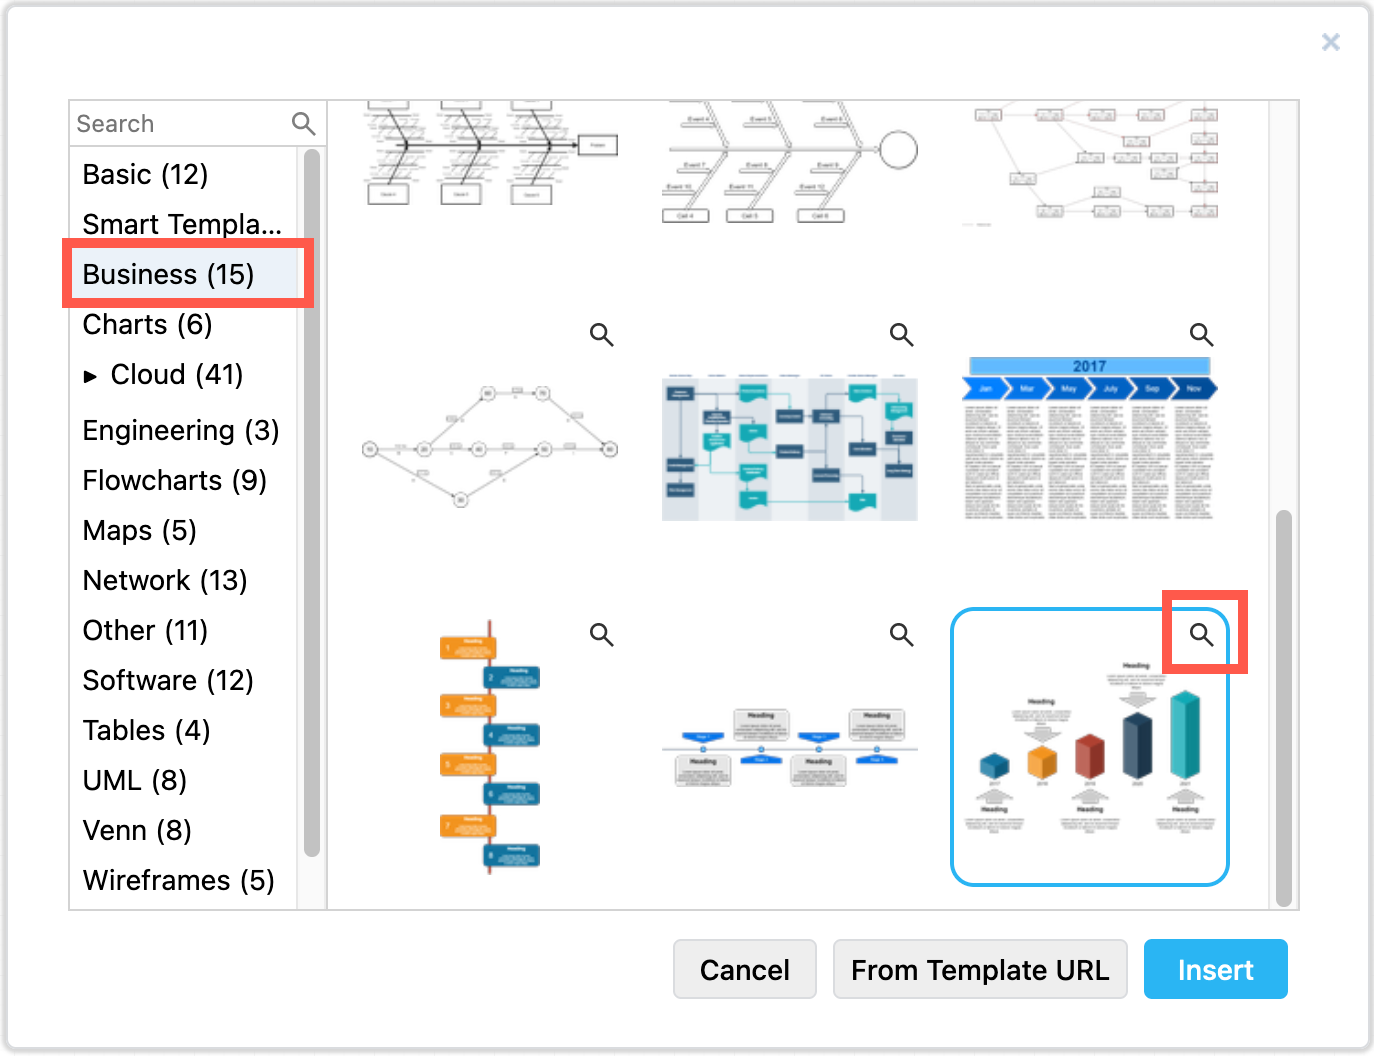
- Select a template, then click Insert to add it to the drawing canvas.
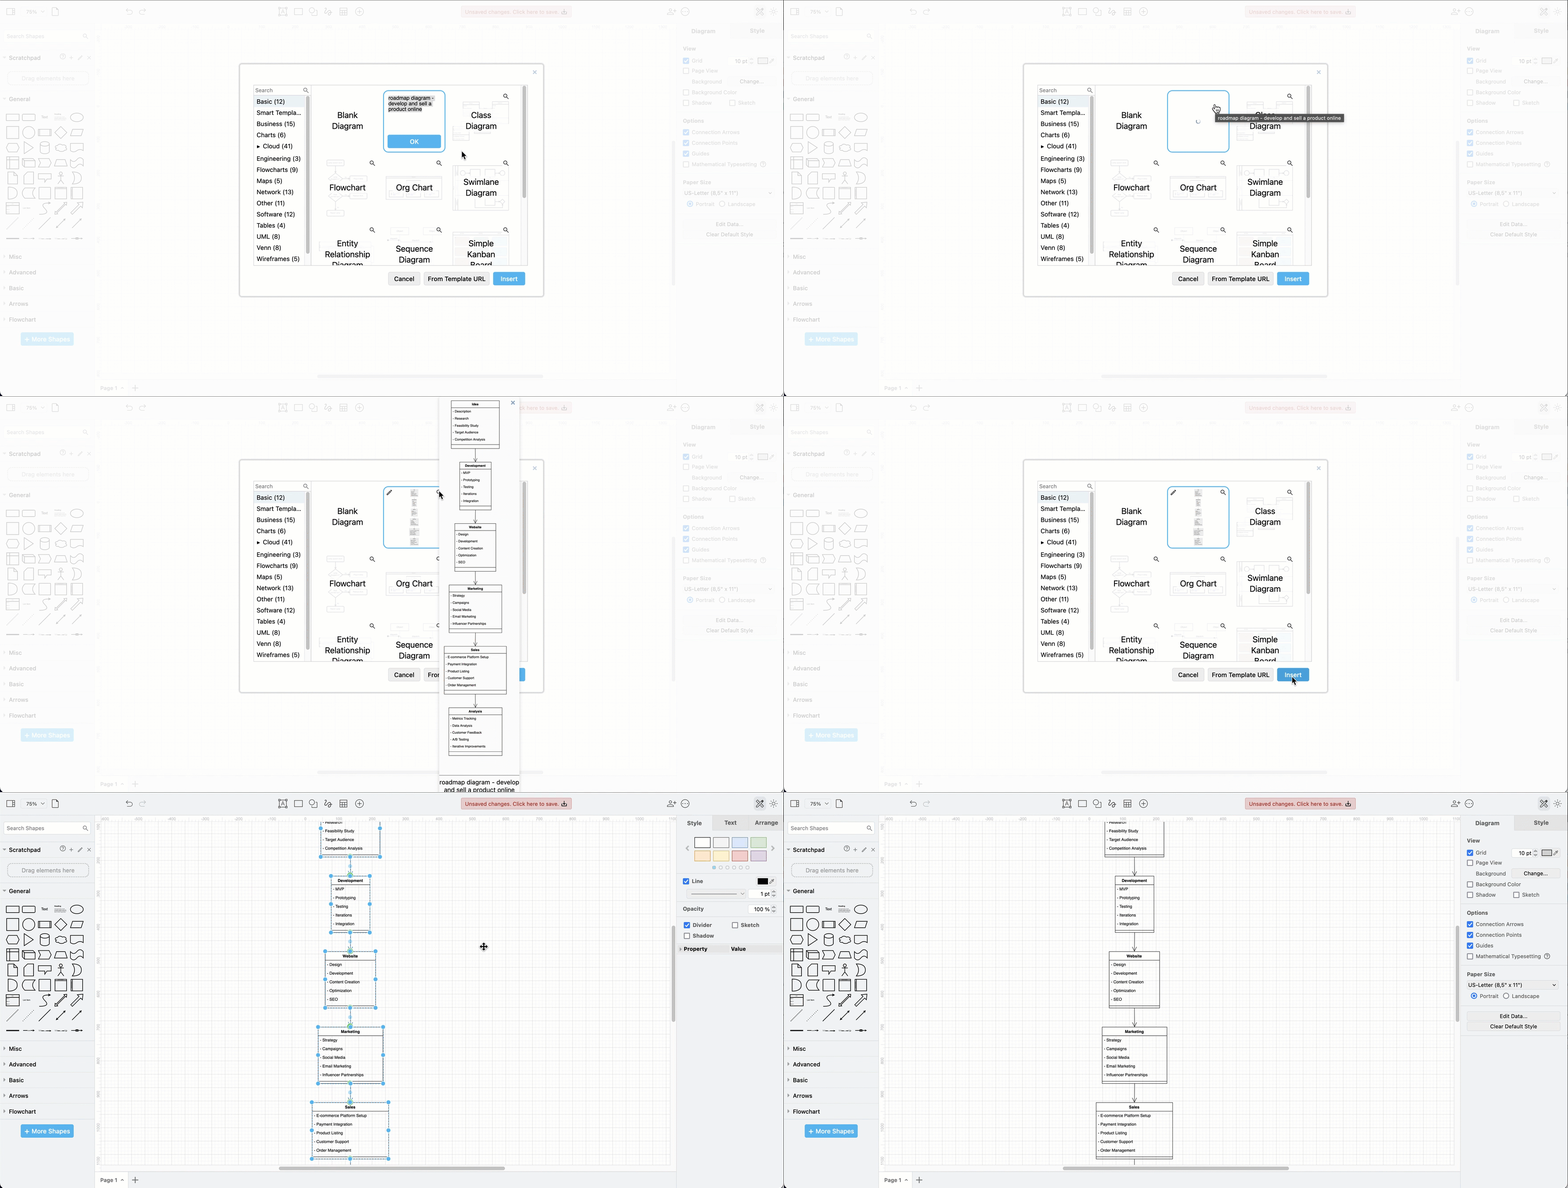
Alternatively, click on Generate, and describe the diagram in text to generate a custom template diagram. Add roadmap diagram or timeline at the start of your description to ensure it generates a suitable type of diagram.
Embed your timeline in your presentation or document
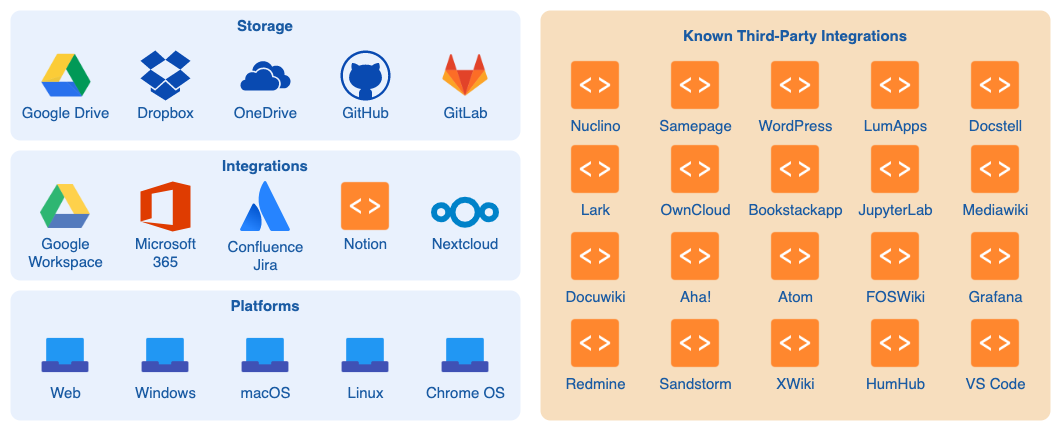
draw.io has been integrated into many applications and content platforms - Google, Microsoft, Atlassian, Notion and more.
See all draw.io integrations
When you store your diagram file in your Microsoft OneDrive or Google Drive account, you can embed your diagram into Microsoft Office and Google Workplace documents easily into presentations, documents and spreadsheets.
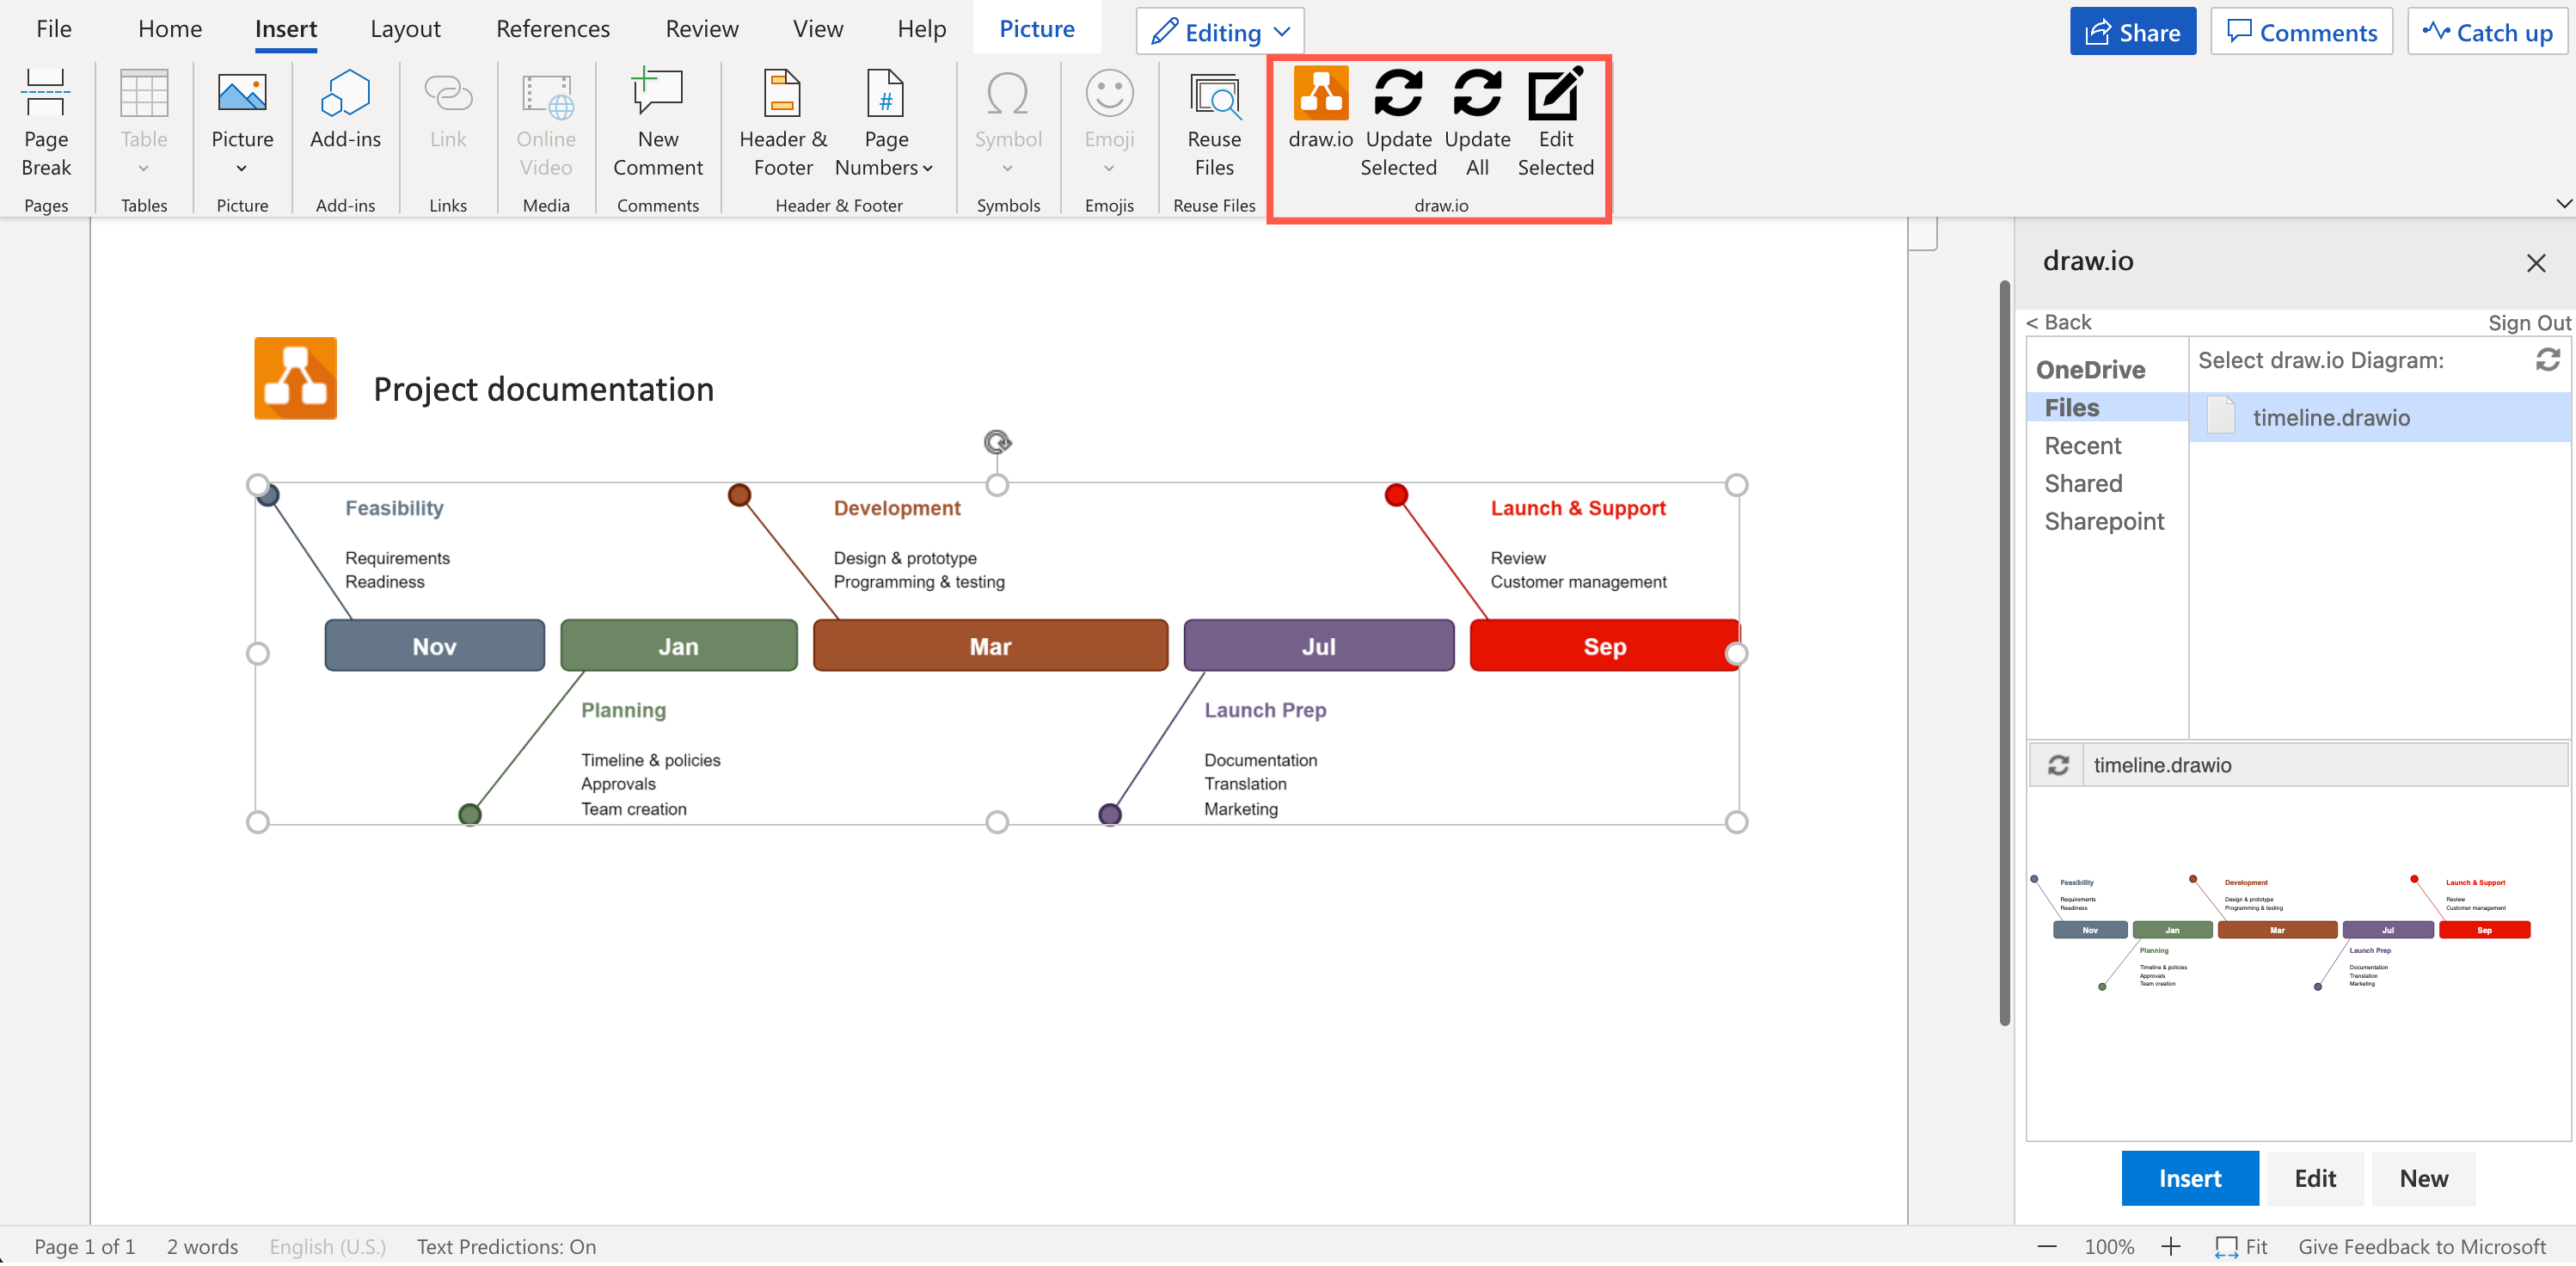
See how to use the draw.io with the following: