Use Mermaid code to create diagrams
Mermaid is a syntax similar to Markdown where you can use text to describe and automatically generate diagrams. With Mermaid's Markdown-inspired syntax, you can generate flow charts, UML diagrams, pie charts, Gantt charts, and more.
Many developers prefer to describe their data structures and processes using text, avoiding the need to context switch. After documenting them in the Markdown-based text description, you can then insert this into the draw.io editor to generate a diagram and lay it out automatically.
Insert a Mermaid diagram
- Click Arrange > Insert > Mermaid. Alternatively, click the
+icon in the toolbar, then select Mermaid.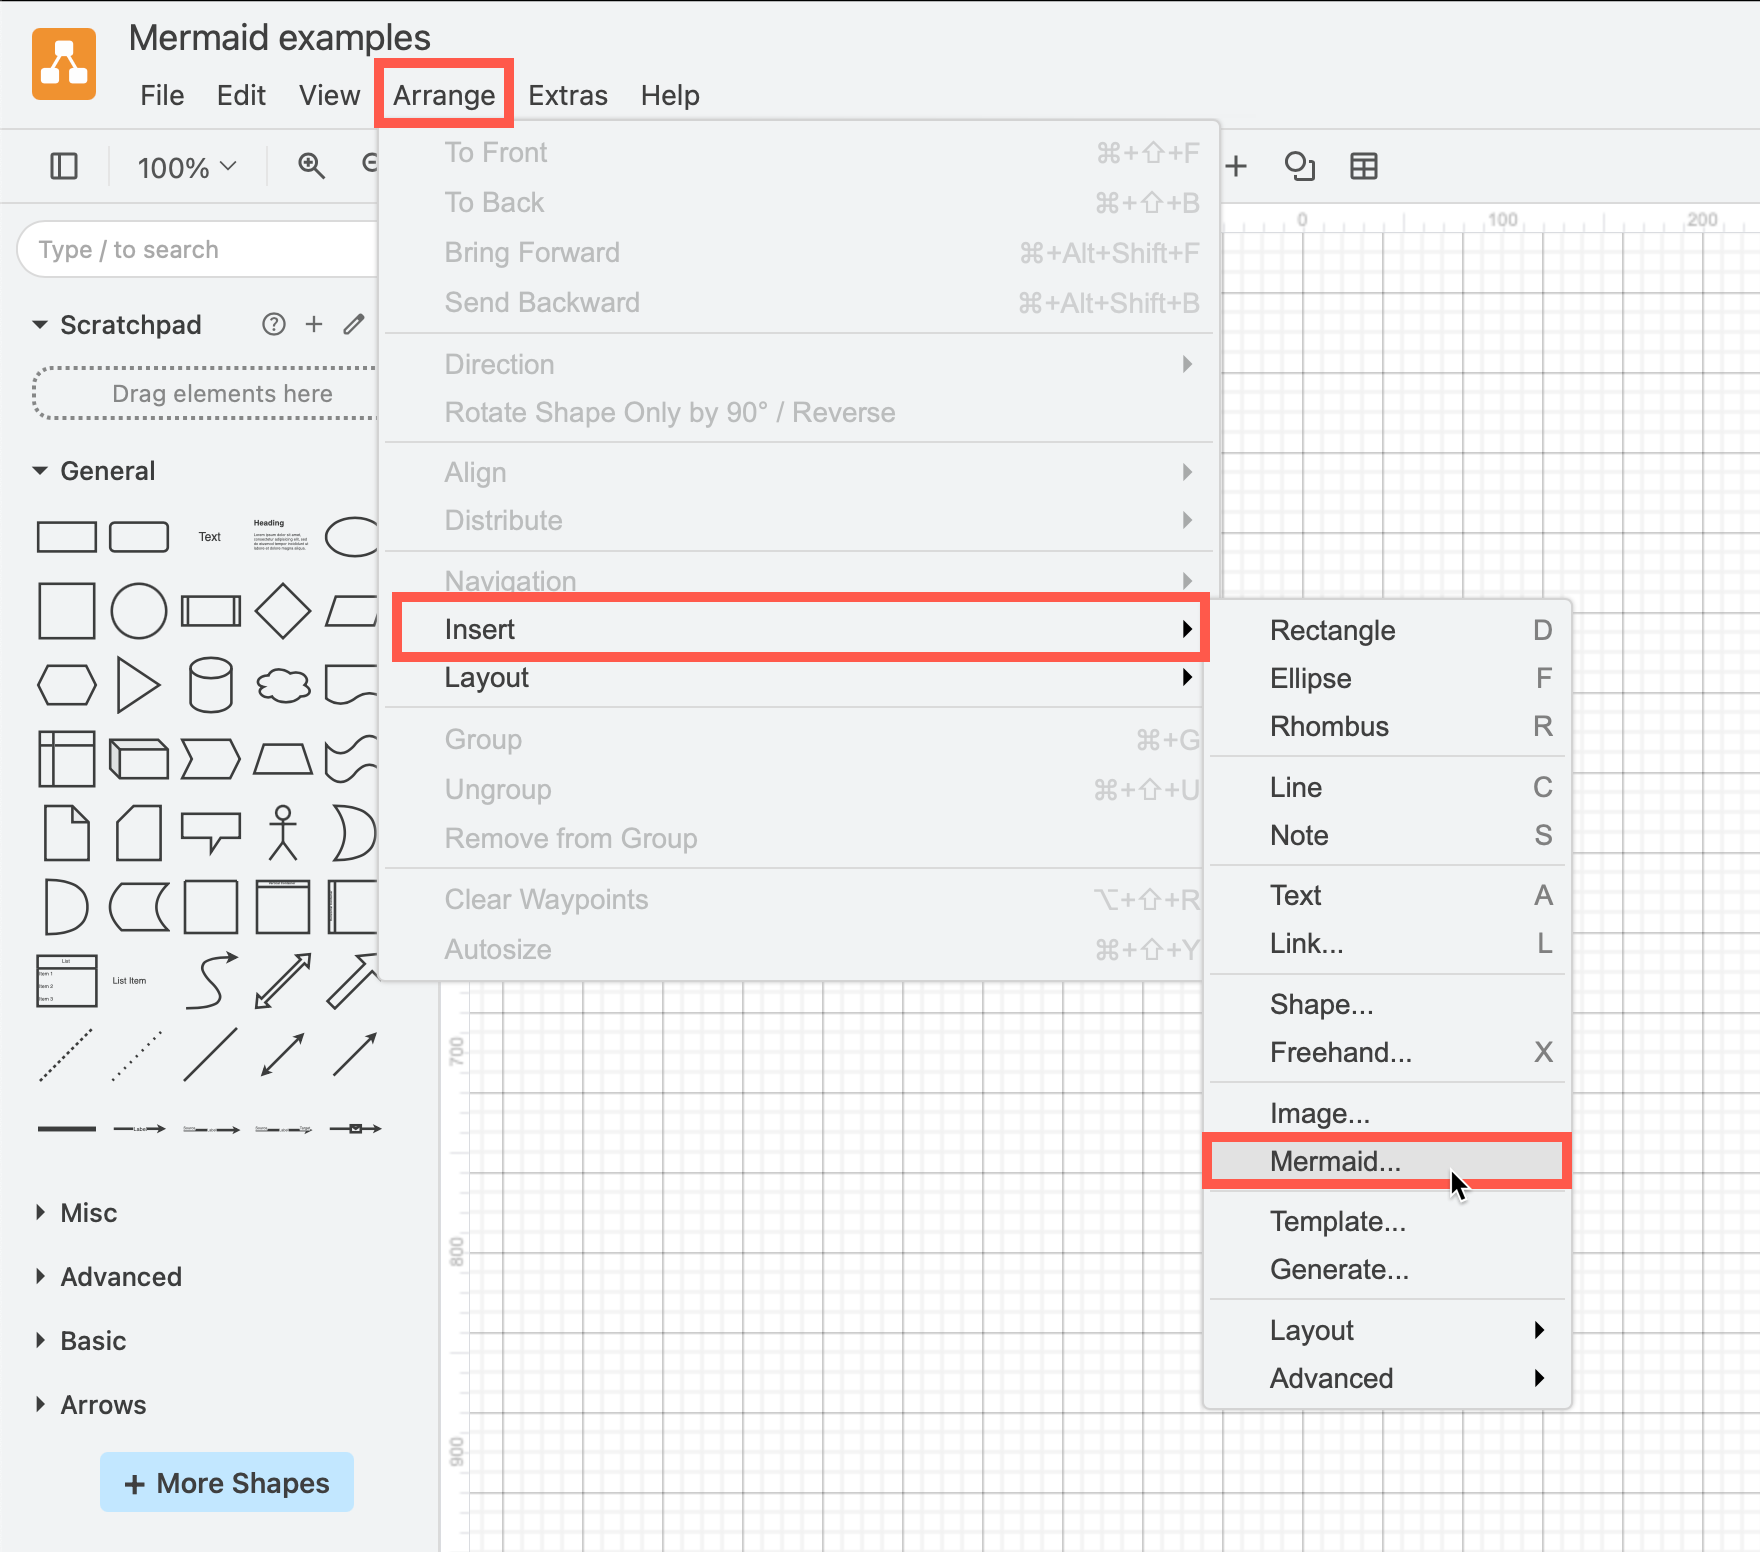
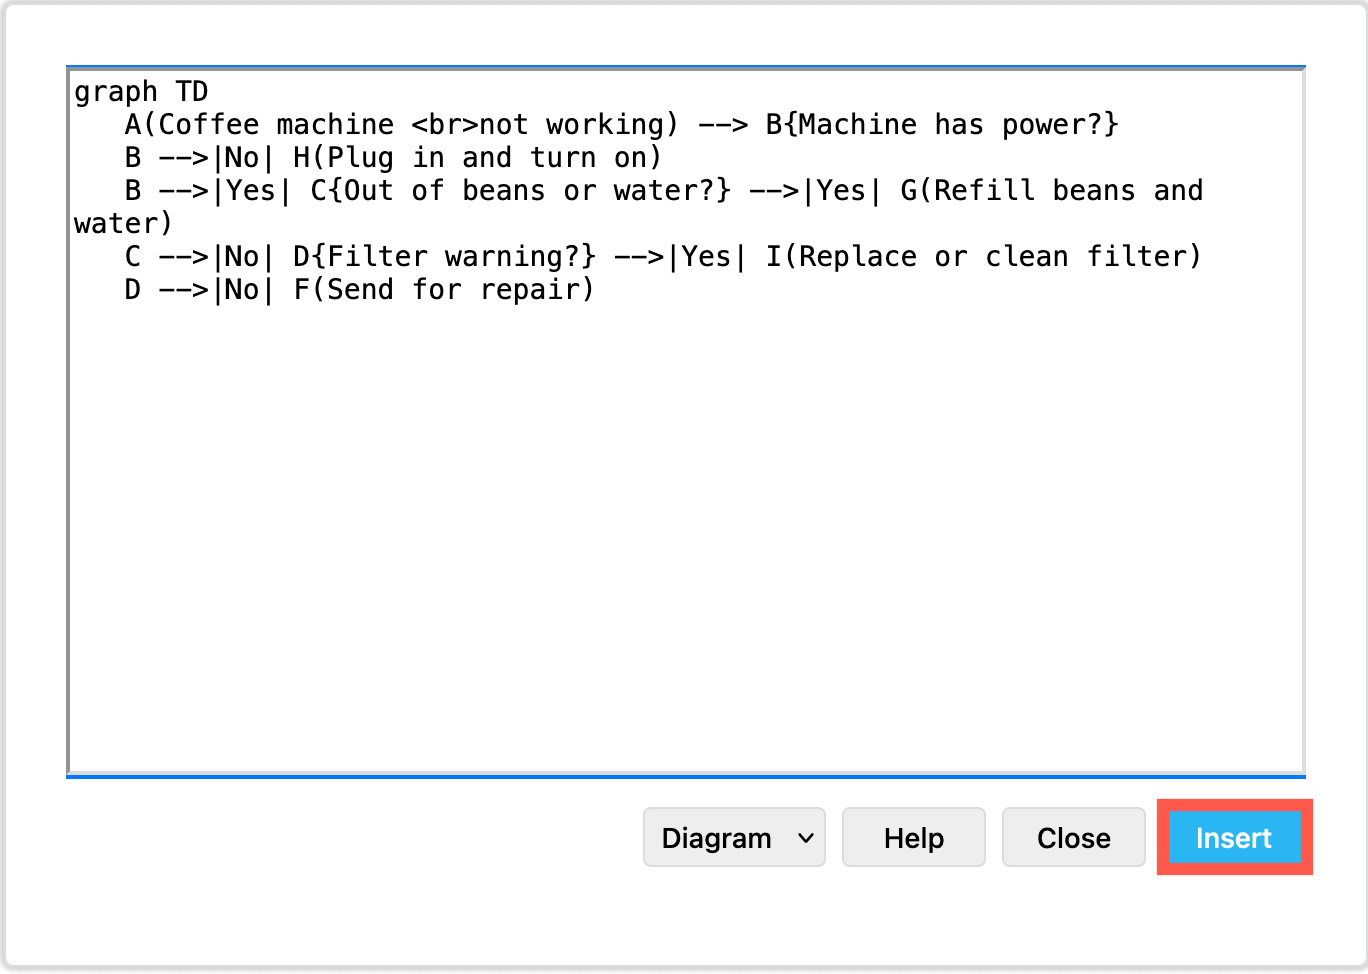
- Paste your text into the text box, then click Insert.
Your diagram will be automatically created and formatted from your text, and inserted as a single shape on the drawing canvas.
Edit the Mermaid code in draw.io
To see the Mermaid code for any of the diagrams inserted in this way, select the shape, then press Enter. You can make changes to the code here, then click Apply to update the diagram on the drawing canvas.
The Insert / Edit Mermaid dialog
The Mermaid dialog (Arrange > Insert > Mermaid, or + > Mermaid in the toolbar) contains:
- a large text area where you paste or type your Mermaid source (you can also drag a text file onto it),
- an output selector with two choices — Diagram (editable draw.io shapes, the default) and Image (a single static SVG picture),
- a help (?) icon that links to this guide,
- Insert and Close buttons.
Paste your Mermaid code, choose Diagram or Image, and press Insert:
- Diagram parses the text and drops the result onto the canvas as real draw.io cells — not a picture — wrapped in the special Mermaid group described below.
- Image renders the parsed diagram to a single SVG Mermaid image cell — a fixed picture whose Mermaid source stays re-editable.
Either way the Mermaid source is stored on the inserted cell, so the diagram stays re-editable as Mermaid even after saving, closing and reopening.
Supported diagram types
The diagram type is detected from the first keyword of your source, so the text must start with one of the keywords below. Optional YAML front-matter, %%{init}%% directives and comments are skipped first, then the first keyword is read.
| Diagram | Start your source with |
|---|---|
| Flowchart | flowchart or graph |
| Class diagram | classDiagram |
| State diagram | stateDiagram / stateDiagram-v2 |
| Sequence diagram | sequenceDiagram |
| ZenUML sequence | zenuml |
| Entity-Relationship (ER) | erDiagram |
| Requirement diagram | requirementDiagram |
| C4 model | C4Context / C4Container / C4Component / C4Dynamic / C4Deployment |
| Gantt chart | gantt |
| User journey | journey |
| Kanban board | kanban |
| Timeline | timeline |
| Git graph | gitGraph |
| Pie chart | pie |
| XY chart (bar / line) | xychart-beta |
| Quadrant chart | quadrantChart |
| Radar chart | radar / radar-beta |
| Sankey diagram | sankey / sankey-beta |
| Treemap | treemap / treemap-beta |
| Mindmap | mindmap |
| Block diagram | block / block-beta |
| Packet diagram | packet / packet-beta |
| Architecture diagram | architecture / architecture-beta |
| Venn diagram | venn |
| Ishikawa / fishbone | ishikawa or fishbone |
| Tree view | treeView |
| Wardley map | wardley / wardley-beta |
| Event Modeling | eventmodeling / eventmodeling-beta |
If the text starts with a keyword that isn't in this list, draw.io reports it as an unsupported diagram type. If it is a supported type but the body can't be parsed, you get a parse error pointing at the problem.
Choosing the layout engine (ELK)
The graph-based diagram types — flowchart, class, state, entity-relationship and requirement — are arranged by a layout engine. By default draw.io uses Dagre (the same engine Mermaid uses internally), but you can switch these diagrams to the ELK engine, which often gives tidier orthogonal routing and tighter layer spacing on large or deeply-nested graphs.
You request ELK with standard Mermaid configuration placed at the top of your source. There are two ways:
1. Flowcharts — the defaultRenderer knob
%%{init: {"flowchart": {"defaultRenderer": "elk"}} }%%
flowchart LR
  A --> B --> C
2. Any graph type — the layout key
As an init directive:
%%{init: {"layout": "elk"}}%%
classDiagram
  Animal <|-- Dog
…or as YAML front-matter:
---
config:
  layout: elk
---
flowchart LR
  A --> B --> C
Notes:
- The setting only affects the five graph-based types above. The other diagram types (sequence, gantt, sankey, mindmap, etc.) use their own dedicated layouts and ignore it.
- If ELK isn't available in your environment — or it can't lay out a particular graph — draw.io automatically falls back to Dagre so the diagram still renders.
See also our blog post on the Mermaid ELK layout option.
The Mermaid group
When you insert with Diagram selected, the result — whatever the diagram type — is always placed inside one special group cell that wraps all the generated shapes. Understanding this group is the key to working with editable Mermaid output. (For the Image option, see The Mermaid image.)
Its size is "transparent"
The group has no fill and no border — it is completely see-through. Its selection outline simply hugs the generated shapes with a small uniform margin (about 20 px) around them; there is no solid rectangle drawn on top of your diagram.
Because the bounds are transparent, only the actual shapes inside are clickable — clicking the empty margin around them clicks straight through to whatever is behind. The group itself stores no fixed width/height; its extent is derived from its contents, so it always grows and shrinks to fit the diagram.
The three corner icons
Select the group and three small icons appear at its top-left corner, arranged in an L-shape (the lock sits above the move icon in the corner column, with the pen to their right):
| Icon | What it does |
|---|---|
| ✛ Move | Drag this to move the whole diagram as a single unit. Because the group is transparent there is no body to grab, so this handle is how you reposition everything at once without disturbing the individual shapes. |
| 🔓 / 🔒 Lock / unlock | Toggles whether the group behaves as one locked block (see below). It shows an open padlock when unlocked (the default) and a closed padlock when locked. |
| ✎ Edit (pen) | Re-opens the Mermaid editor with the stored source so you can change the text and regenerate the diagram. |
Selecting the group vs. the shapes inside
By default the group is unlocked, which keeps every generated shape individually selectable:
- Select a single shape — just click it. You can restyle, relabel, resize or move individual shapes freely, exactly like any other draw.io cell.
- Select the whole group — click the move icon, or click an already-selected shape a second time to step "out" to the surrounding group, or
Alt-click, or lock the group (see below) so any click grabs the whole thing.
Drag the move icon, or first select the group (as above) and then drag it, to move everything together with relative positions preserved. Dragging an individual shape (while unlocked) moves only that shape.
The lock icon
Click the padlock to lock the group. While locked:
- Clicking any shape inside selects the entire group instead of the single shape — handy once you're done editing and just want to treat the diagram as one object you can't disturb by accident.
- Double-clicking anywhere on a locked group opens the Mermaid editor (same as the pen icon).
Click the padlock again to unlock and get back to selecting and editing individual shapes.
The edit icon — and where the Mermaid code is stored
The Mermaid source you typed is saved on the group itself, as a mermaidData attribute on the group cell. Because it's part of the cell, it is written into your .drawio file and travels with the diagram — so the diagram stays re-editable as Mermaid even after saving, closing and reopening, and even after you share the file.
The attribute holds a small JSON object — the data (your Mermaid source) and an optional config (a Mermaid configuration object, or null). Diagrams you insert are stored with config: null, so draw.io's built-in default Mermaid settings are applied every time the source is parsed.
You normally never need to touch the config, but if you do (for example to force a theme or tweak spacing), it can be edited by hand: right-click the group ▸ Edit Data… and edit the mermaidData value. Note that editing the data in this dialog only changes the stored text; use the pen icon to actually re-render the shapes.
To edit the source, click the pen (edit) icon (or double-click a locked group). The stored source opens in a text editor; change it and confirm, and draw.io re-parses the text and rebuilds the shapes inside the same group.
What survives when you re-edit the source
Re-editing the Mermaid text re-runs the parser and lays the diagram out again from scratch, then re-applies your per-shape edits on top. The rule of thumb: appearance is kept, position is not.
Kept — re-applied to each regenerated shape (matched by identity, as long as that node still exists in the new source):
- Style changes on individual shapes — fill/background colour, line/stroke colour and style, font colour and formatting, rounded corners, opacity, and so on. Both changes and removals are remembered.
- Manual relabels — if you renamed a shape on the canvas, that text is kept.
Not kept — always taken fresh from the new parse and layout:
- Geometry — position and size. The diagram is laid out again, so shapes you dragged or resized by hand return to the layout's coordinates.
- Edge routing and connection points — waypoints and which side an arrow attaches to are owned by the layout and recomputed every time.
- Shapes you added or deleted by hand, and any edits to a node that no longer exists in the new source.
In short: style your shapes freely and the styling follows them across edits — but treat layout (positions, sizes, routing) as Mermaid's, and change it through the source rather than by hand if you plan to keep editing the source.
The Mermaid image
If you choose Image in the dialog, draw.io renders the parsed diagram to a single SVG image and drops that one picture on the canvas (it is draw.io's own render of the same shapes the Diagram option would produce). Choose this when you want a fixed, self-contained picture rather than editable shapes — for example to keep a Mermaid diagram looking the same wherever the file is viewed, or for a host that expects an image.
- Hover over the image to see the Mermaid source in a tooltip.
- You can't select or style the individual shapes — it is one flat image. (You may want to give it a background fill, since some Mermaid themes draw in black and white.)
- Double-click the image to re-open the Mermaid editor with the stored source; edit the text and Apply, and draw.io re-renders the image in place — it stays an image rather than turning into editable shapes.
Like the group, the image carries its Mermaid source in a mermaidData attribute (data plus config: null), along with an optional border padding field (8 px by default). For the full workflow — inserting as an image, re-editing on double-click, and changing the border padding — see Insert as SVG to re-edit Mermaid code and Insert Mermaid diagram as an image.
Legacy diagrams: older draw.io files that stored Mermaid output as a static image still open as images, and on double-click they re-render as an image rather than being converted into an editable group (using the older default Mermaid configuration — a
neutraltheme plus specific sequence- and Gantt-diagram spacing — so they keep their original look). If you want editable shapes from such a file, copy the Mermaid source from the editor that opens on double-click and re-insert it with Diagram selected.
Mermaid syntax
Diagrams are created by linking text labels using arrow connectors. You can choose different shapes, add labels to connectors, and style connectors and shapes.
Mermaid documentation for the complete syntax and styling options
| Feature | Syntax examples | |
|---|---|---|
| Shape styles | [rectangle] | (rounded rectangle) |
((circle)) | {diamond} | |
| Connector styles | arrow: A-->B | dotted: A-.-->B |
no arrow: A---B | with a label: A-->|label|B | |
| Diagram types | graph | pie |
gantt | sequenceDiagram | |
stateDiagram | classDiagram | |
gitgraph | flowchart | |
mindmap | requirementDiagram | |
erDiagram | journey | |
C4Context | ||
| Gantt | task state: done, active, crit, after | section |
| Pie | title | |
| Gitgraph | actions: commit, branch, checkout, merge | |
| UML | lifelines:participant | activate |
containers: loop, alt, opt | class | |
| Information | comment: %% | note |
Look at the examples below to see how the Mermaid syntax is used to define a variety of diagrams in text. Open these example Mermaid diagrams in draw.io.
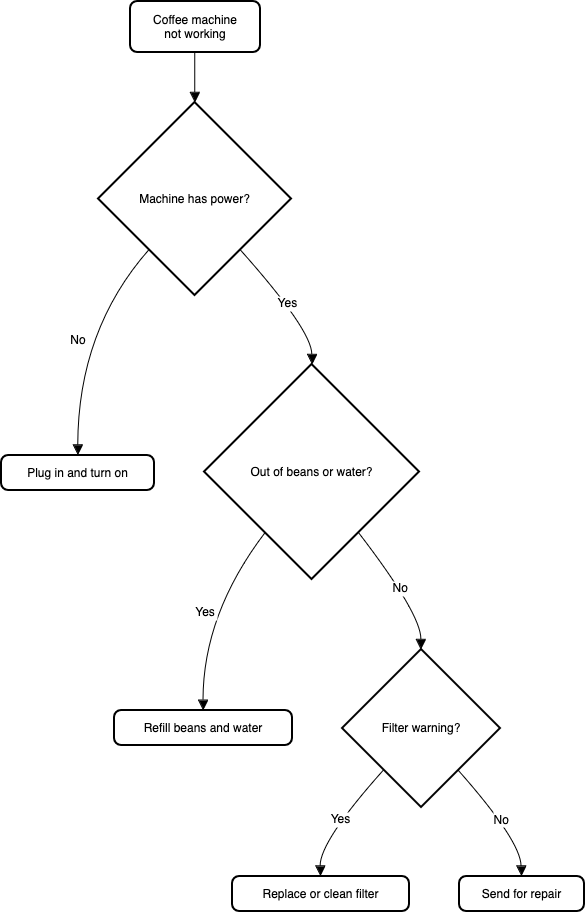
Flowchart
Labels can include new lines for a cleaner flowchart layout.
graph TD
   A(Coffee machine <br />not working) --> B{Machine has power?}
   B -->|No| H(Plug in and turn on)
   B -->|Yes| C{Out of beans or water?} -->|Yes| G(Refill beans and water)
   C -->|No| D{Filter warning?} -->|Yes| I(Replace or clean filter)
   D -->|No| F(Send for repair)
Open this example in our online diagram viewer
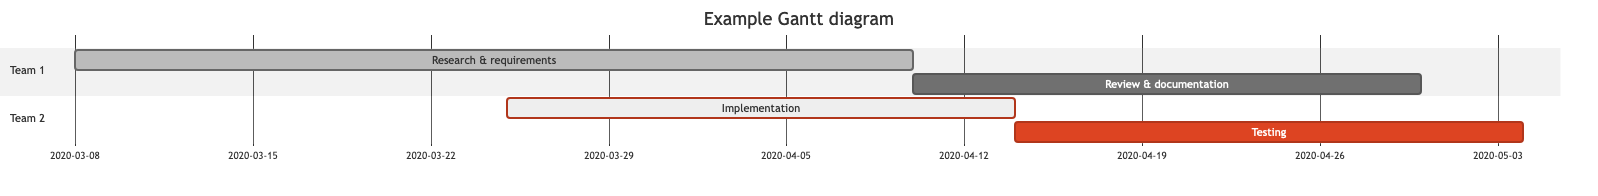
Gantt chart
Gantt charts are beloved by many project managers as they can keep track of the tasks, dependencies and timetable of their projects. While it can be fiddly to create a Gantt chart in draw.io, generating one is much easier when it's from a text description.
gantt
 title Example Gantt diagram
    dateFormat  YYYY-MM-DD
    section Team 1
    Research & requirements :done, a1, 2020-03-08, 2020-04-10
    Review & documentation : after a1, 20d
    section Team 2
    Implementation      :crit, active, 2020-03-25  , 20d
    Testing      :crit, 20d
Open this example in our online diagram viewer
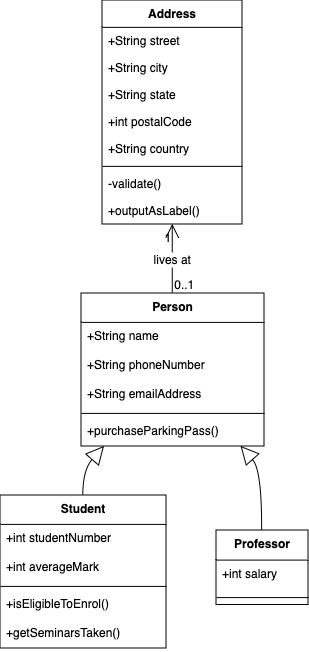
UML class diagram
The following is how the simple UML class diagram template from draw.io would look in Mermaid syntax.
classDiagram
   Person <|-- Student
   Person <|-- Professor
   Person : +String name
   Person : +String phoneNumber
   Person : +String emailAddress
   Person: +purchaseParkingPass()
   Address "1" <-- "0..1" Person:lives at
   class Student{
      +int studentNumber
      +int averageMark
      +isEligibleToEnrol()
      +getSeminarsTaken()
    }
    class Professor{
      +int salary
    }
    class Address{
      +String street
      +String city
      +String state
      +int postalCode
      +String country
      -validate()
      +outputAsLabel()
    }
Open this example in our online diagram viewer
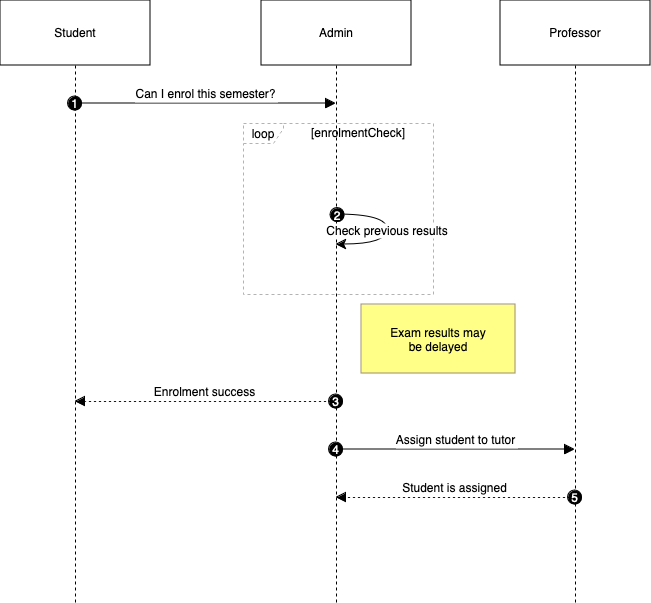
UML sequence diagram
UML sequence diagrams are used to show the steps taken and the actors involved in completing a process. These diagrams are heavily used in software development.
sequenceDiagram
    autonumber
    Student->>Admin: Can I enrol this semester?
    loop enrolmentCheck
        Admin->>Admin: Check previous results
    end
    Note right of Admin: Exam results may <br /> be delayed
    Admin-->>Student: Enrolment success
    Admin->>Professor: Assign student to tutor
    Professor-->>Admin: Student is assigned
Open this example in our online diagram viewer
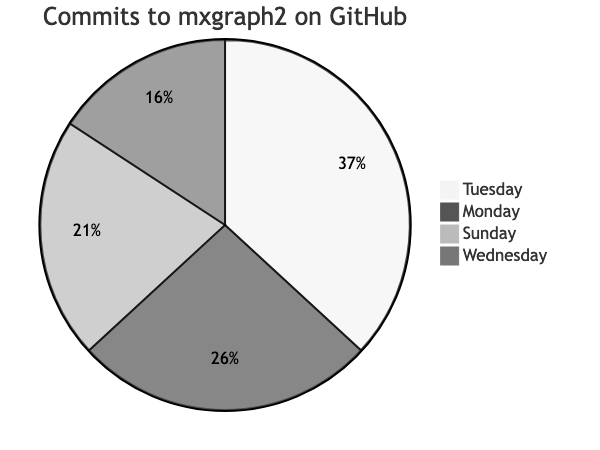
Pie chart
While you can build a pie chart manually draw.io, using the Mermaid syntax makes it very easy to get exactly the correct distribution of pie slices. In the Mermaid code, you can either use percentage values, or the actual value of each group. In the example below, you can see which days are the busiest for commits to the draw.io main repository on GitHub.
pie title Commits to mxgraph2 on GitHub
	"Sunday" : 4
	"Monday" : 5
	"Tuesday" : 7
  "Wednesday" : 3
Open this example in our online diagram viewer
See all of the elements you can insert into your diagram
Tip: We've recently updated draw.io to support the new Mermaid ELK layout option that can create neater more compact versions of large and complex flowcharts.