Types of diagrams that use container tables
Container table cells can hold shapes and images, so there are many different ways you can use them in diagrams. Here are some of the more common diagram types that can take advantage of draw.io's container tables.
Story mapping
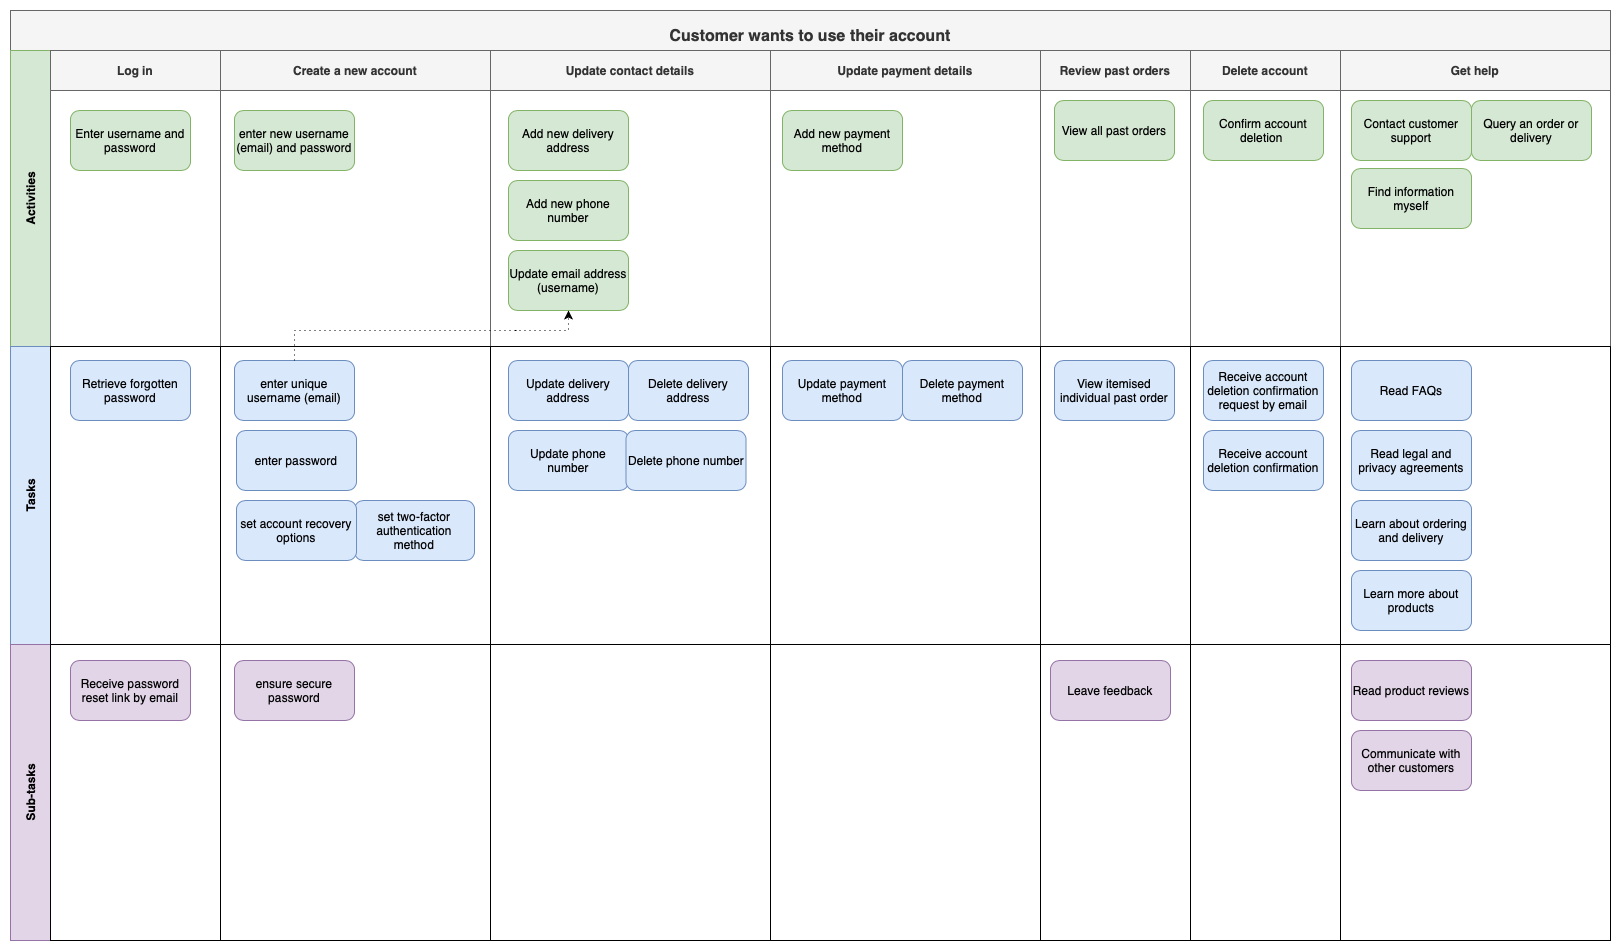
User stories and story mapping visualise how a customer uses your system or steps through your processes by organising their tasks and steps into table cells.
Swimlane diagrams
These flowcharts with multiple lanes are one of the most common types of diagram that use tables with container cells, clearly visualising the separation of roles in a workflow.
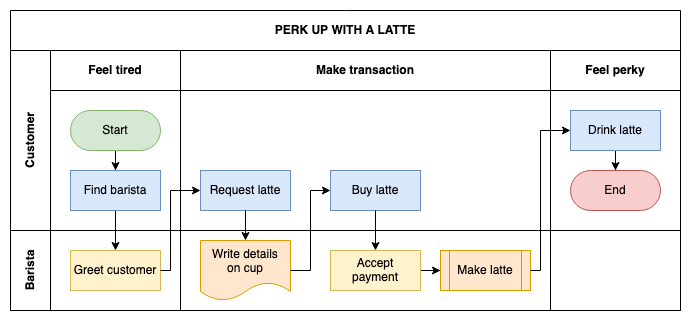
Cross-functional flowcharts take this one step further and have two categories for each task instead of the swimlanes.
BPMN diagrams
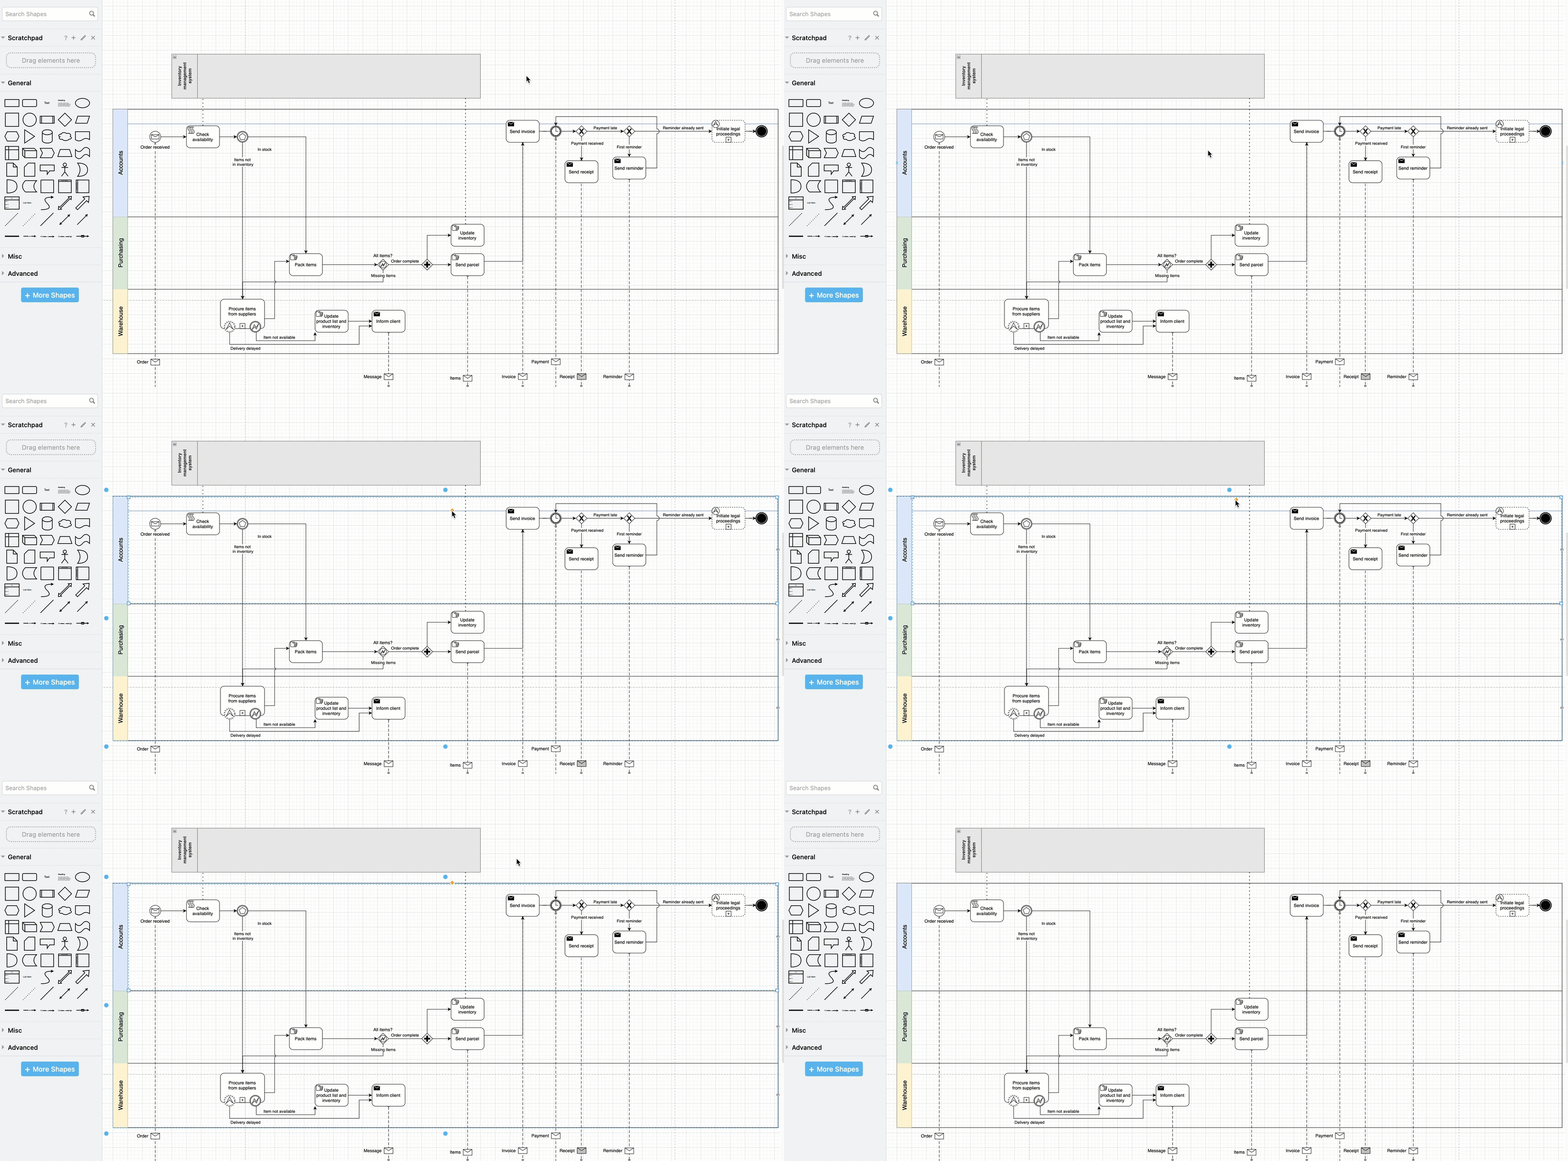
Business workflows using the BPMN notation are a specific form of swimlane diagram, one that often use swimlane container shapes and pools of swimlanes to indicate roles in a workflow. They can be just as easily drawn in a container table in draw.io, one column wide.
To get rid of the column header, select that column, then drag the orange diamond grab handle to line it up with the top edge of that column.
UML activity diagrams
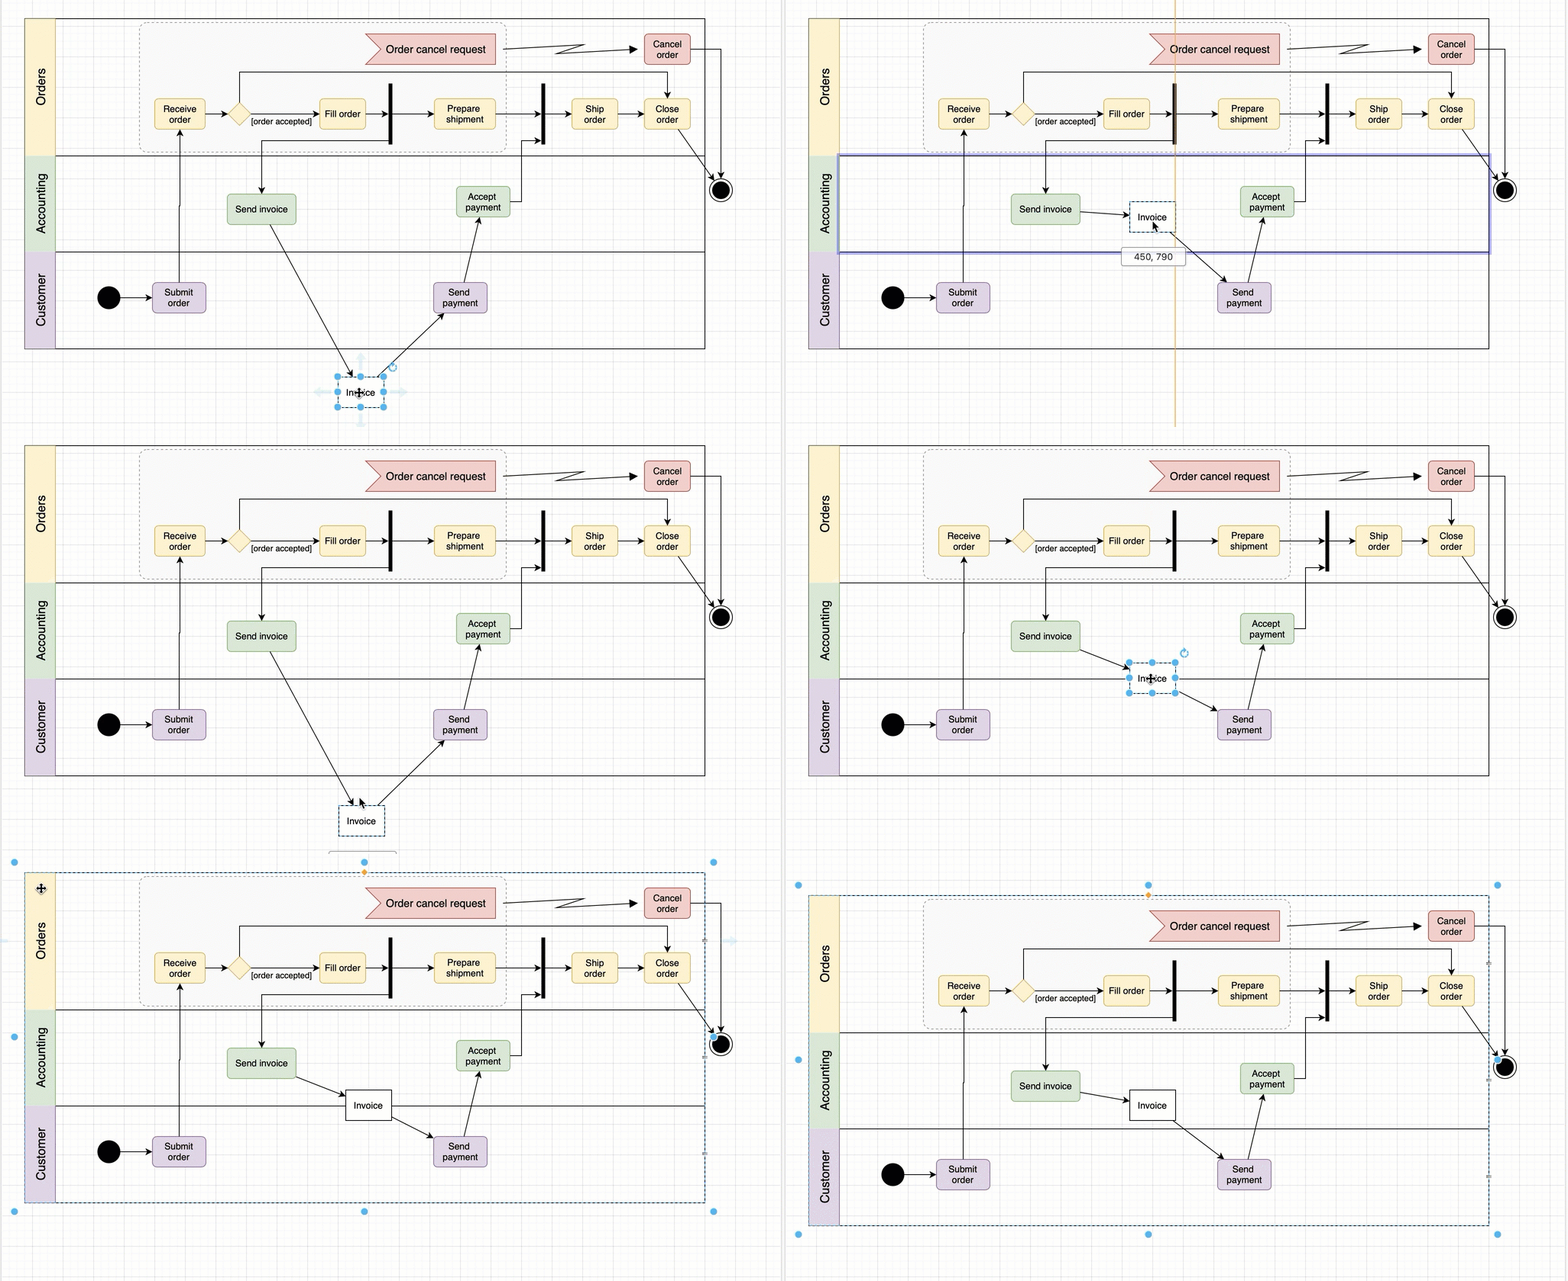
Similarly, UML activity diagrams can be drawn in a table with container cells.
For deliverables that need to move between actors, but not be placed inside any row, hold down Alt as you drop the shape to overlay it on top. Note that this shape will not move with the table unless you group the table and the shape together.
Kanban boards
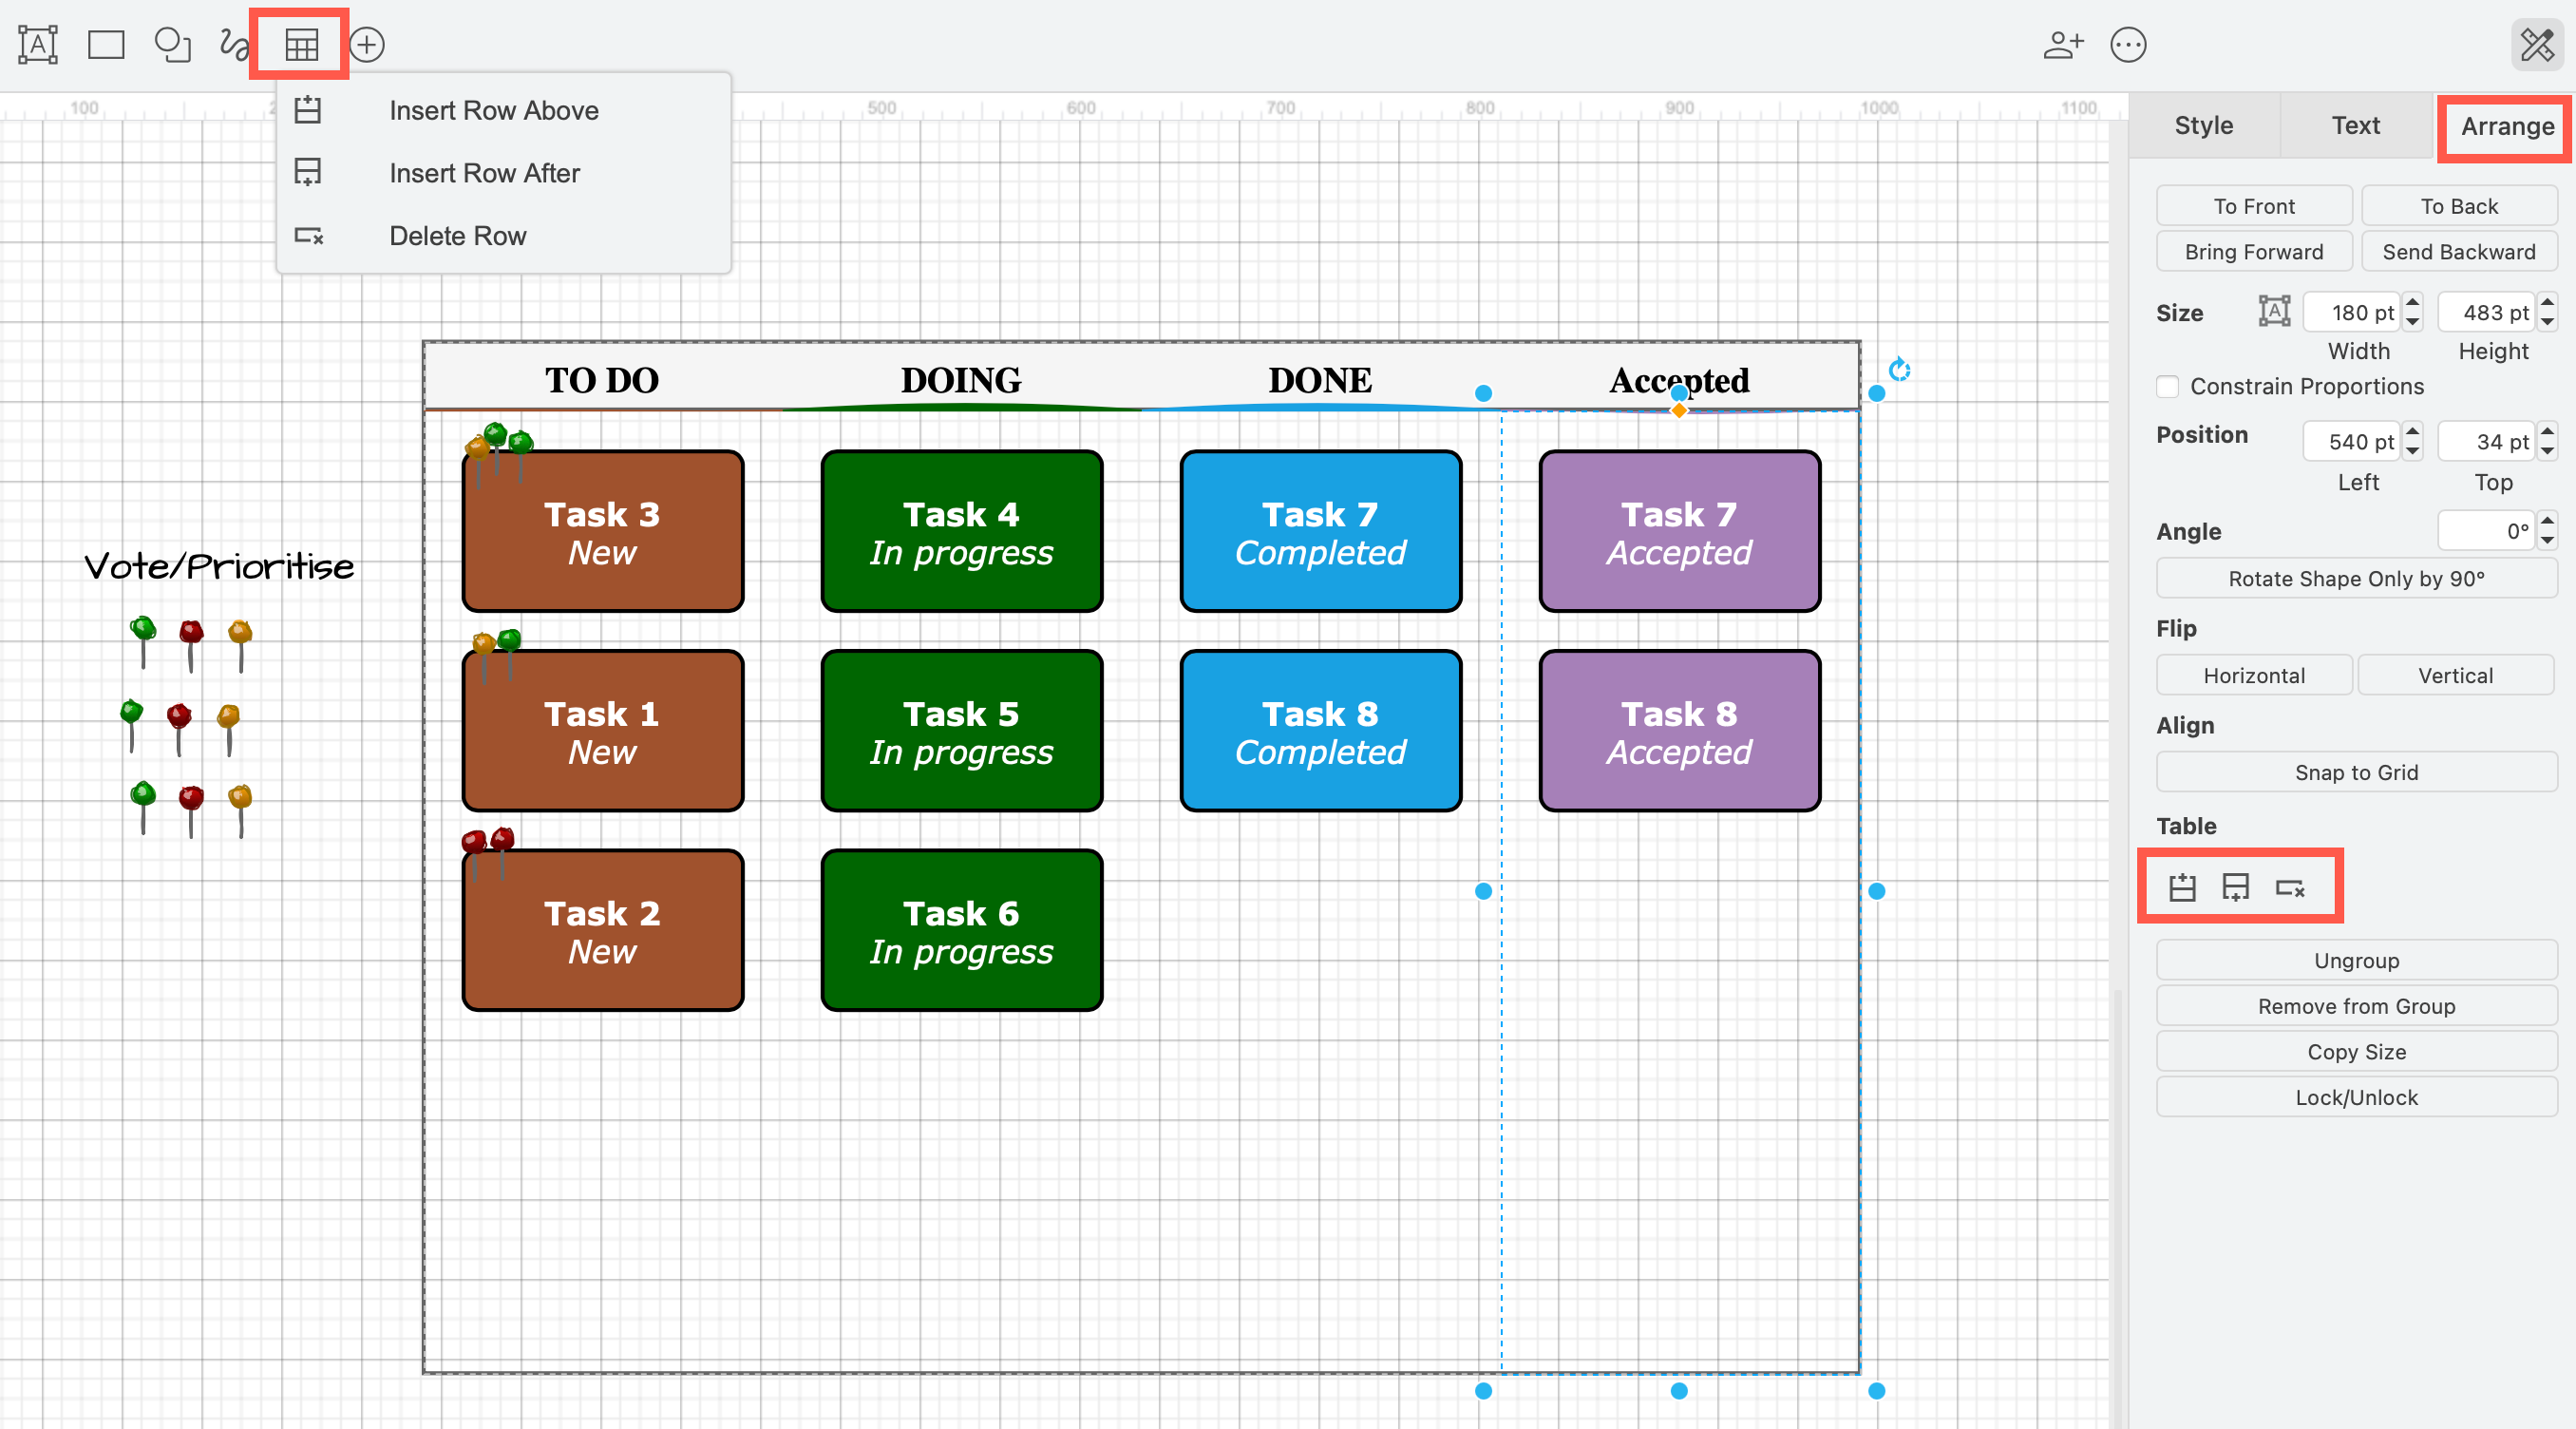
The simple Kanban board in our template library has automatic labelling and colours for the different status of tasks. It uses a slightly modified version of the table tool and placeholders to automatically update a task status and colour based on its column.
- Click on the + in the toolbar and select Template, or select Arrange > Insert > Template.
- Select the Simple Kanban Board template, and select Insert.
Use the table tools to add and delete tasks inside each vertical Kanban lane.
Do more with traditional tables
You can add and use a normal tables - without enabling the Container checkbox in the table tool - just as you would in a word processor app. But you can do more with these traditional tables in a diagram editor.
The simpler tables let you quickly present data, style and add icons, and prepare neat graphics for your documentation and presentation slides.
Gantt charts and timelines
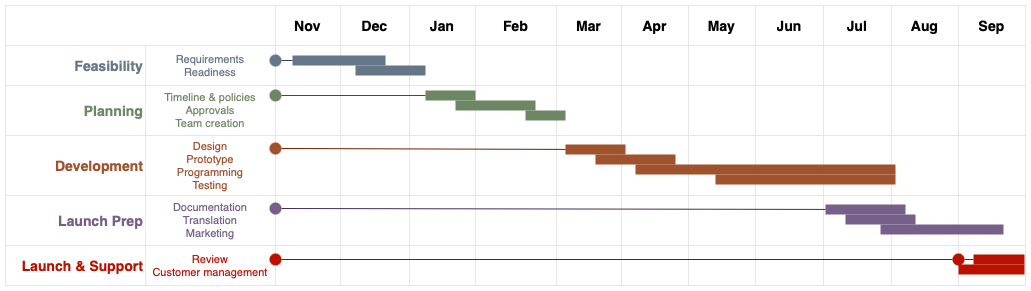
It's quick and easy to build (and expand) a Gantt chart or timeline with overlaid shapes to visualise task lengths and start/end dates.
Business model canvas
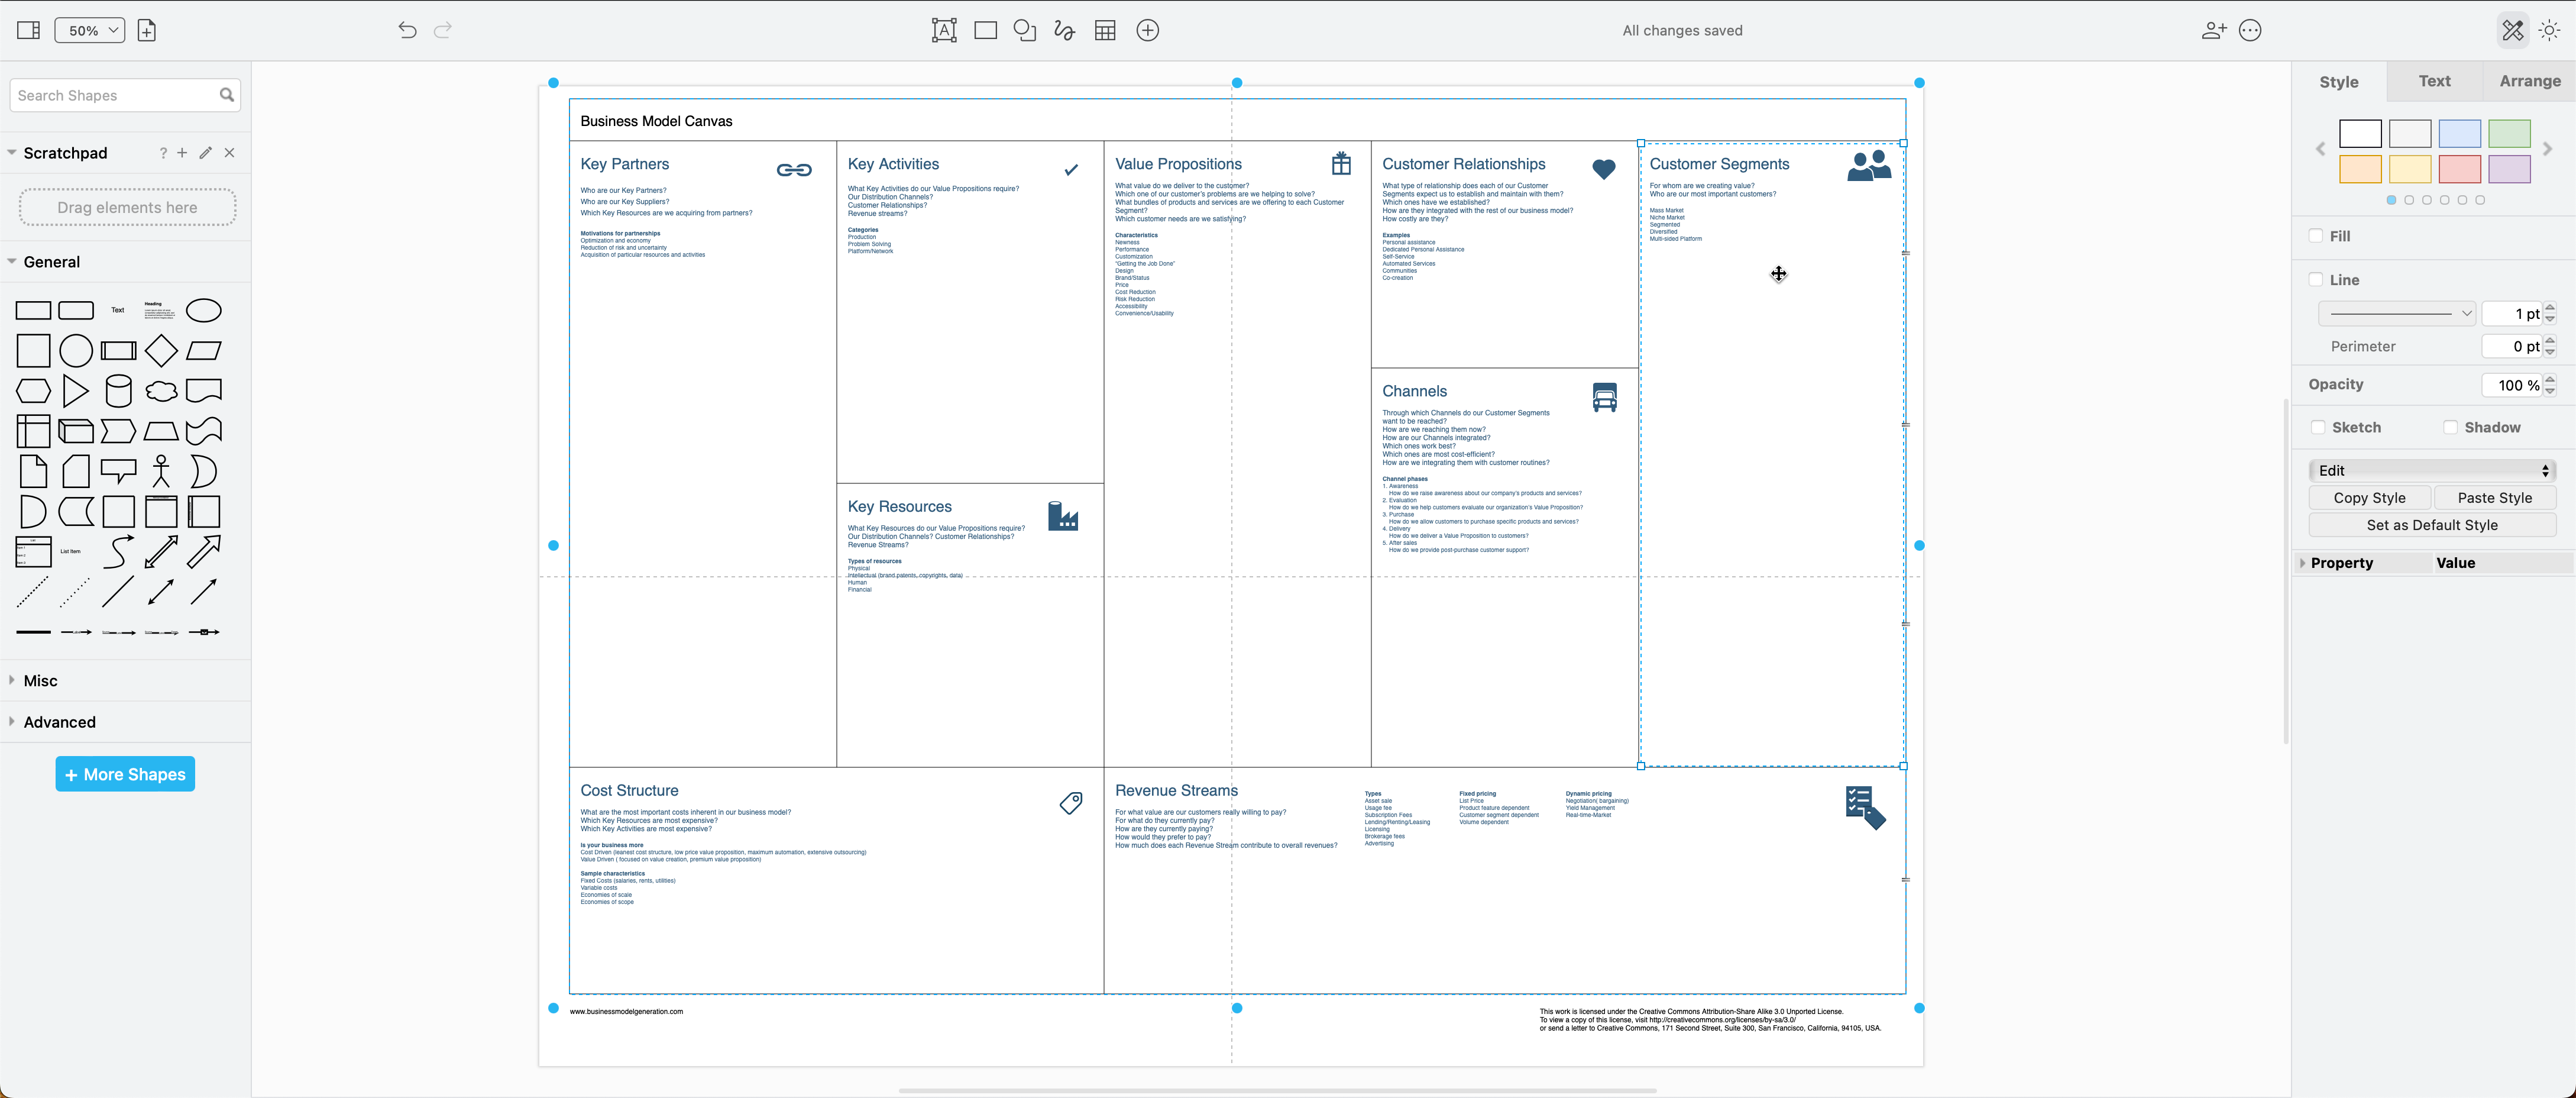
Any diagram that uses a table-like structure may be easier to work with when using an actual table in draw.io. Like the following business model canvas, where the diagram from our template library has been converted to use a table instead of individual shapes for each section.
Bar graphs
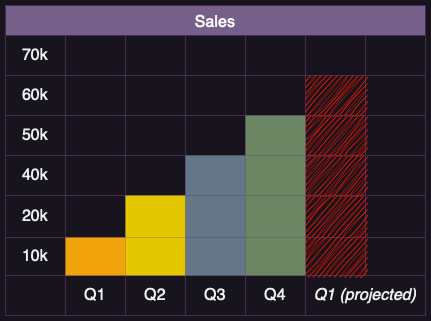
While draw.io is not a spreadsheet or charting application, you can colour the background of table cells to quickly and neatly create hand-drawn bar graphs for documentats and presentations. Select the table cell(s), and choose a Fill colour in the Style tab of the format panel.
Presentation graphics
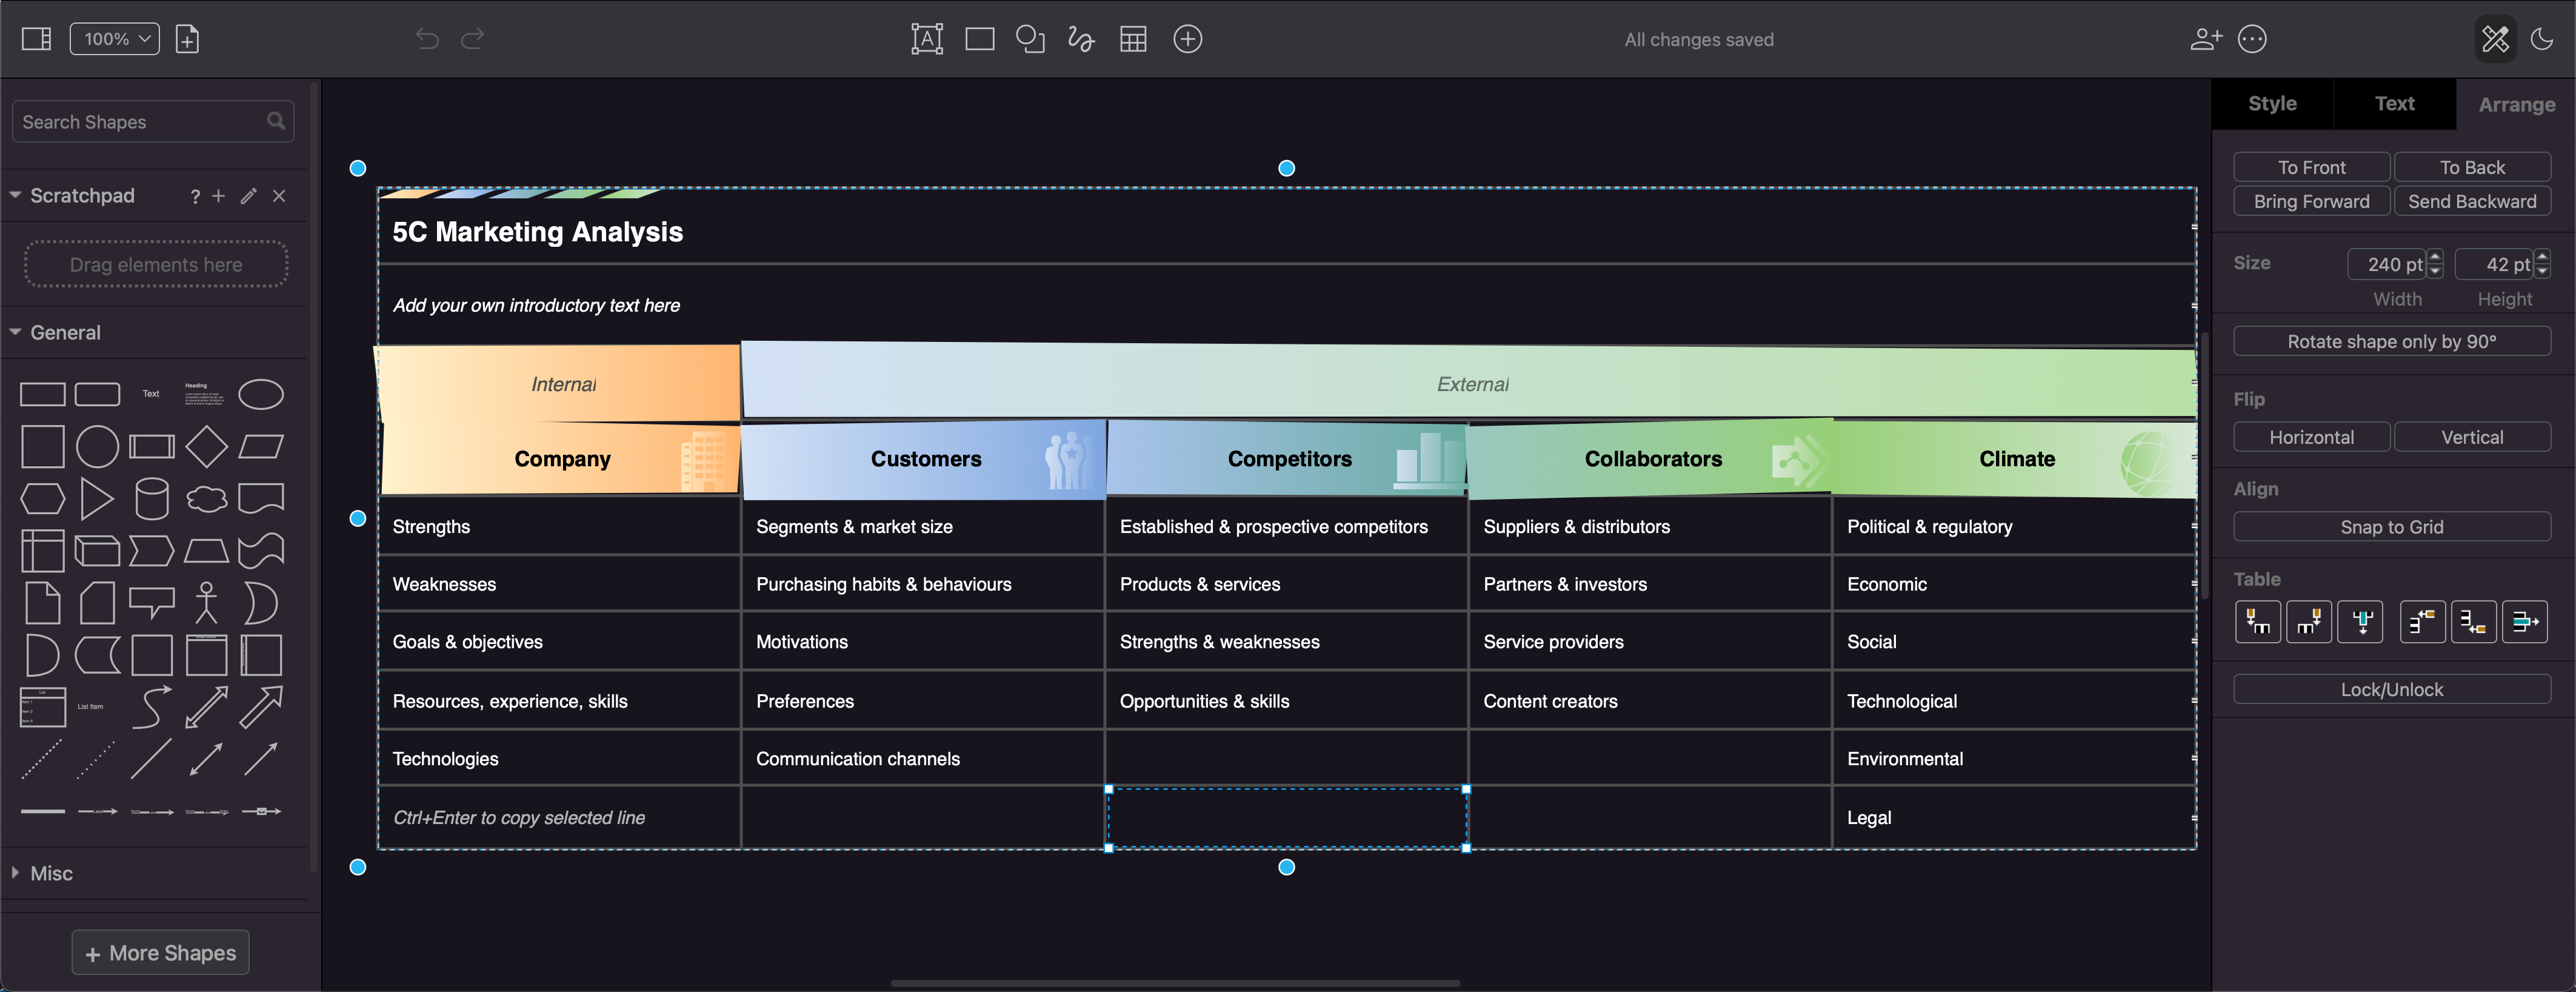
You can, of course, use tables in draw.io to present a lot of text information. Add icons, styling and position everything nicely to create graphics for a presentation or intranet. This 5C marketing analysis was converted to use a simple table - in the original post, we had used list shapes.