Mermaid syntax and examples
Here are some example mermaid diagrams and how they appear when they are generated in draw.io. For a more detailed example, see the Mermaid mindmap tutorial on the following page.
Each Mermaid diagram type has different shapes it can use, in addition to various connector and shape styles. The diagram type also dictates how the source needs to be structured - for example, a class diagram requires curly brackets { } around each class definition.
Refer to the Mermaid documentation for the complete syntax and styling options
| Feature | Syntax examples | |
|---|---|---|
| Diagram types | graph, pie, gantt, sequenceDiagram, stateDiagram, classDiagram, erDiagram, journey, C4Context, ... | |
| Shapes | done, active, crit, after, section | Gantt |
title | Pie | |
actions (commit, branch, checkout, merge) | Gitgraph | |
lifelines (participant, activate), containers (loop, alt, opt), class | UML | |
comment (%%), note | Information | |
| Shape styles | [rectangle], (rounded rectangle), ((circle)), {diamond} | |
| Connector styles | arrow: A-->Bdotted: A-.-->Bno arrow: A---Bwith a label: A-->|label|B |
Look at the examples below to see how the Mermaid syntax is used to define and style a variety of diagrams.
Flowchart
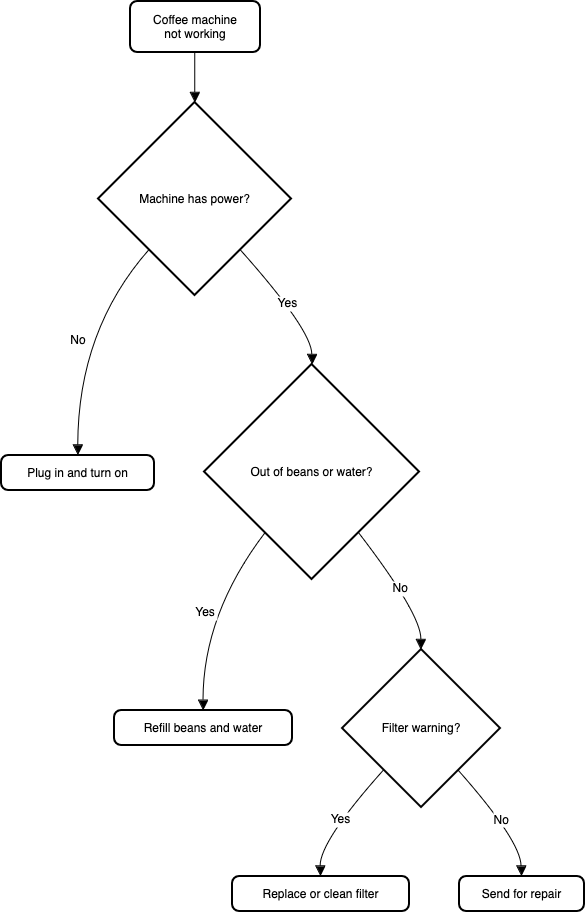
Labels can include new lines for a cleaner flowchart layout.
graph TD
   A(Coffee machine <br />not working) --> B{Machine has power?}
   B -->|No| H(Plug in and turn on)
   B -->|Yes| C{Out of beans or water?} -->|Yes| G(Refill beans and water)
   C -->|No| D{Filter warning?} -->|Yes| I(Replace or clean filter)
   D -->|No| F(Send for repair)
Open this example in our online diagram viewer
Gantt chart
Gantt charts are beloved by many project managers as they can keep track of the tasks, dependencies and timetable of their projects. While it can be fiddly to create a Gantt chart in draw.io, generating one is much easier when it's from a text description.
gantt
 title Example Gantt diagram
    dateFormat  YYYY-MM-DD
    section Team 1
    Research & requirements :done, a1, 2020-03-08, 2020-04-10
    Review & documentation : after a1, 20d
    section Team 2
    Implementation      :crit, active, 2020-03-25  , 20d
    Testing      :crit, 20d

Open this example in our online diagram viewer
UML class diagram
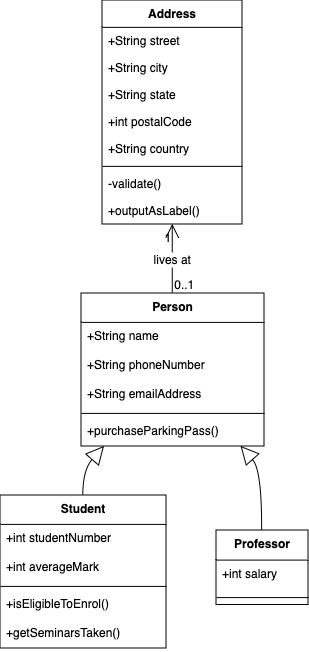
The following is how the simple UML class diagram template from draw.io would look in Mermaid syntax.
classDiagram
   Person <|-- Student
   Person <|-- Professor
   Person : +String name
   Person : +String phoneNumber
   Person : +String emailAddress
   Person: +purchaseParkingPass()
   Address "1" <-- "0..1" Person:lives at
   class Student{
      +int studentNumber
      +int averageMark
      +isEligibleToEnrol()
      +getSeminarsTaken()
    }
    class Professor{
      +int salary
    }
    class Address{
      +String street
      +String city
      +String state
      +int postalCode
      +String country
      -validate()
      +outputAsLabel()
    }
Open this example in our online diagram viewer
UML sequence diagram
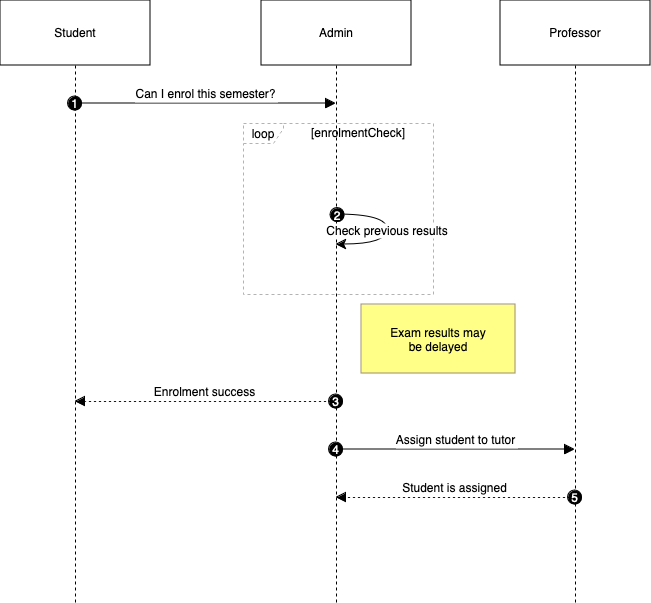
UML sequence diagrams are used to show the steps taken and the actors involved in completing a process. These diagrams are heavily used in software development.
sequenceDiagram
    autonumber
    Student->>Admin: Can I enrol this semester?
    loop enrolmentCheck
        Admin->>Admin: Check previous results
    end
    Note right of Admin: Exam results may <br /> be delayed
    Admin-->>Student: Enrolment success
    Admin->>Professor: Assign student to tutor
    Professor-->>Admin: Student is assigned
Open this example in our online diagram viewer
Pie chart
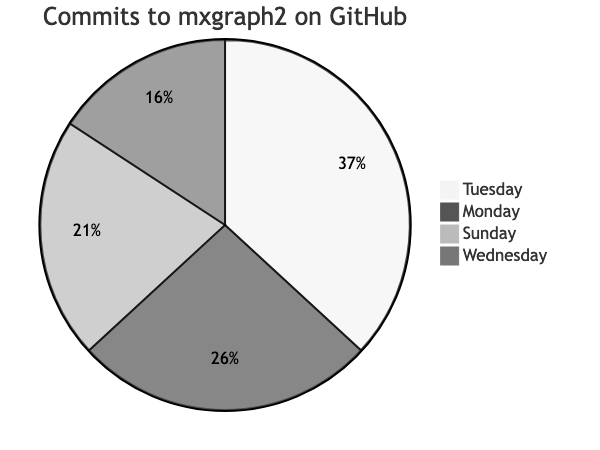
While you can build a pie chart manually draw.io, using the Mermaid syntax makes it very easy to get exactly the correct distribution of pie slices. In the Mermaid code, you can either use percentage values, or the actual value of each group. In the example below, you can see which days are the busiest for commits to the draw.io main repository on GitHub.
pie title Commits to mxgraph2 on GitHub
	"Sunday" : 4
	"Monday" : 5
	"Tuesday" : 7
  "Wednesday" : 3
Open this example in our online diagram viewer
Related
See also the more detailed walkthrough for creating mindmaps in Mermaid.