Swap and replace shapes and connectors

· 3 min read

You can swap shapes on the drawing canvas in draw.io via the Arrange tab of the format panel, or by dropping a new shape from the shape libraries on top of an existing shape. You can also reverse the arrows on a connector easily via the Arrange tab.

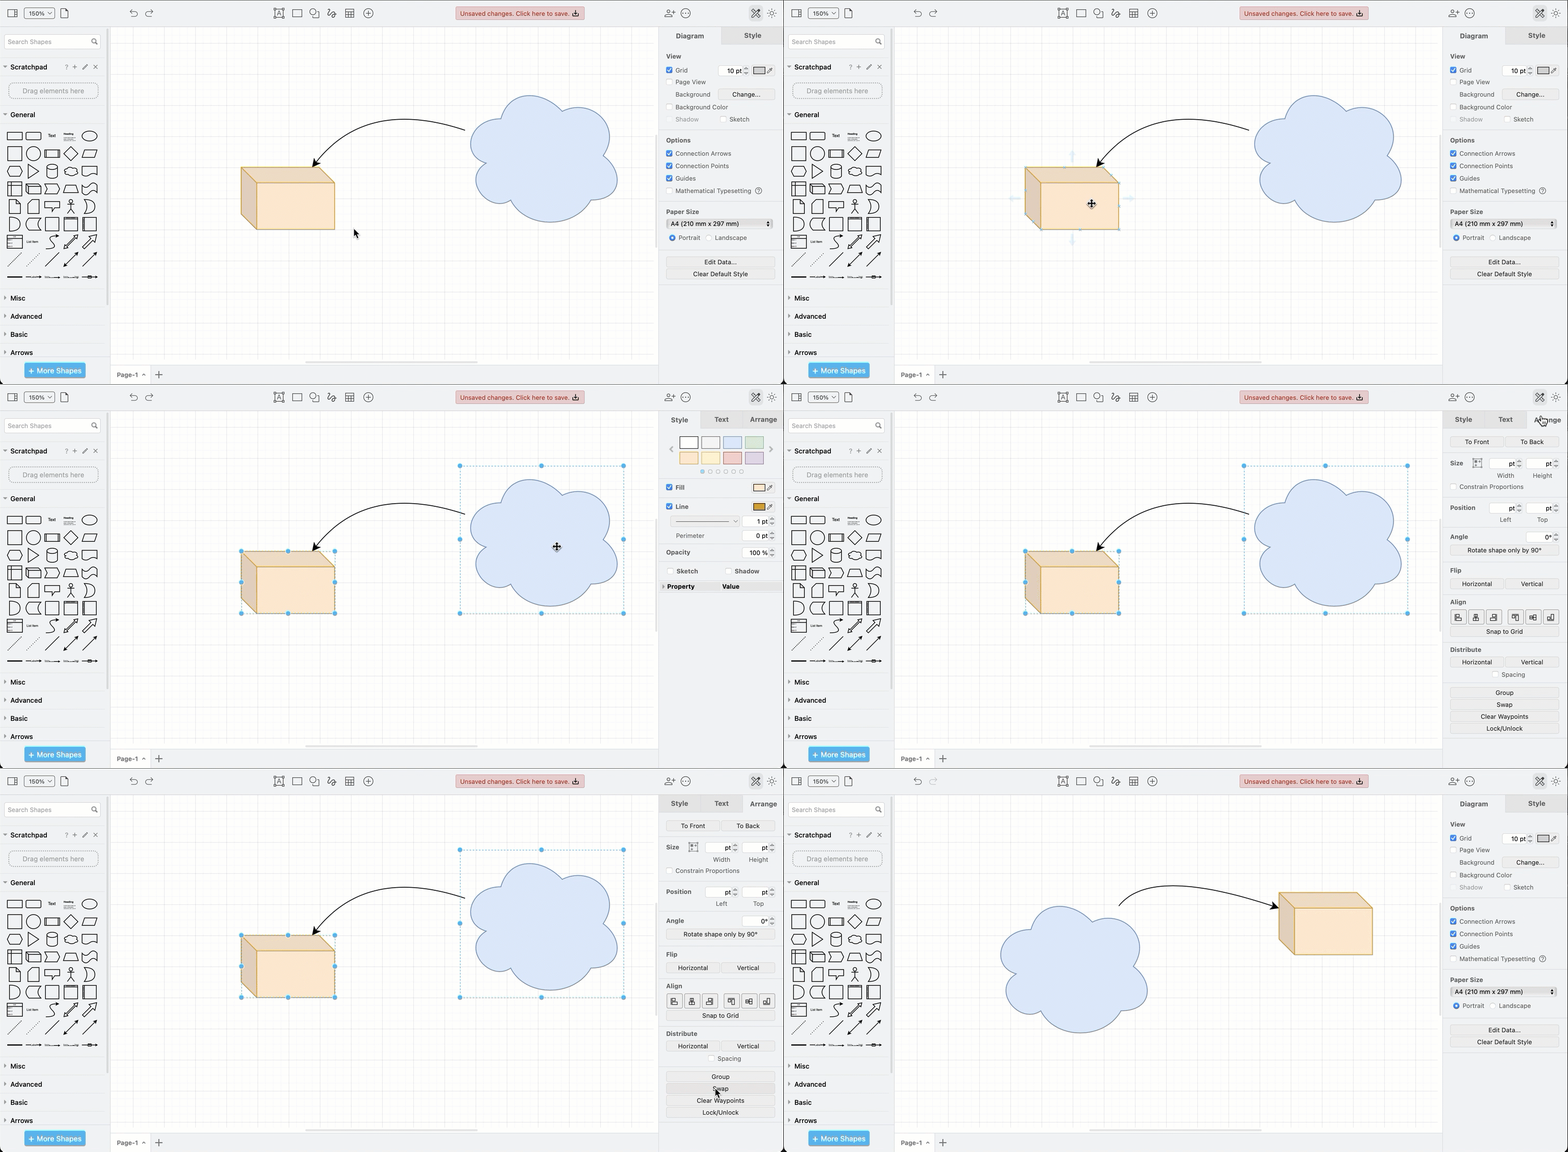
Select two shapes, go to the Arrange tab of the format panel and click Swap

Connectors to and from a swapped shape will move with it, staying attached and automatically updating its path.

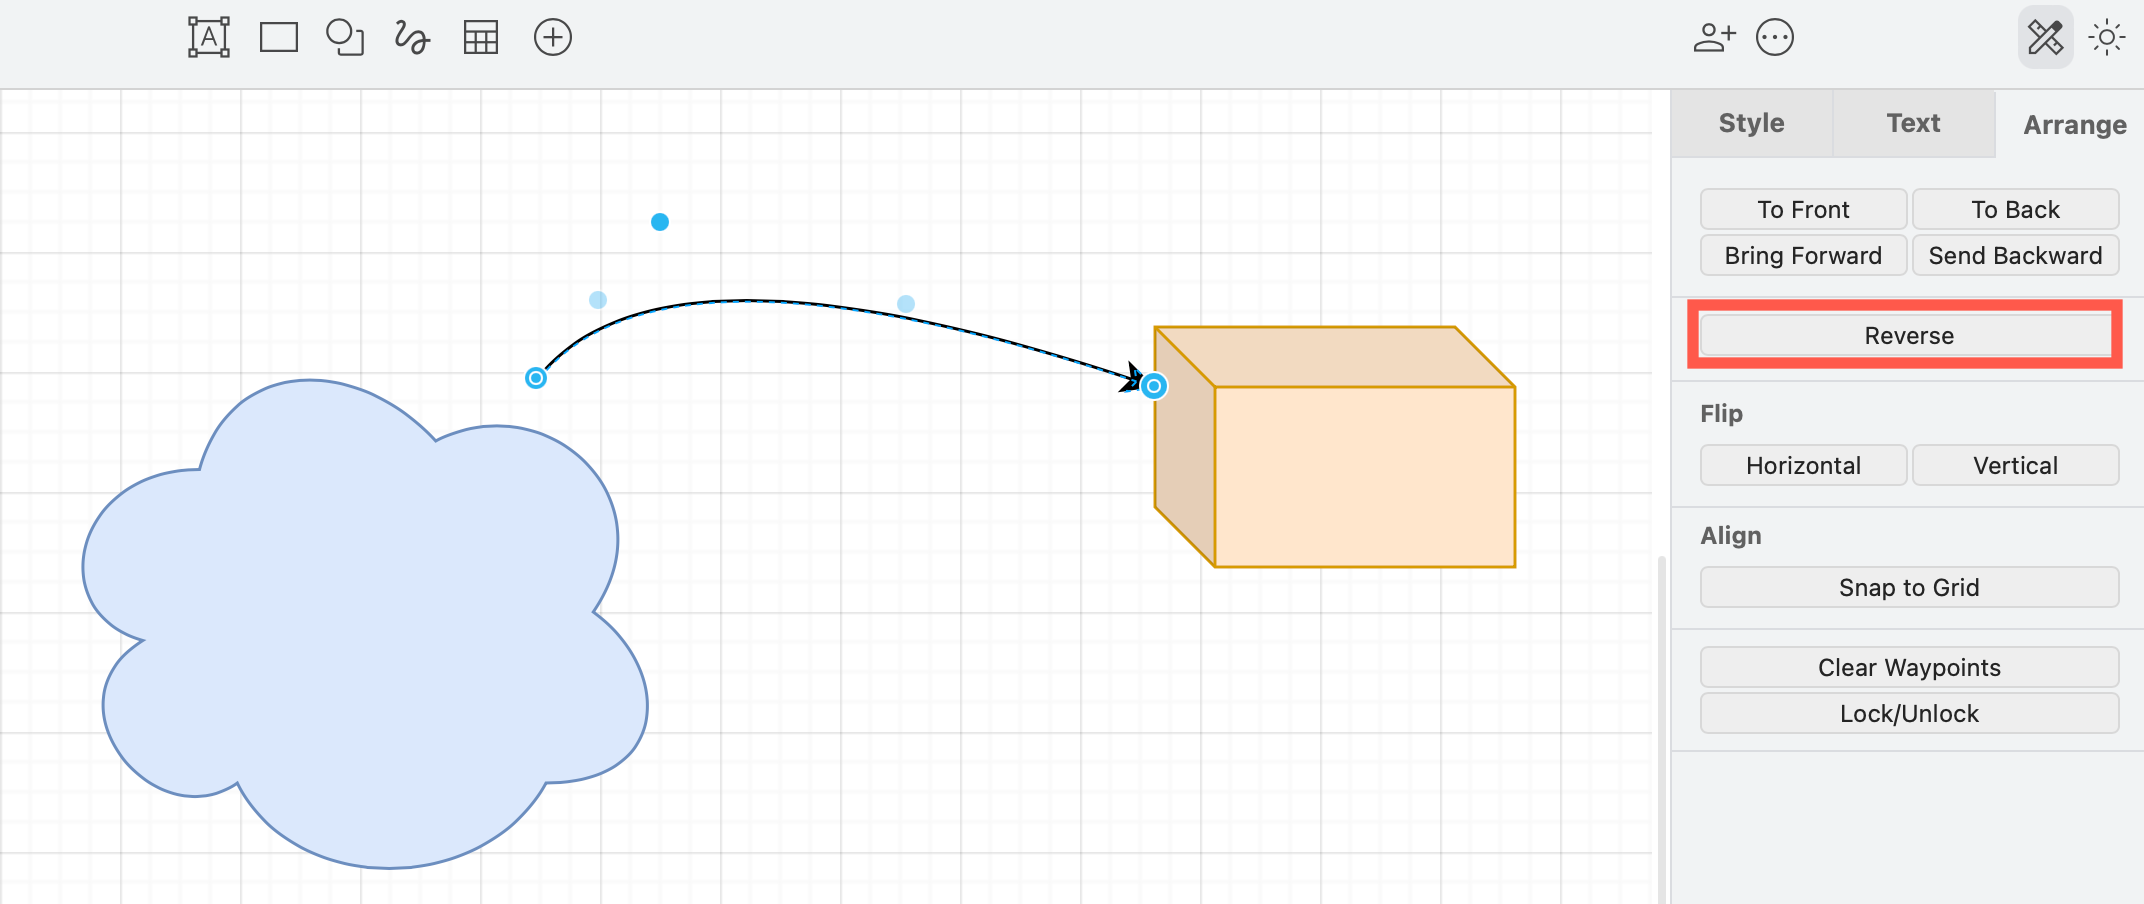
If you want to swap the direction of the connector as well, select the connector after you swap the shapes, then click Reverse on the Arrange tab of the format panel.

Hold down shift and drag one shape over another shape to swap them

Replace an existing shape with a different shape

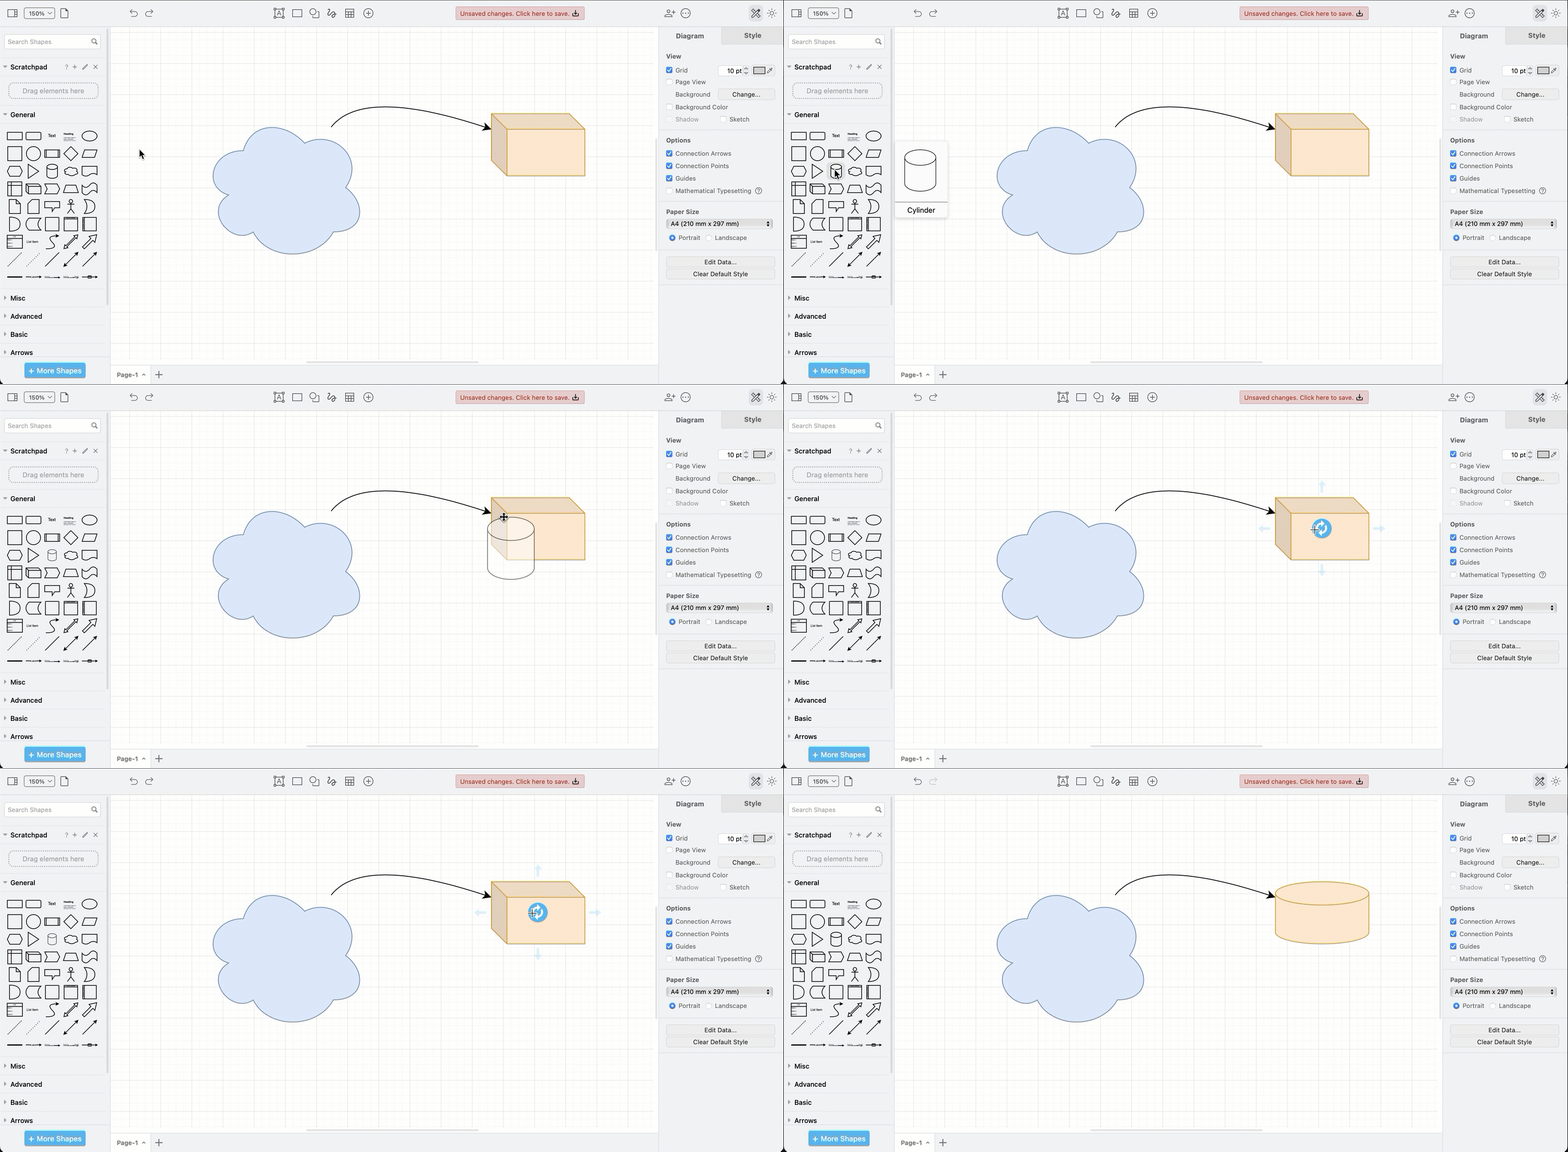
Drag a shape from the shape libraries and hover over an existing shape on the drawing canvas until the replace symbol appears, then drop the shape.
Drag a new shape from the shape library in draw.io and drop it onto an existing shape to replace it

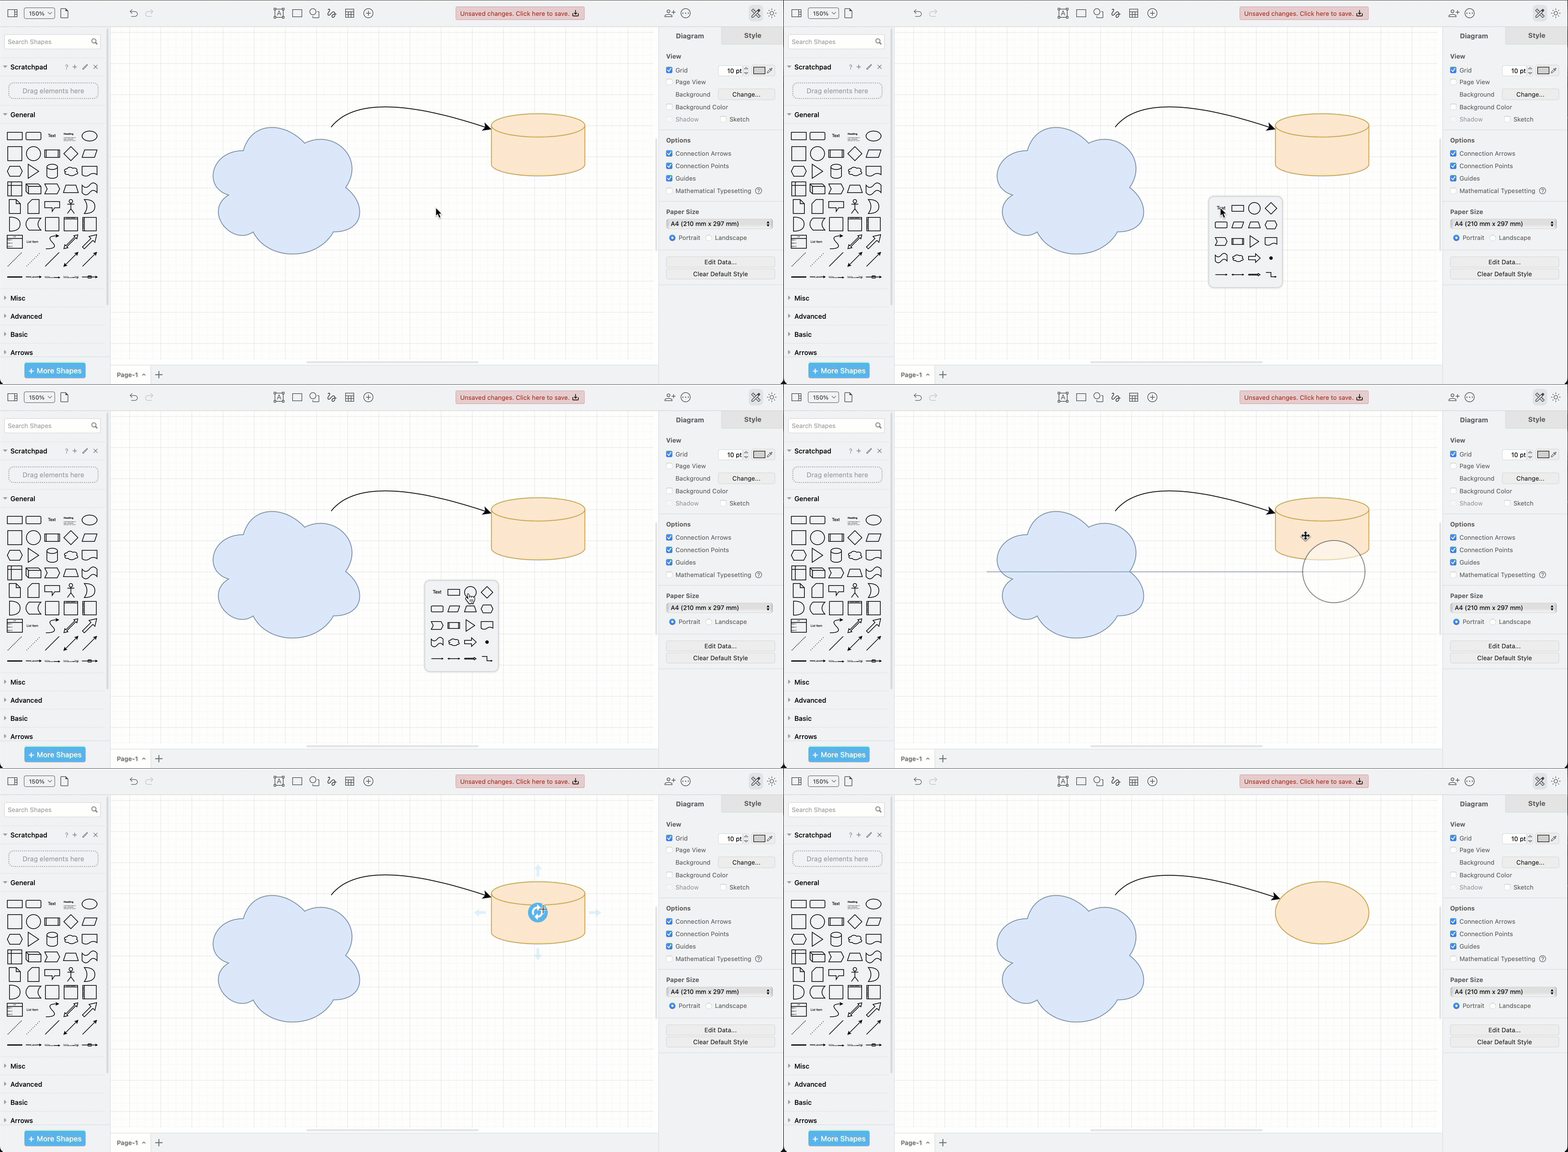
Alternatively, double-click on an empty spot on the drawing canvas to open the quick selection box and drag a shape from there over an existing shape, and drop it when the replace symbol appears.
Drag a new shape from the shape library in draw.io and drop it onto an existing shape to replace it

Do more with shapes in draw.io

There are many more ways you can quickly work with shapes in draw.io. Use these FAQs, tutorials and blog posts to learn how to diagram faster and easier.

Work faster with shape libraries using keyboard shortcuts, and use keyboard + mouse modifier shortcuts to work with shapes faster on the drawing canvas.

Use the Arrange tab tools on shapes and connectors - move shapes forwards and backwards, group multiple shapes, resize shapes and groups of shapes, reposition shapes, rotate shapes and groups of shapes, and work with connector waypoints to perfectly path your connectors.

Style shapes using the Style tab in the format panel. The styles that are available will depend on the shapes you have selected.
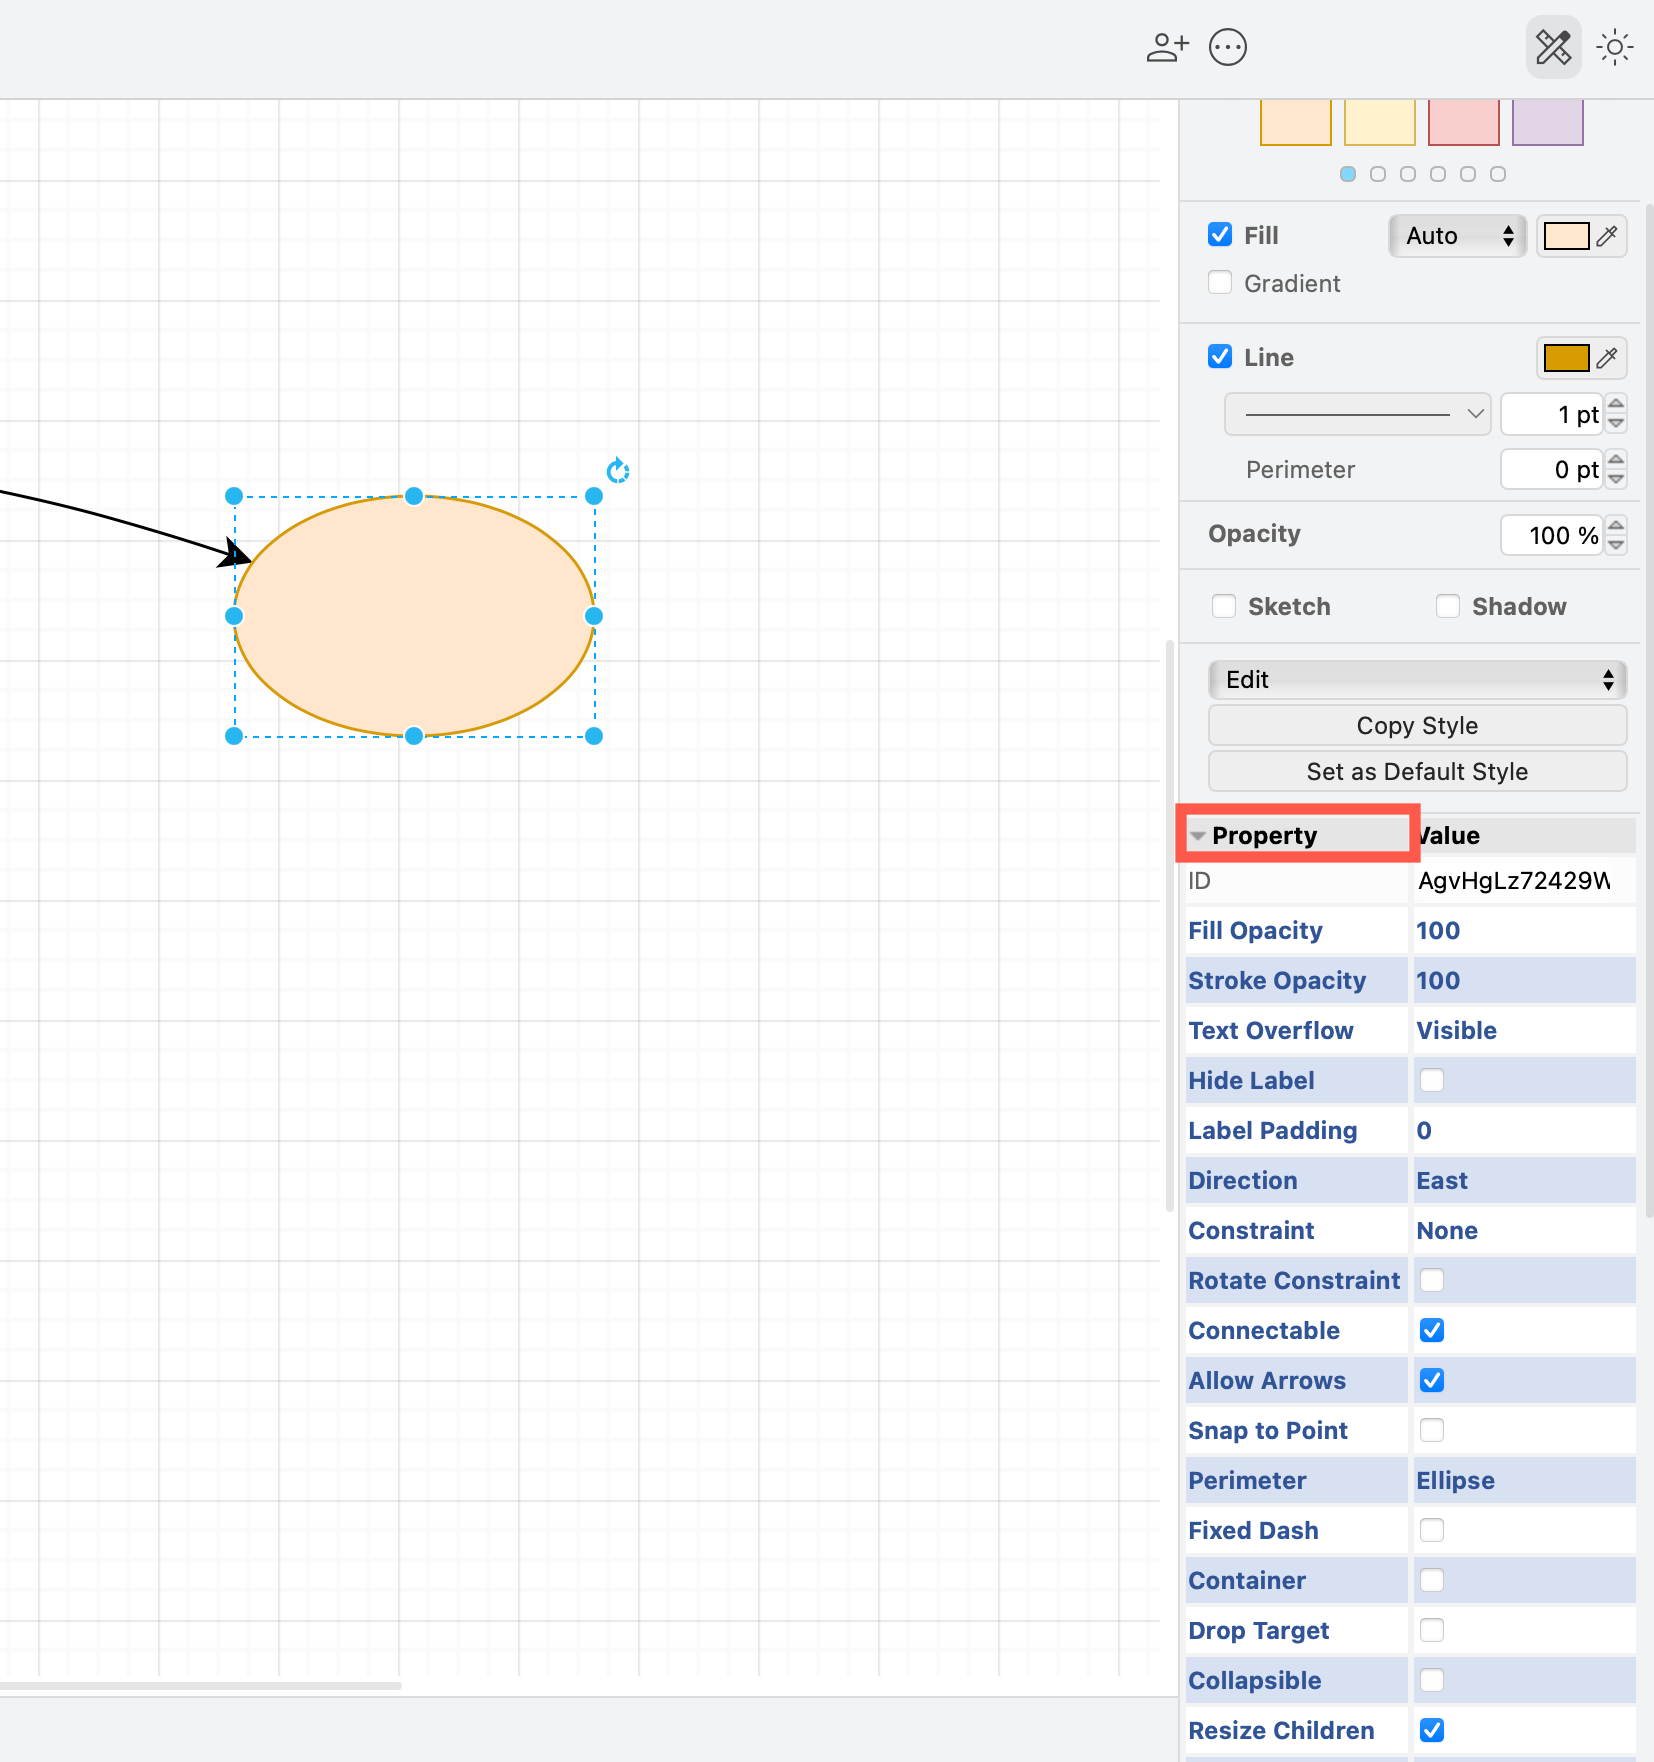
See how you can modify the shape properties in the Style tab of a selected shape to turn a shape into a container, change the perimeter, disallow connectors, prevent it from being deleted or clones, and much more. Select a shape and click on Properties at the bottom of the style tab.
Drag a new shape from the shape library in draw.io and drop it onto an existing shape to replace it

And finally, print out these draw.io keyboard shortcuts for easy reference.

New keyboard shortcuts in draw.io

· 3 min read

As new features are added to draw.io and the menu is refined, new keyboard shortcuts are also built into the editor. Here are some of the new and useful shortcuts for diagramming in draw.io.

Move selected remote shapes and connectors

Select the shapes and connectors you want to move, then hold Shift+Alt+drag and drag the cursor to reposition the selection even if it is not currently under the cursor.
Press Shift+Alt and drag the cursor to move a selected shape, even if your cursor is not over that shape

Increase/decrease font size

Select a shape or connector or label, and press Ctrl+Shift +/- (NumPad) to increase or decrease the text size. This only works with the + and - keys on the number pad.
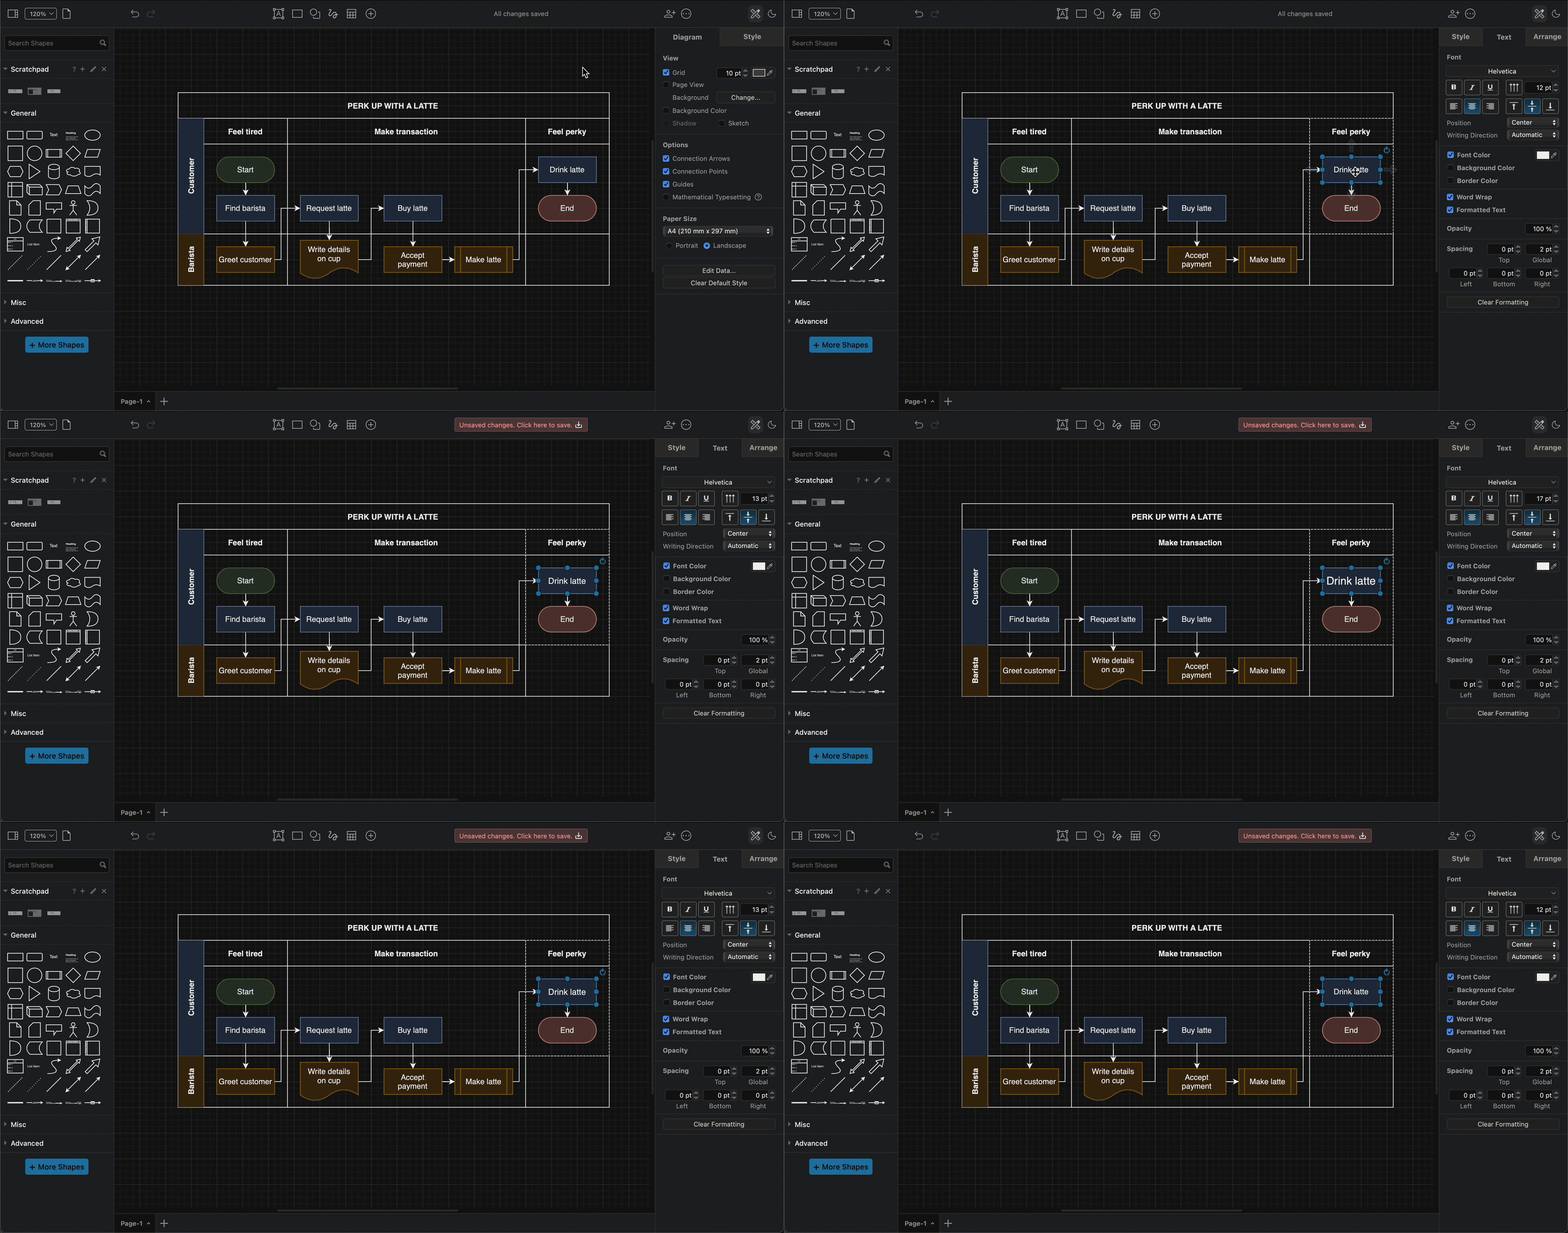
Press Ctrl+Shift +/- Numpad to increase or decrease the text size of a selected shape or connector label

Increase/decrease shape size

Select a shape, and press Ctrl+Shift+arrow key to increase or decrease the right or lower edge of the shape.
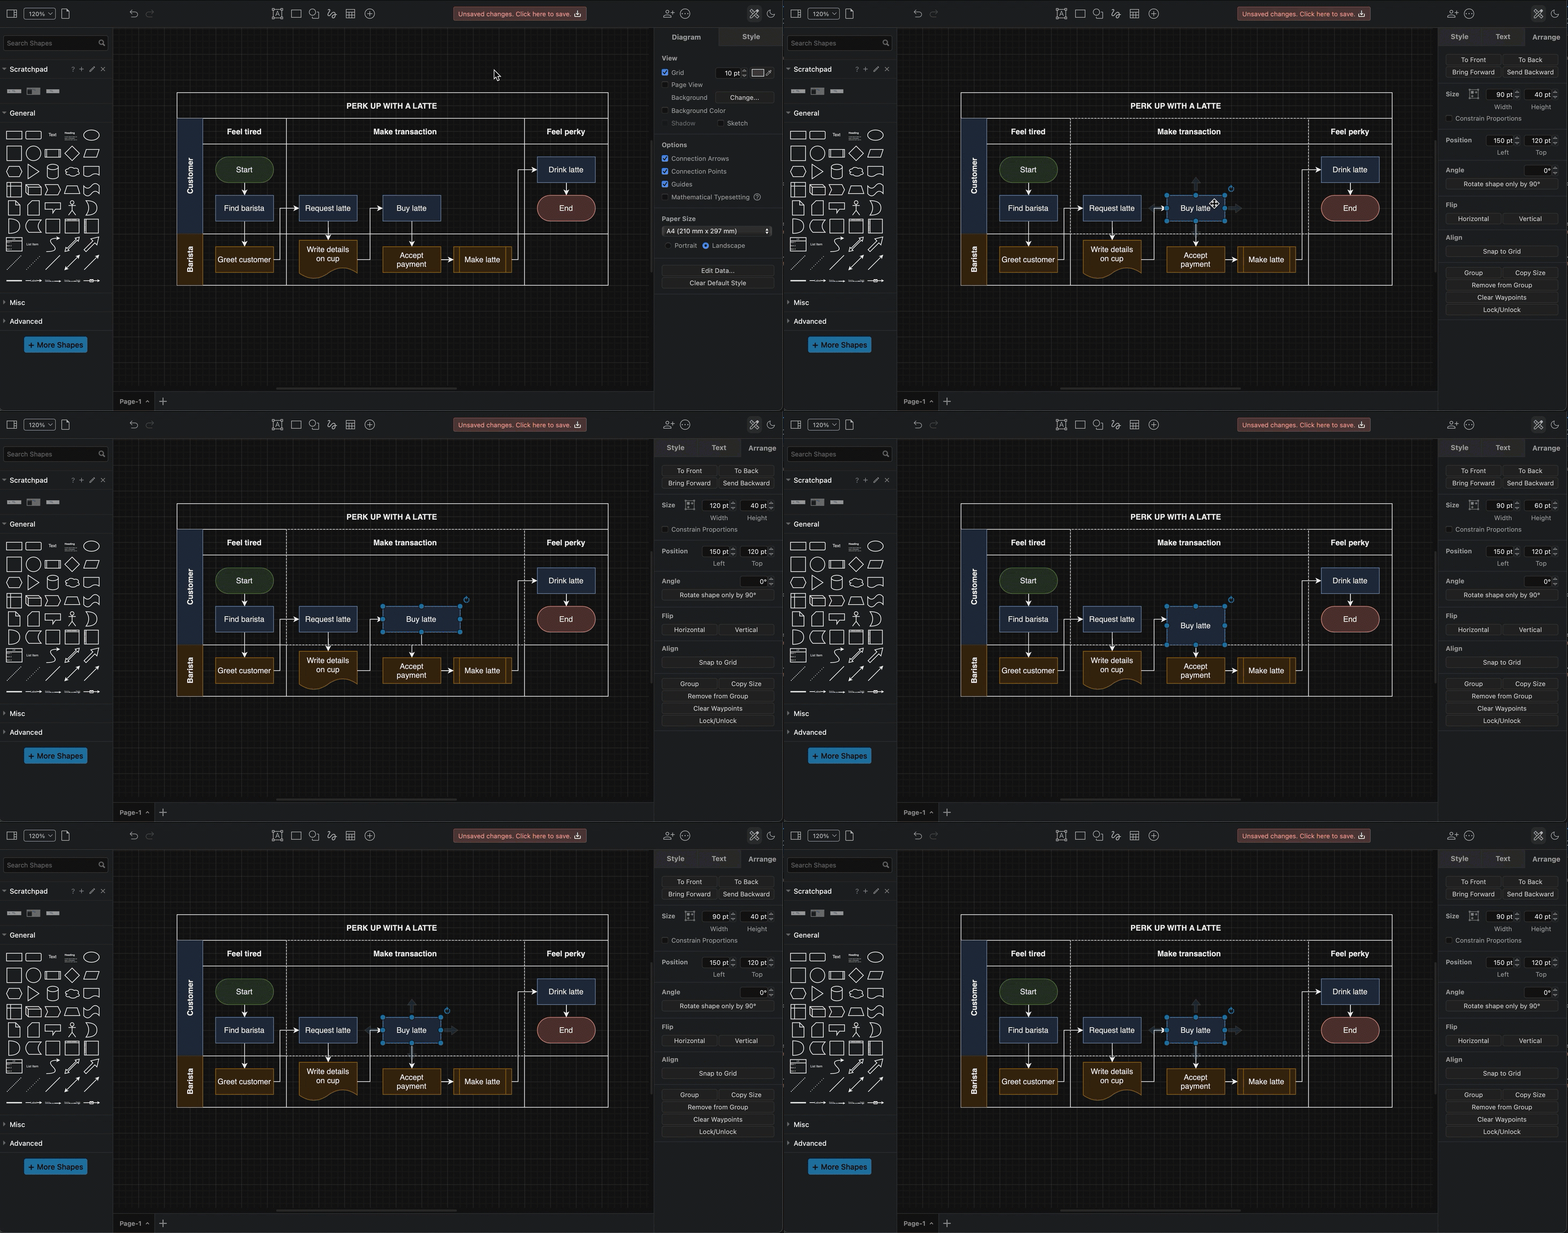
Press Ctrl+Shift+arrow key to increase or decrease the size of the selected shape

Clear all extra waypoints on a connector

Select a connector and press Alt+Shift+R to reset the waypoints back to the default path.
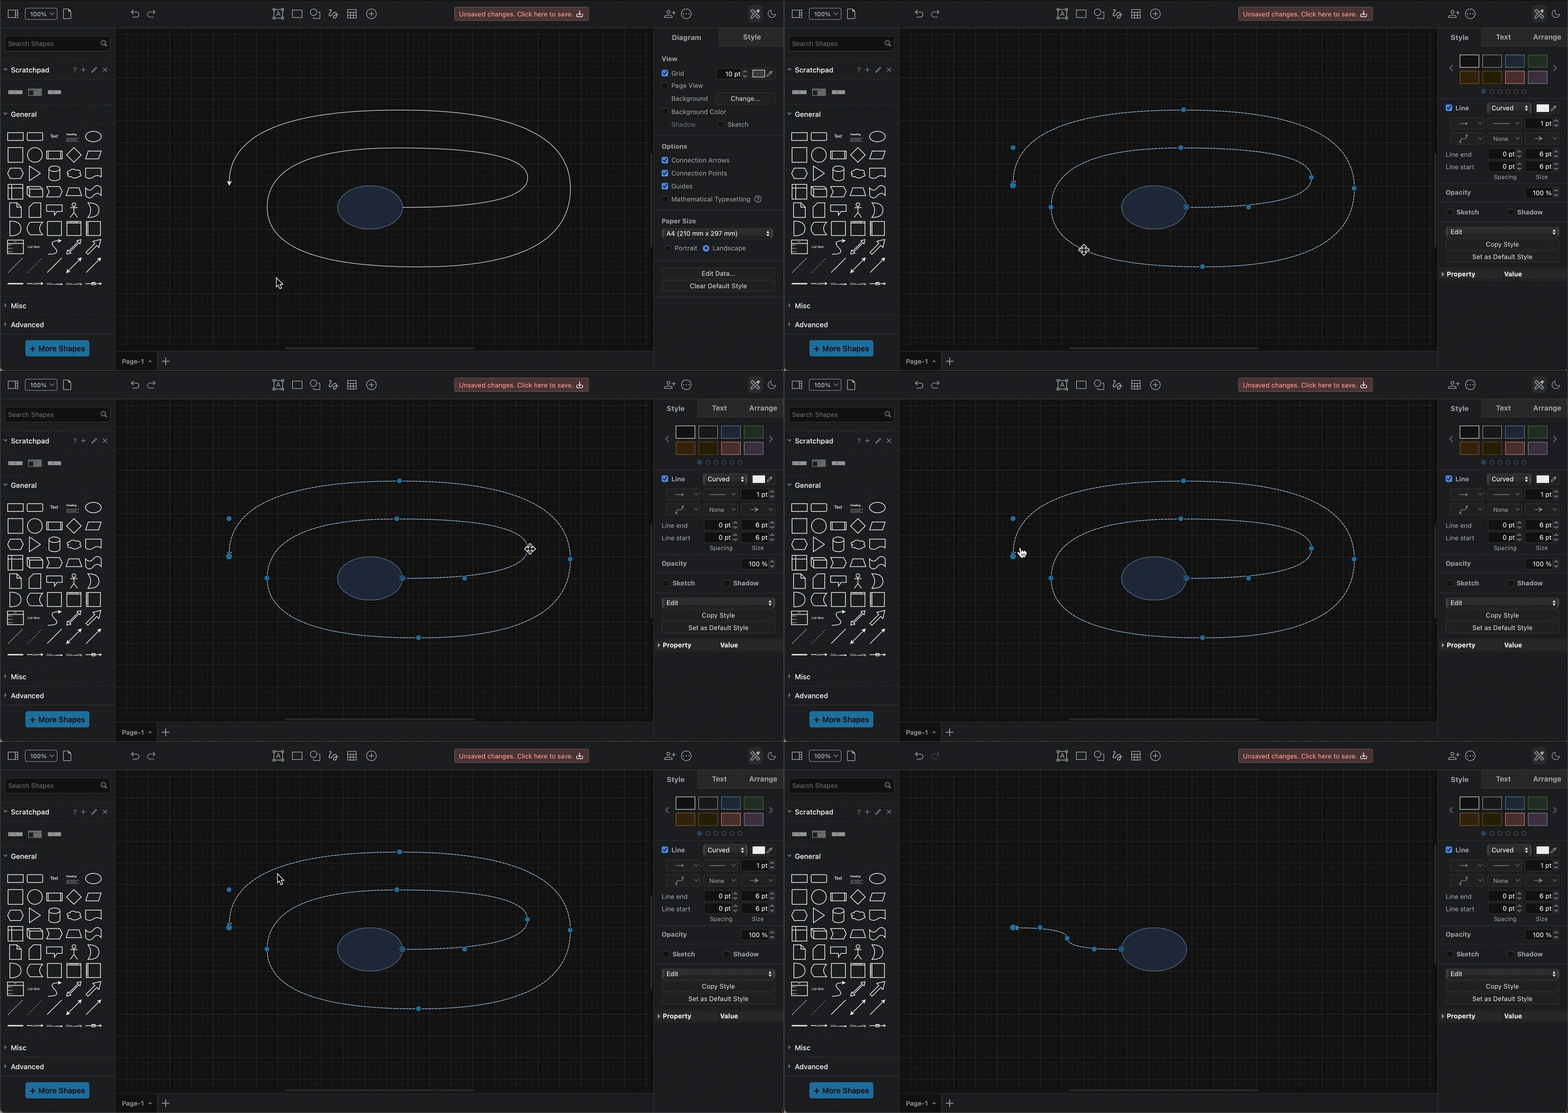
Press Alt+Shift+R to reset the waypoints of a selected connector

More keyboard shortcuts in draw.io

There are many other mouse + keyboard shortcut combinations in draw.io to help you diagram faster, as well as many other key combinations.

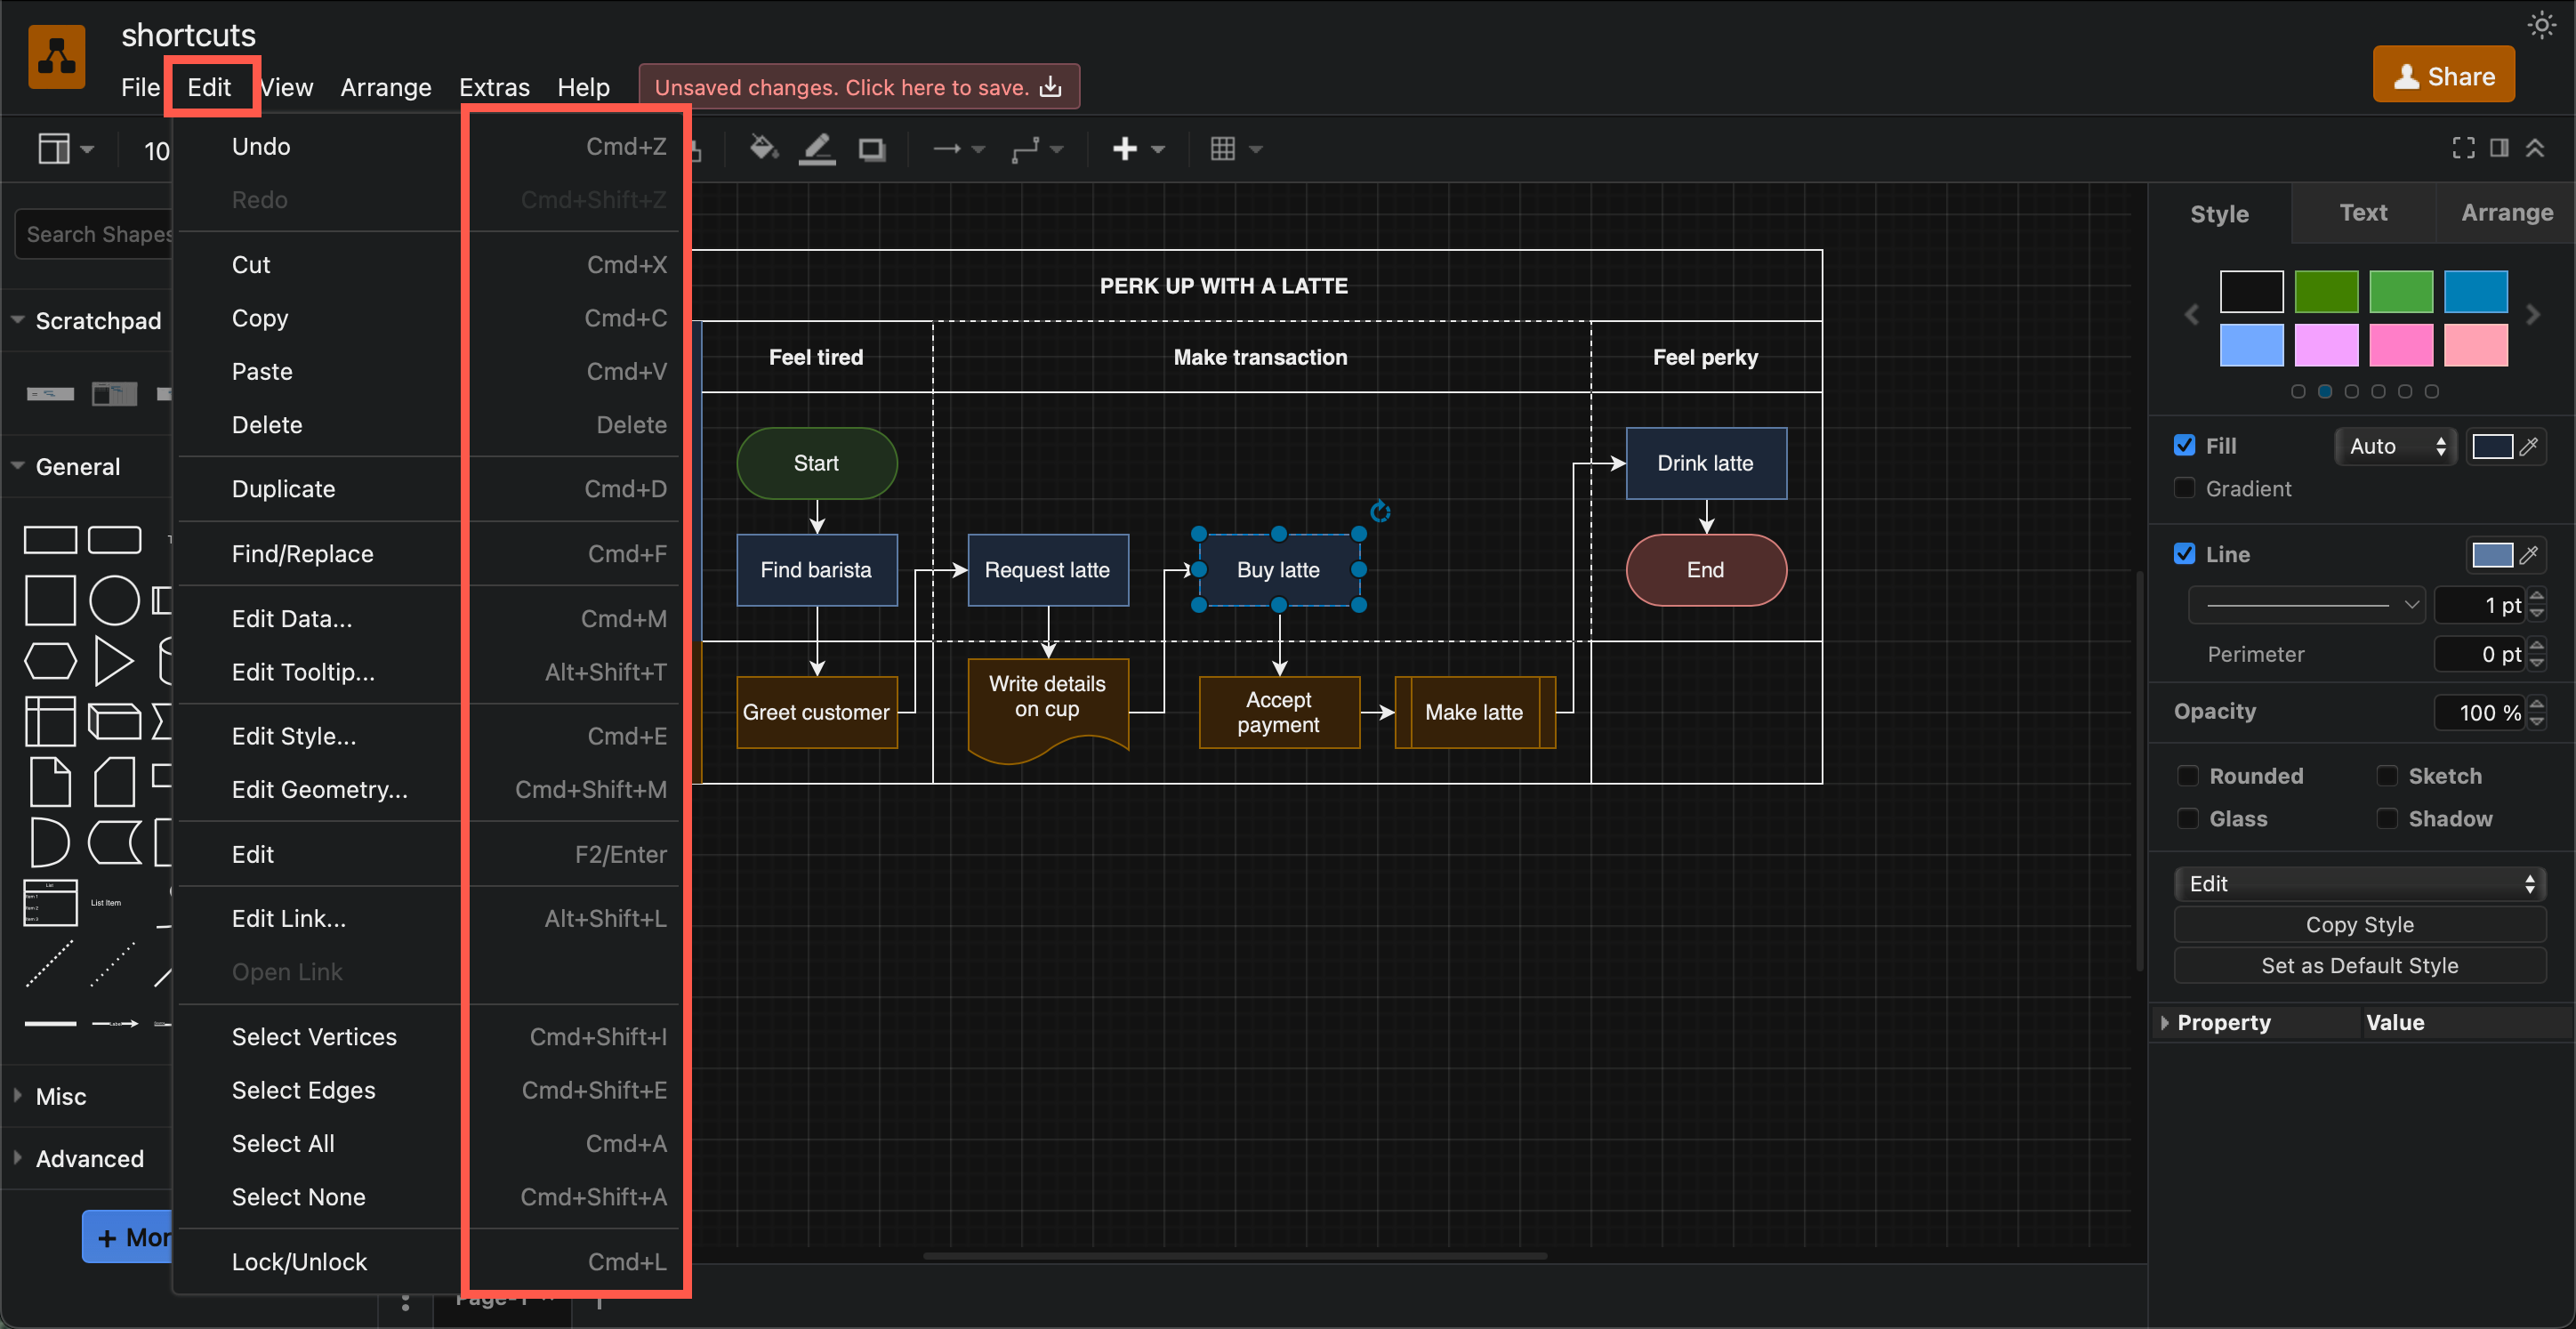
Next time you go through the draw.io menu, or right-click and open the context menu, check and see if there is a keyboard shortcut next to the command you want to use.
There are many keyboard shortcuts available in draw.io

Here's a one-page reference sheet that you can print out containing the most common and useful keyboard shortcuts in draw.io.

Shortcuts available in the draw.io diagramming apps

Updates to draw.io dark mode diagrams improve readability

· 6 min read

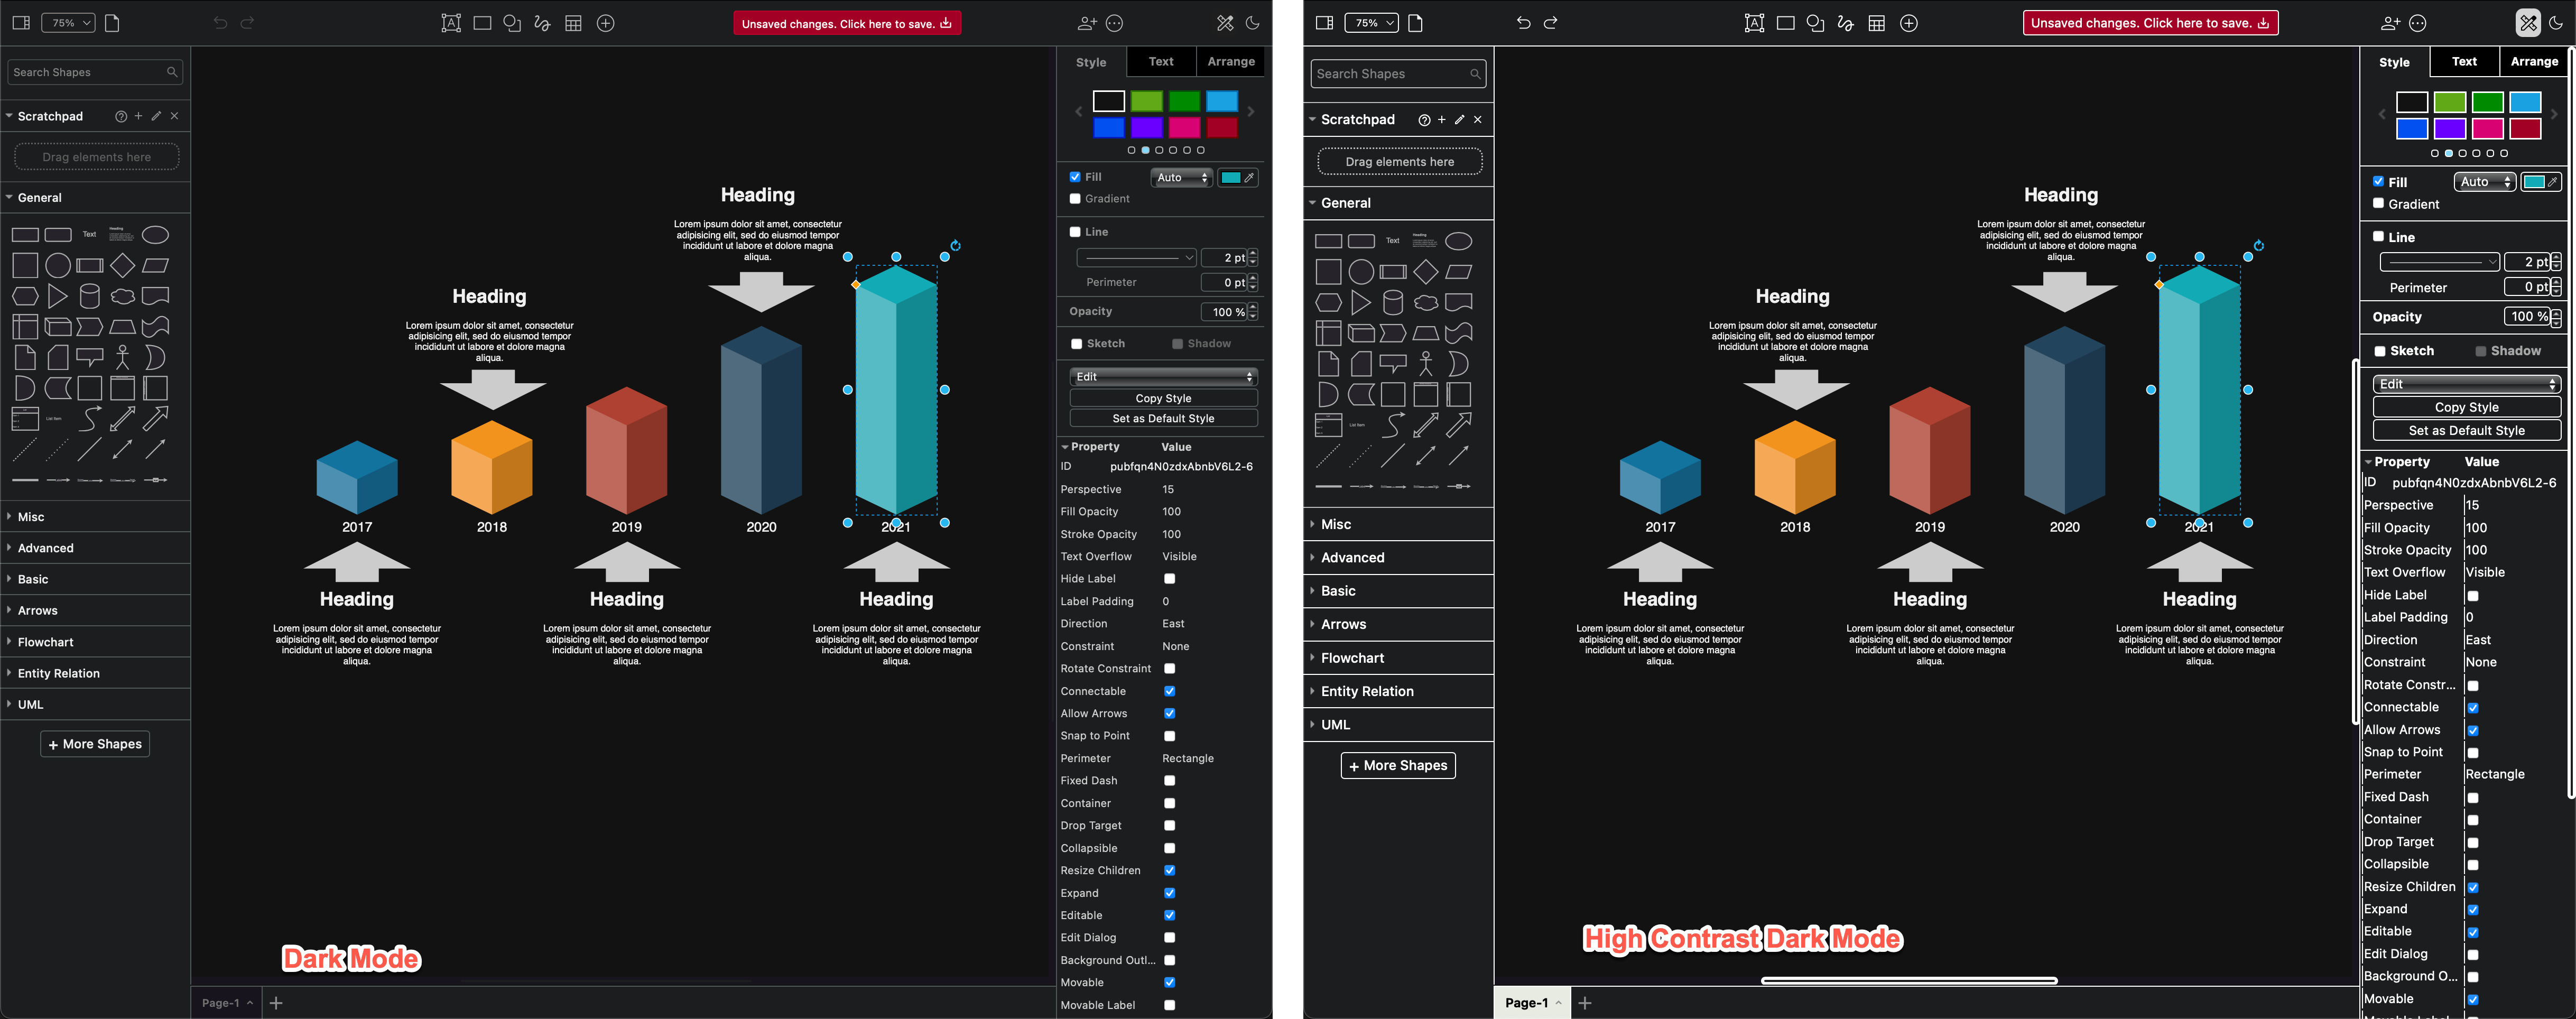
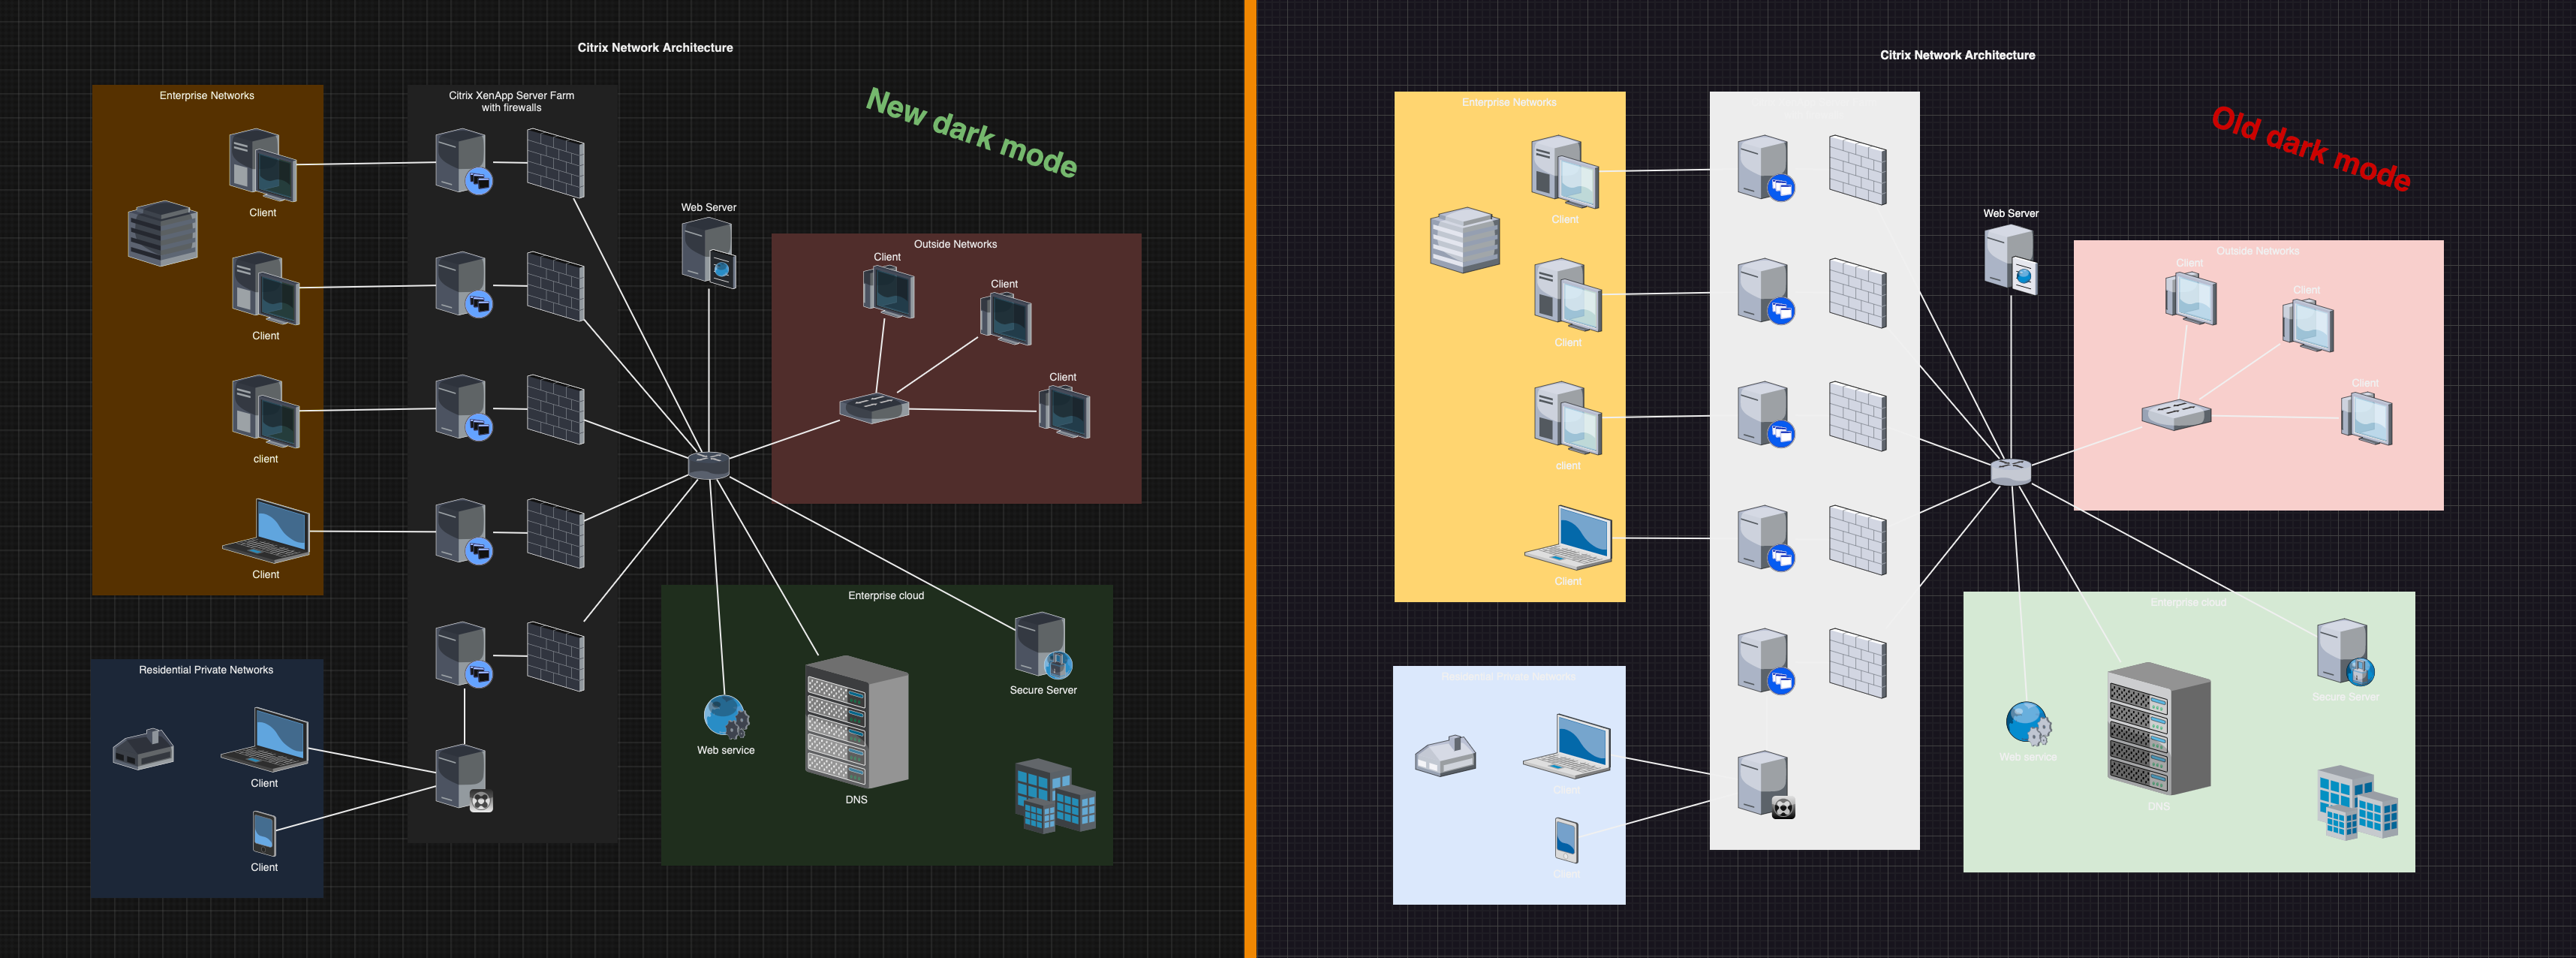
draw.io is one of very few diagram editors that lets you work in dark mode. Colours of shapes, text and connectors change automatically when you switch between light and dark modes. Now with adaptive colours, instead of changing the hue, all colours in a diagram will remain the same hue in both modes, but their intensity will be altered to significantly improve readability in dark mode.
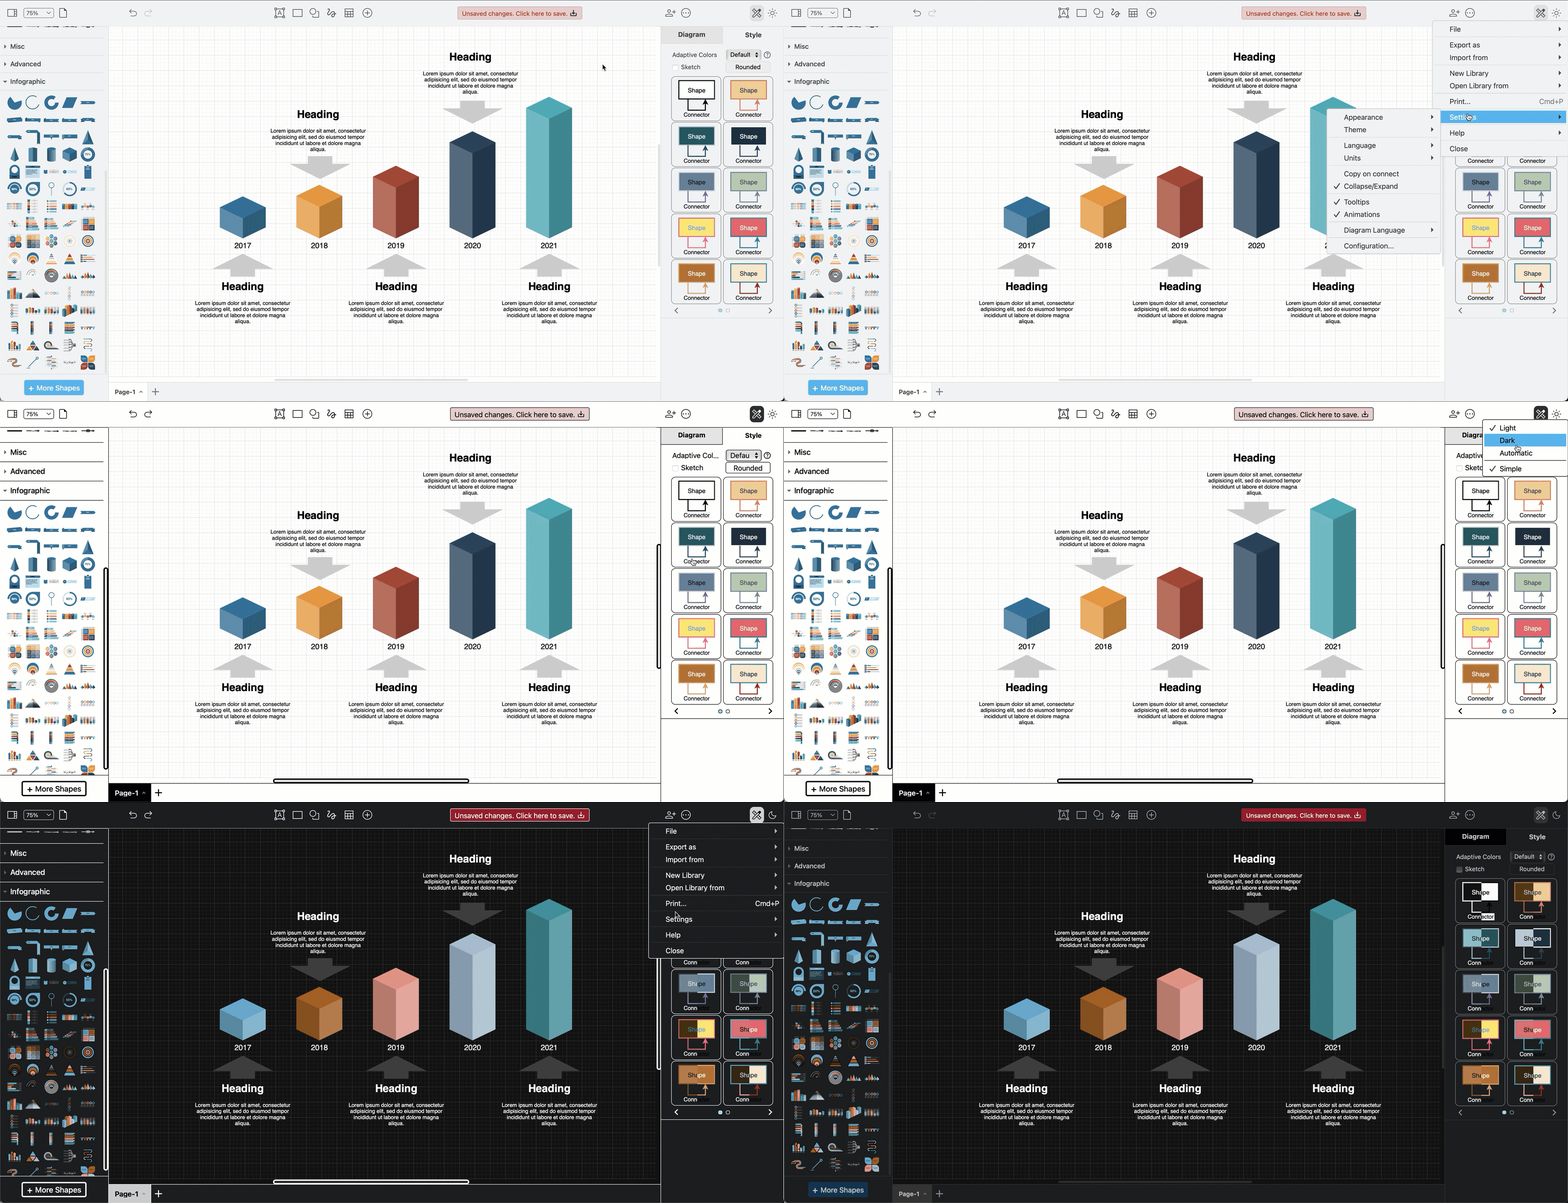
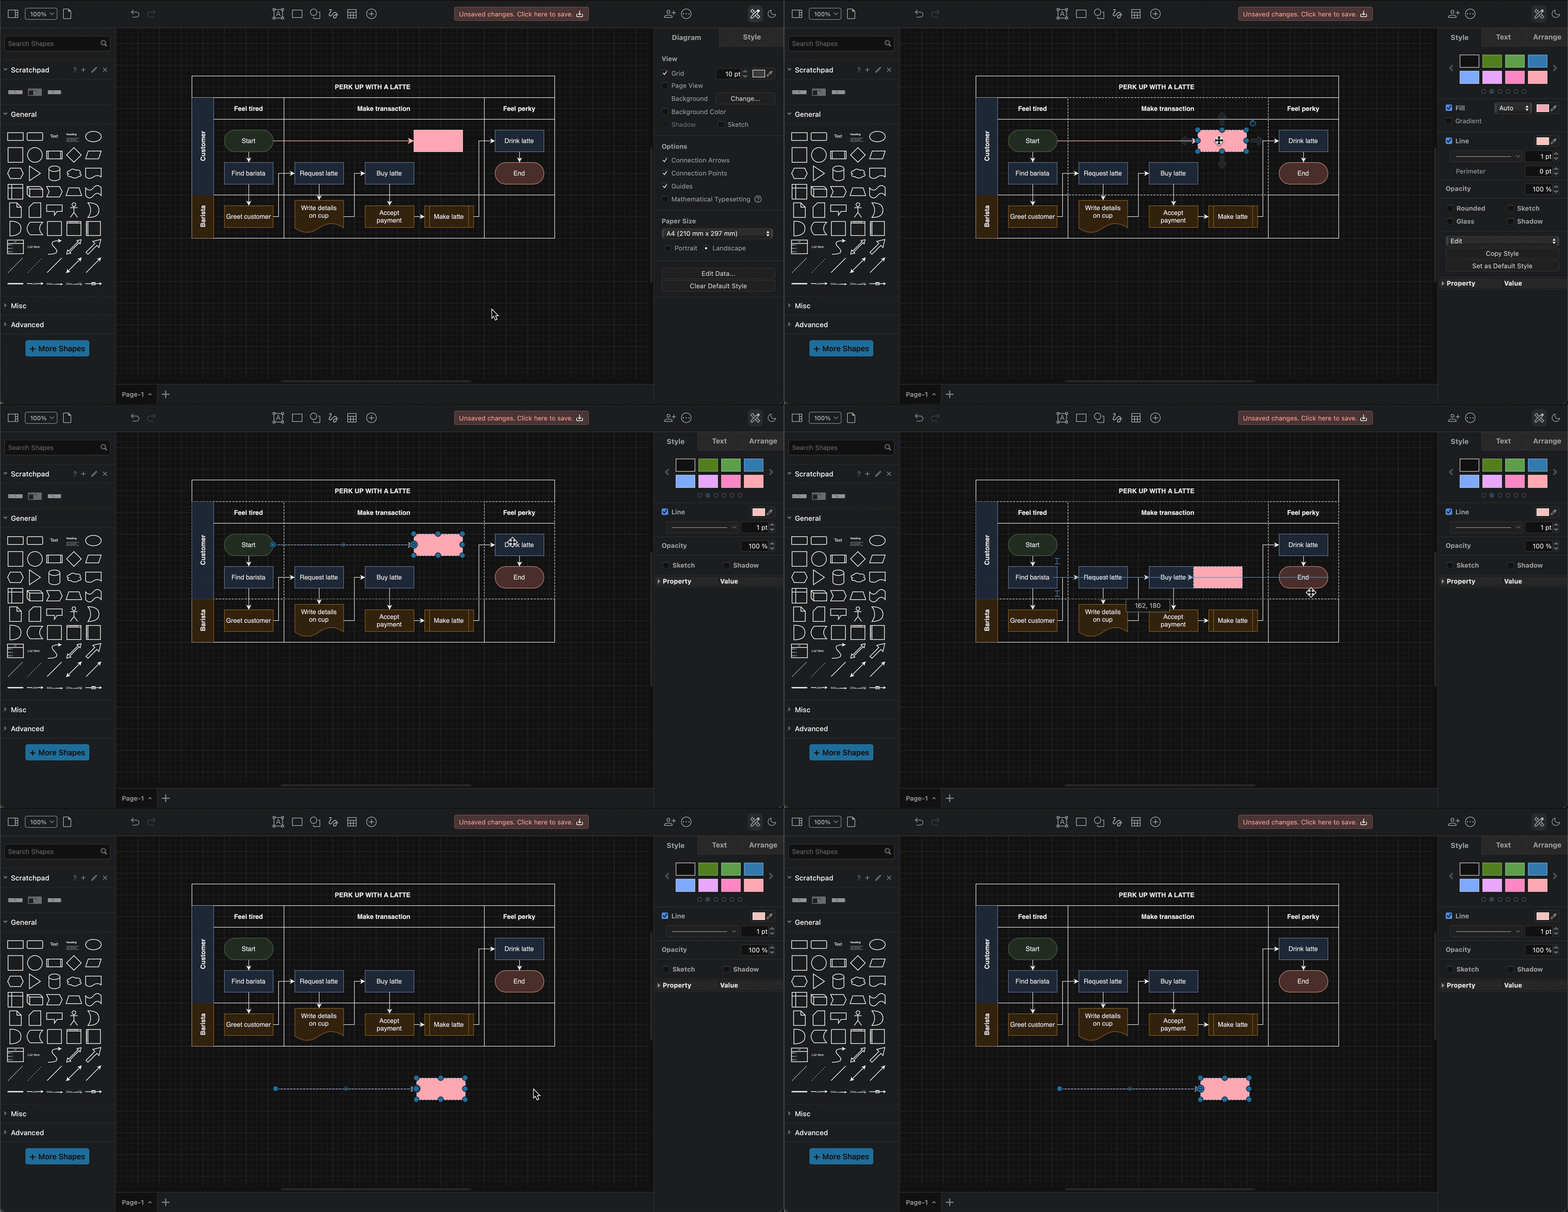
The new and improved dark mode makes diagrams much more readable on a dark drawing canvas after switching colour intensity automatically

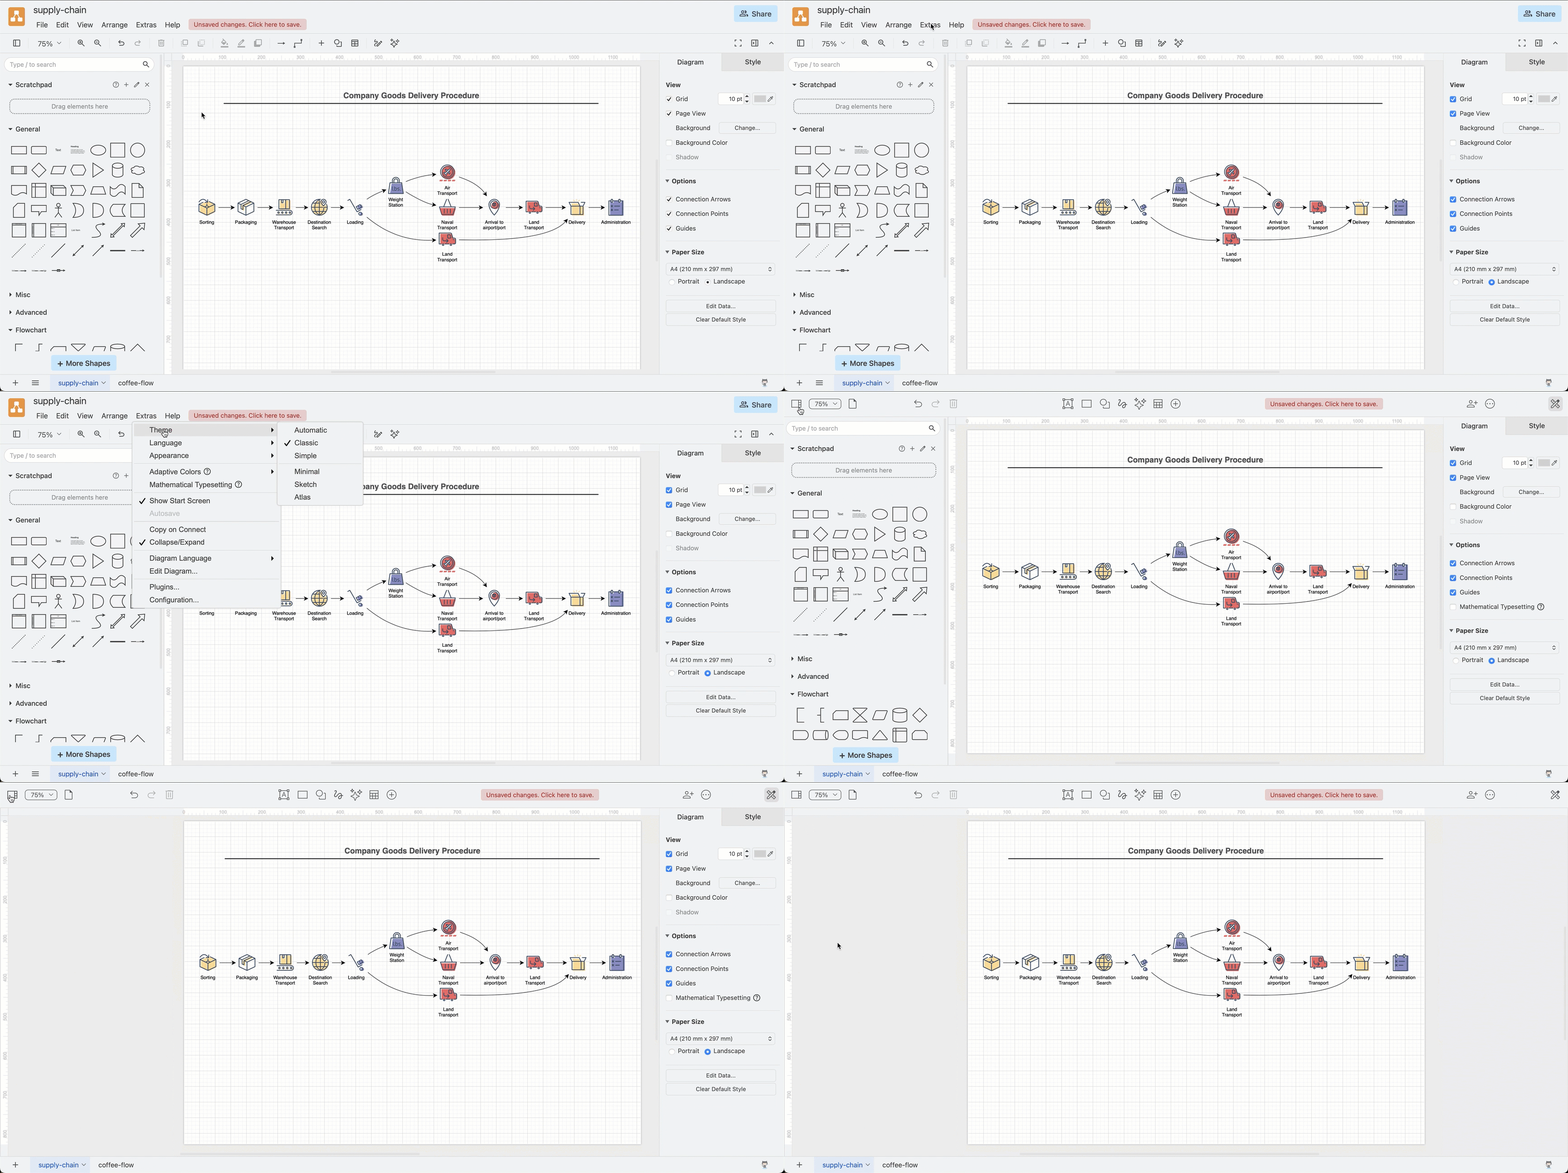
Switch to dark mode in the draw.io editor

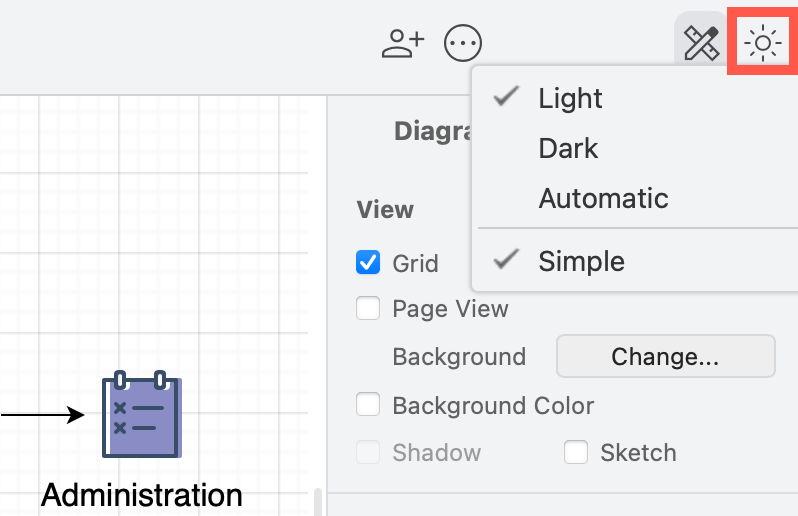
Click on the sun icon in the top right and select Dark to change to dark mode. Alternatively, from the draw.io menu select Settings > Appearance > Dark.
Click on the sun/moon in the top right and switch between any of the four editor themes and the simple mode, as well as between dark and light modes

To switch back, click on the moon icon and select Light, or Settings > Appearance > Light from the menu.

Tip: Choose Automatic if you want the editor to reflect your operating system or browser mode.

Dark mode is available in draw.io Desktop, our free online editor at app.diagrams.net, and in integrations such as the unofficial draw.io extension for VSCode, and the draw.io Chrome extension for Notion.

Dark is available in draw.io for Confluence Cloud and Jira Cloud, and diagram thumbnails and the draw.io editor will switch modes automatically when you switch between dark and light themes in Confluence or Jira.

Light and dark colours in draw.io

All colours in a diagram - shapes, text, connectors and the drawing canvas background colour - now have their intensity changed when you switch modes.

This makes sure that text that is readable and connectors that are visible in one mode, are just as legible in the other mode.

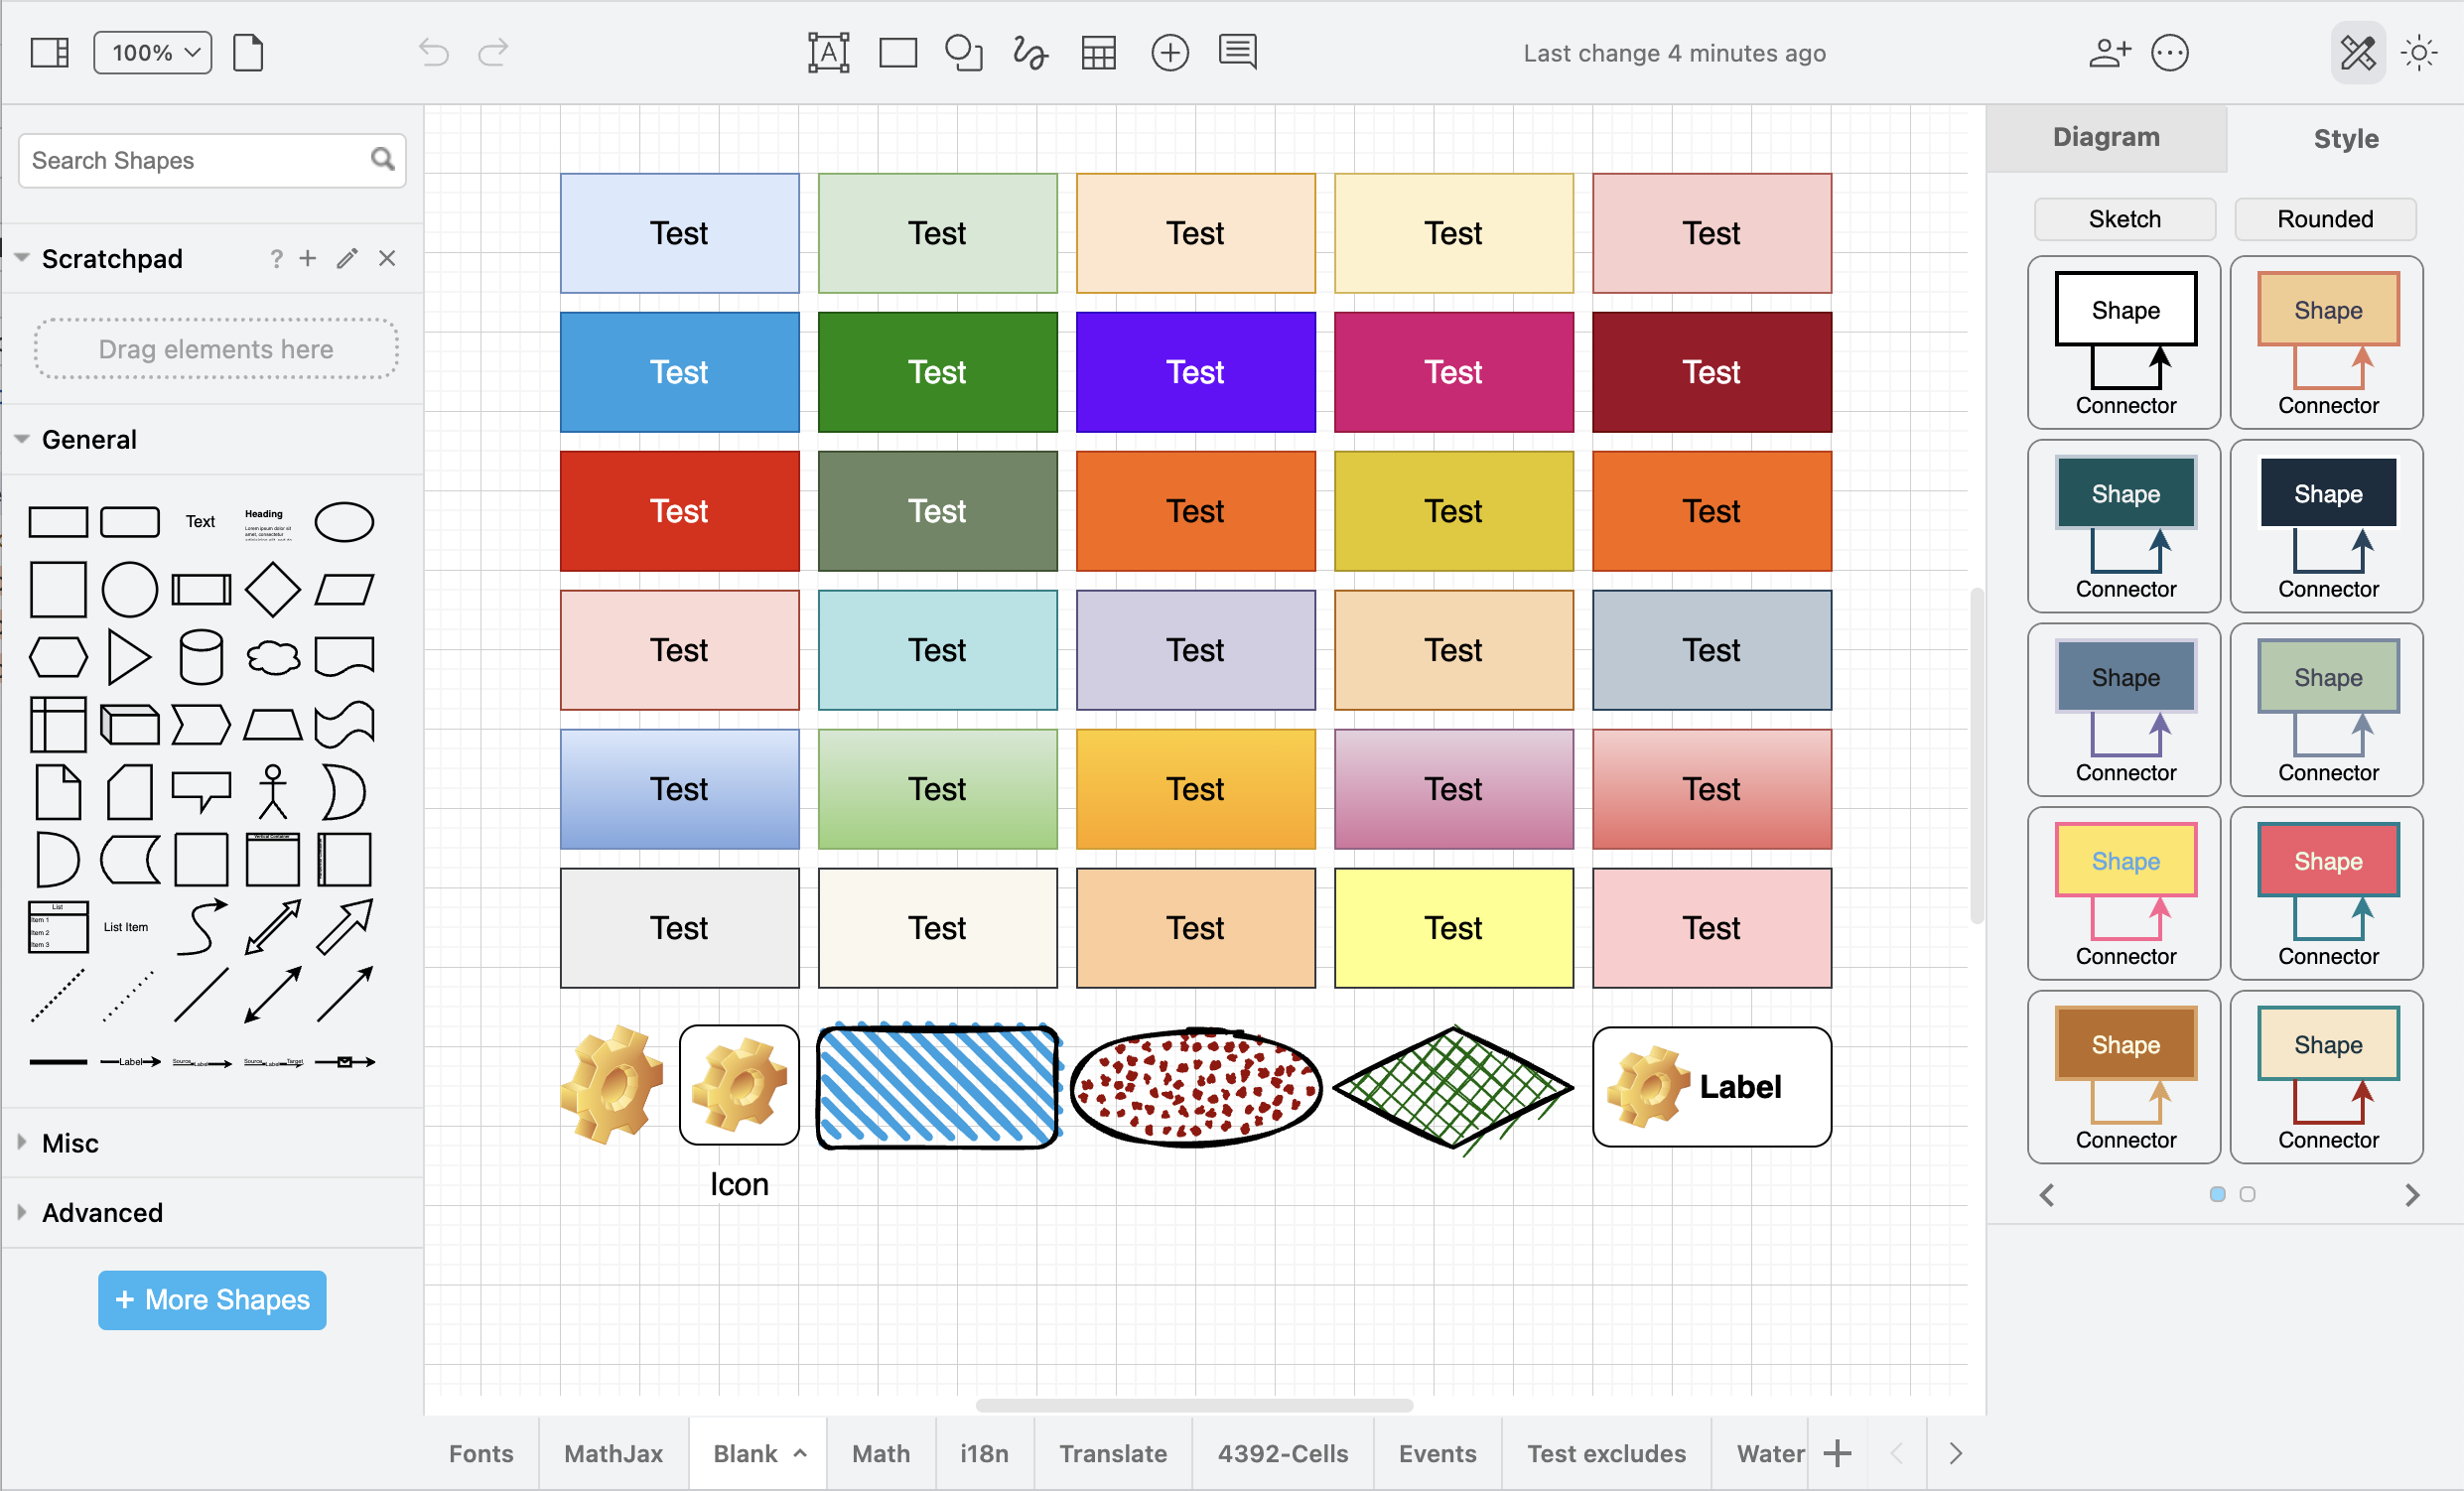
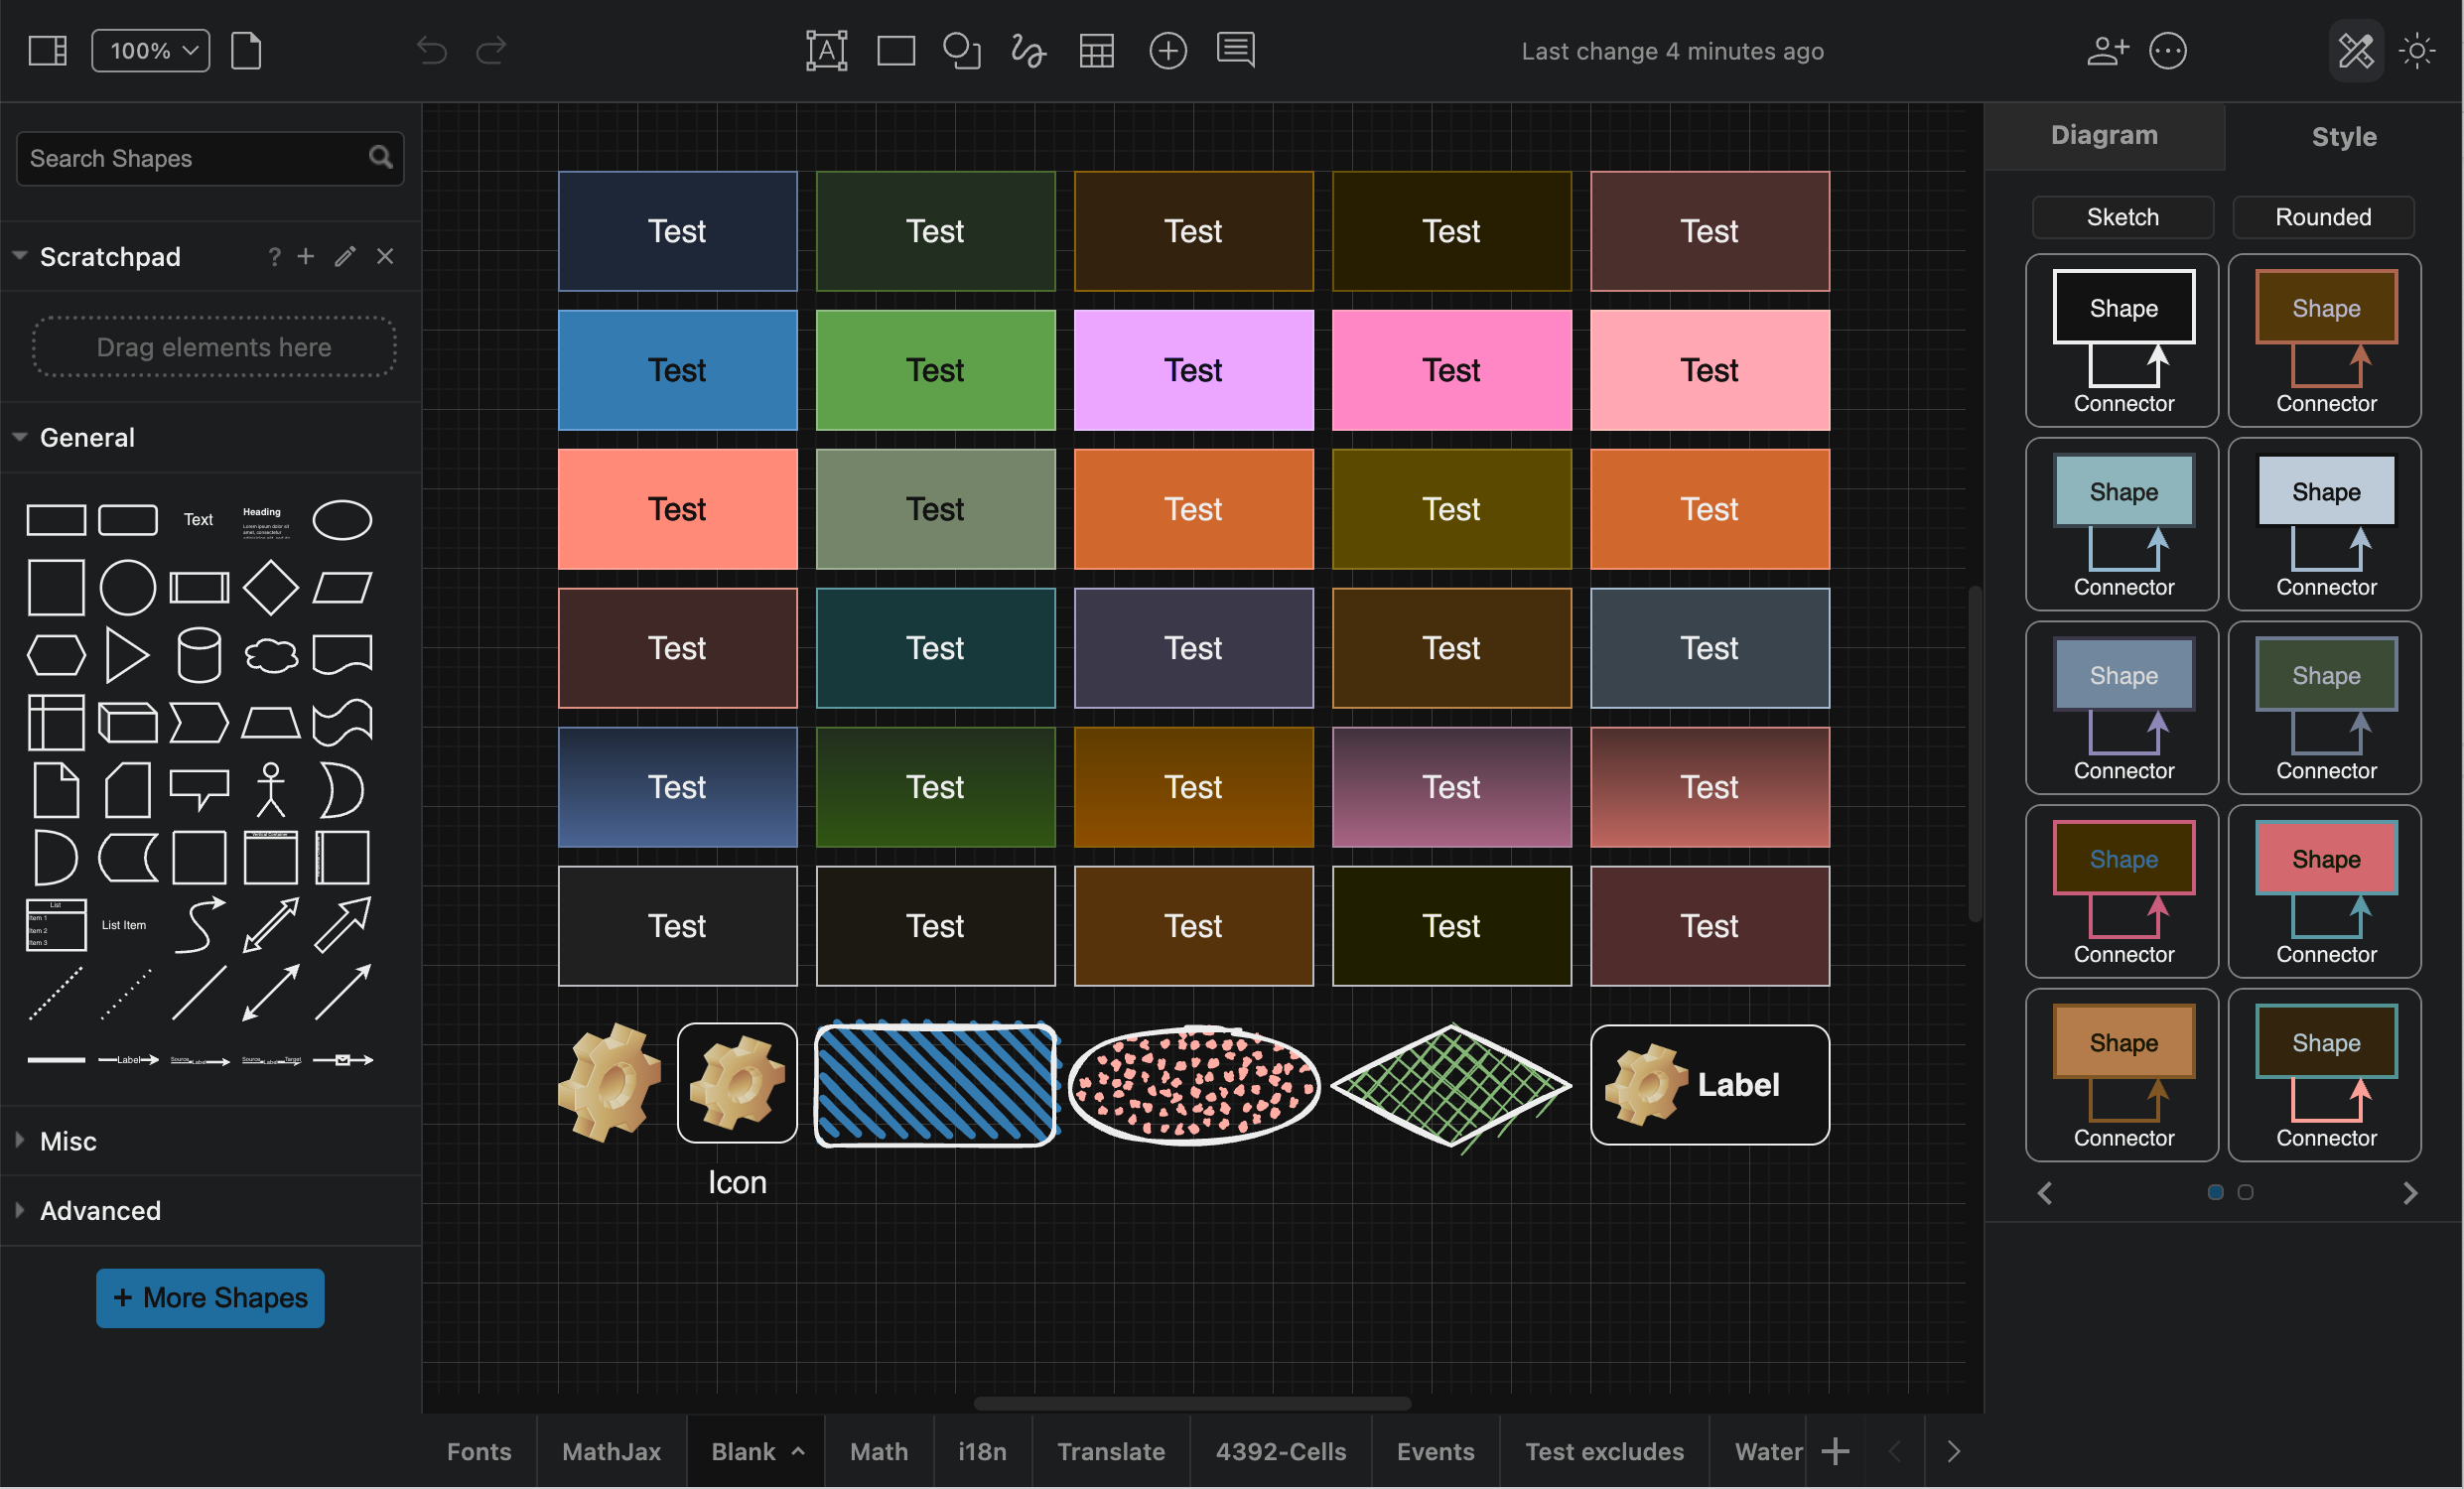
All of the style palette colours (in the Style tab of the format panel), and the global diagram styles are changed to reflect the mode you are working in.

Light mode palette colours
All the colours of the Style tab palettes and the global style in light mode in draw.io

Dark mode palette colours
All the colours of the Style tab palettes and the global style in dark mode in draw.io

Set specific colours for light and dark mode

  1. Select a shape or connector, and click on the Fill or Line colour block in the Style tab of the format panel. For text colour, select the colour block in the Text tab of the format panel.
  2. The first value (default) is for light mode. Change this to a new hex colour code.
    By default, this will automatically shift hues to remain readable when someone views or edits the diagram in dark mode.
  3. Expand Advanced and enter a hex colour code for dark mode. Now, when you are in dark mode, the shape or connector will use this defined colour value instead of an automatic shifted hue.

Exporting diagrams from dark mode

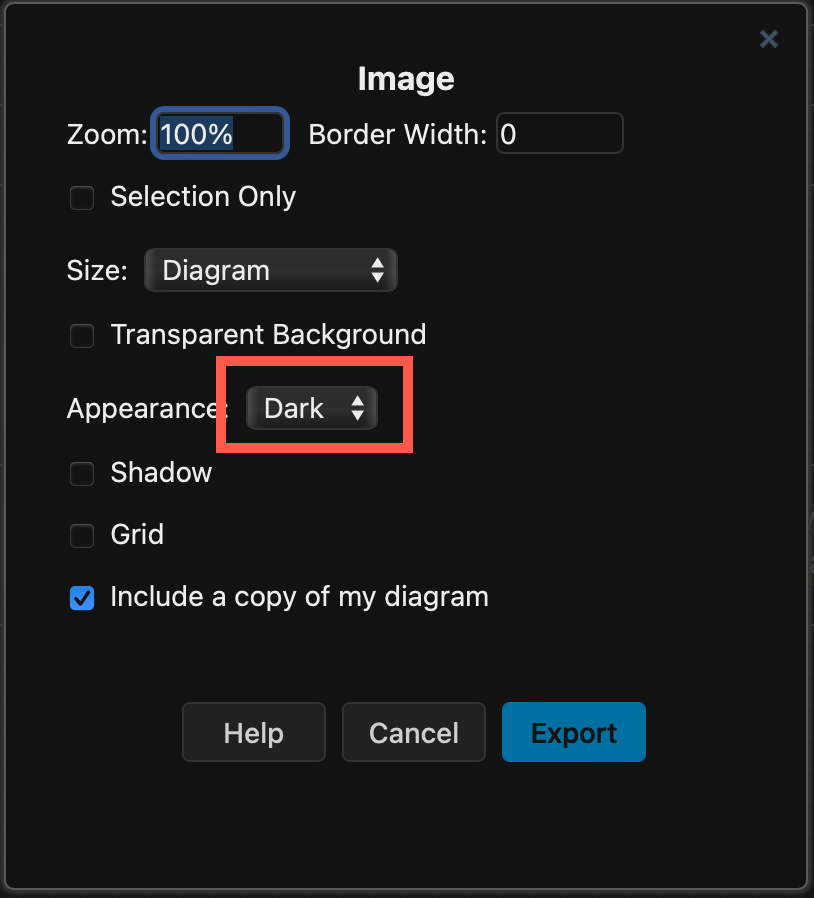
When you export a diagram to an image, you can select Dark in the Appearance list. Your diagram will be saved over a dark background in the exported image.
Make sure to leave the Dark checkbox enabled when exporting a diagram as an image from the Dark editor theme

When you export a diagram to a PDF, HTML file, draw.io file or URL, or export to a light-mode image, the diagram will be displayed on a light background with the light colour palette.

Colours in existing diagrams

It is assumed when using dark mode that all diagrams have been created in light mode. As this is by far the most common case, it will ensure the colour intensity change when switching to dark mode will be correct, and your diagram readable.

Note: The mode colour intensity change is a CSS filter - this does not change the colours in your diagram data.

Diagrams not using the right colours?

If you drew a diagram in dark mode and set specific colours to suit the dark background, when you re-open that diagram in the most recent version of the editor, the colours will not be as you originally set.

This is because the algorithm for converting light-mode colour intensity to dark mode is applied to all colours in a diagram when using dark mode. This will affect a minority of users - not many have been using dark mode exclusively to diagram.

You can continue using the old dark mode and your customised diagram colours

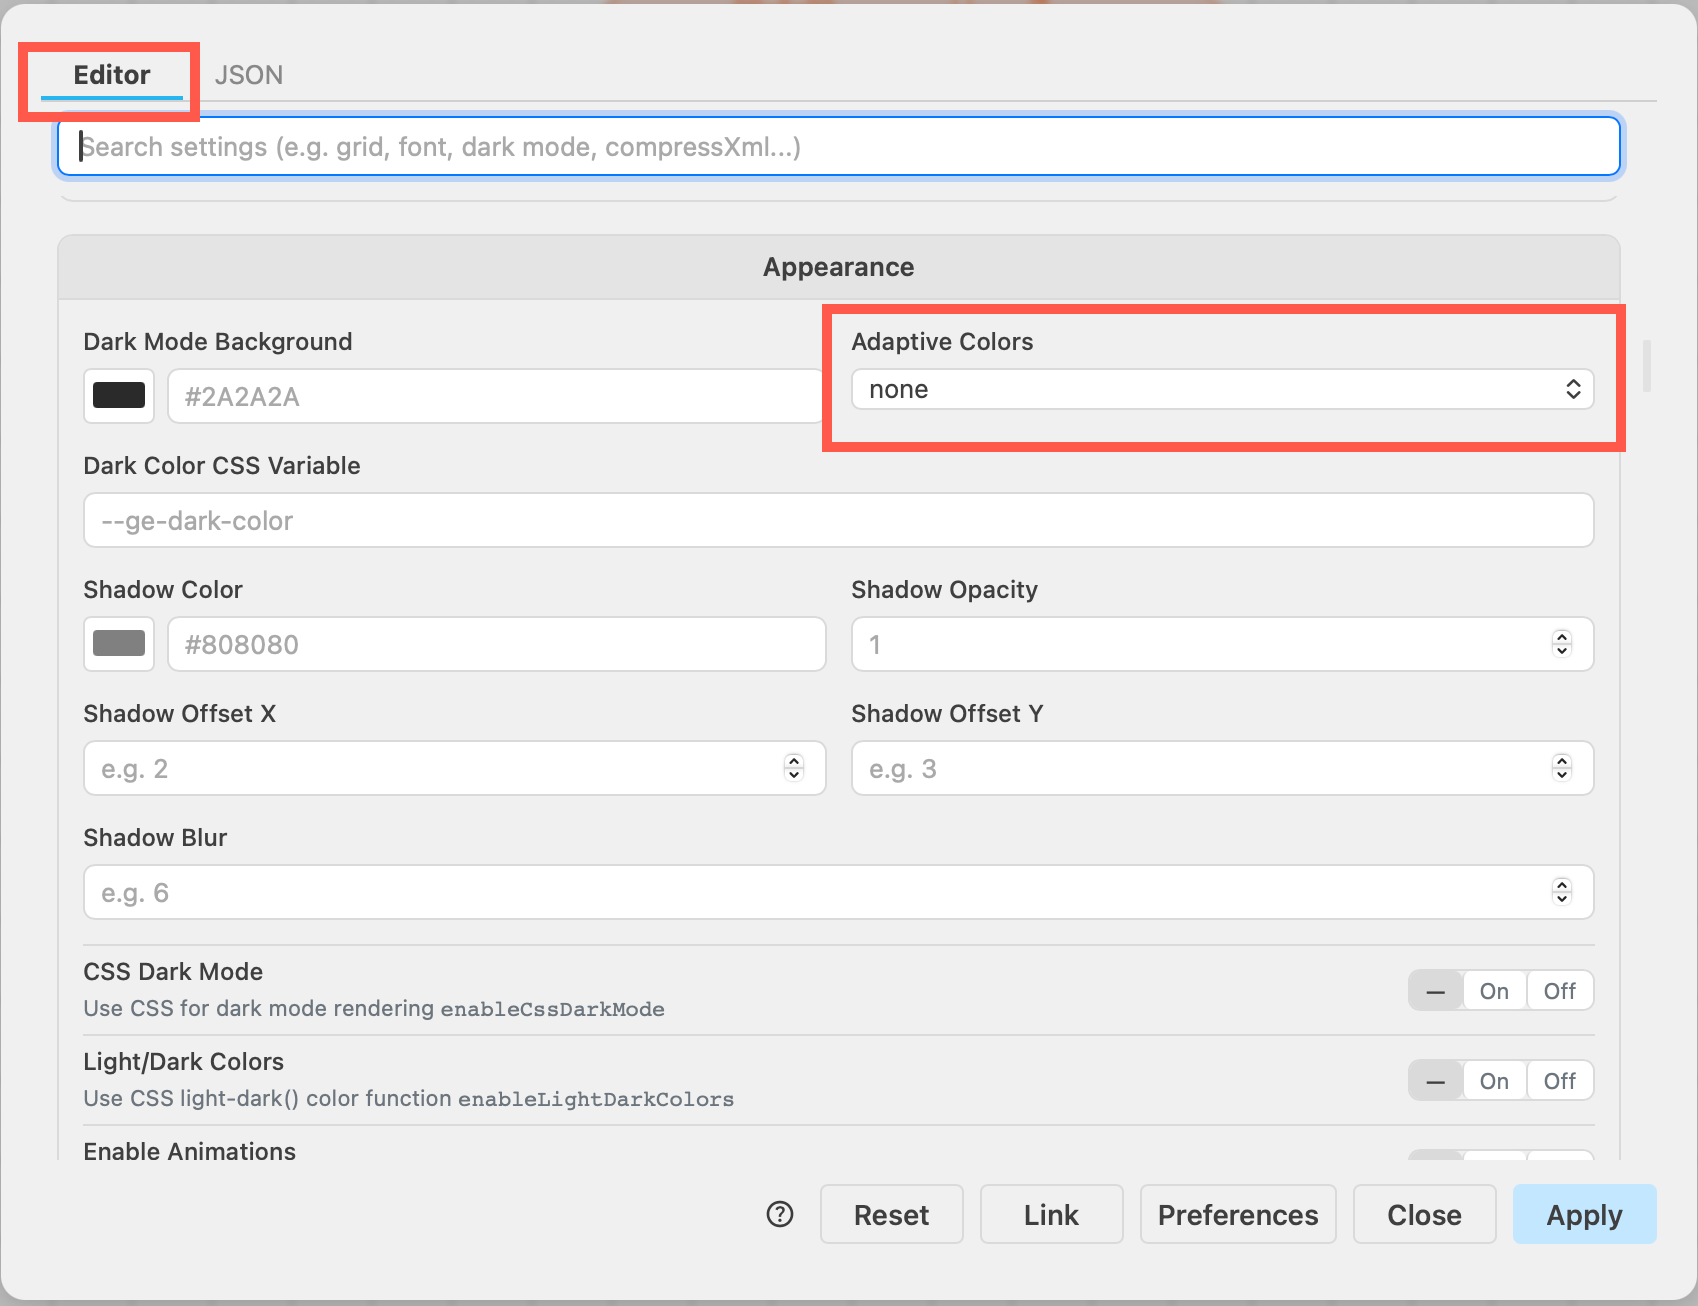
  1. Open the draw.io configuration (Settings > Configuration or Extras > Configuration via the draw.io menu)
  2. Search for css in the Editor tab.
  3. Set the CSS Dark Mode toggle to Off and click Apply.
    Enable CSS dark mode to use the old system if you have customised colours in diagrams specifically for dark mode

The JSON configuration string will be updated to reflect this.

{
"enableCssDarkMode": false
}

Then, reload the tab or restart draw.io Desktop to load the new configuration. The colours in the diagrams you had customised for dark mode will now look as expected.

For more information, please visit the related discussion in our draw.io GitHub repository.

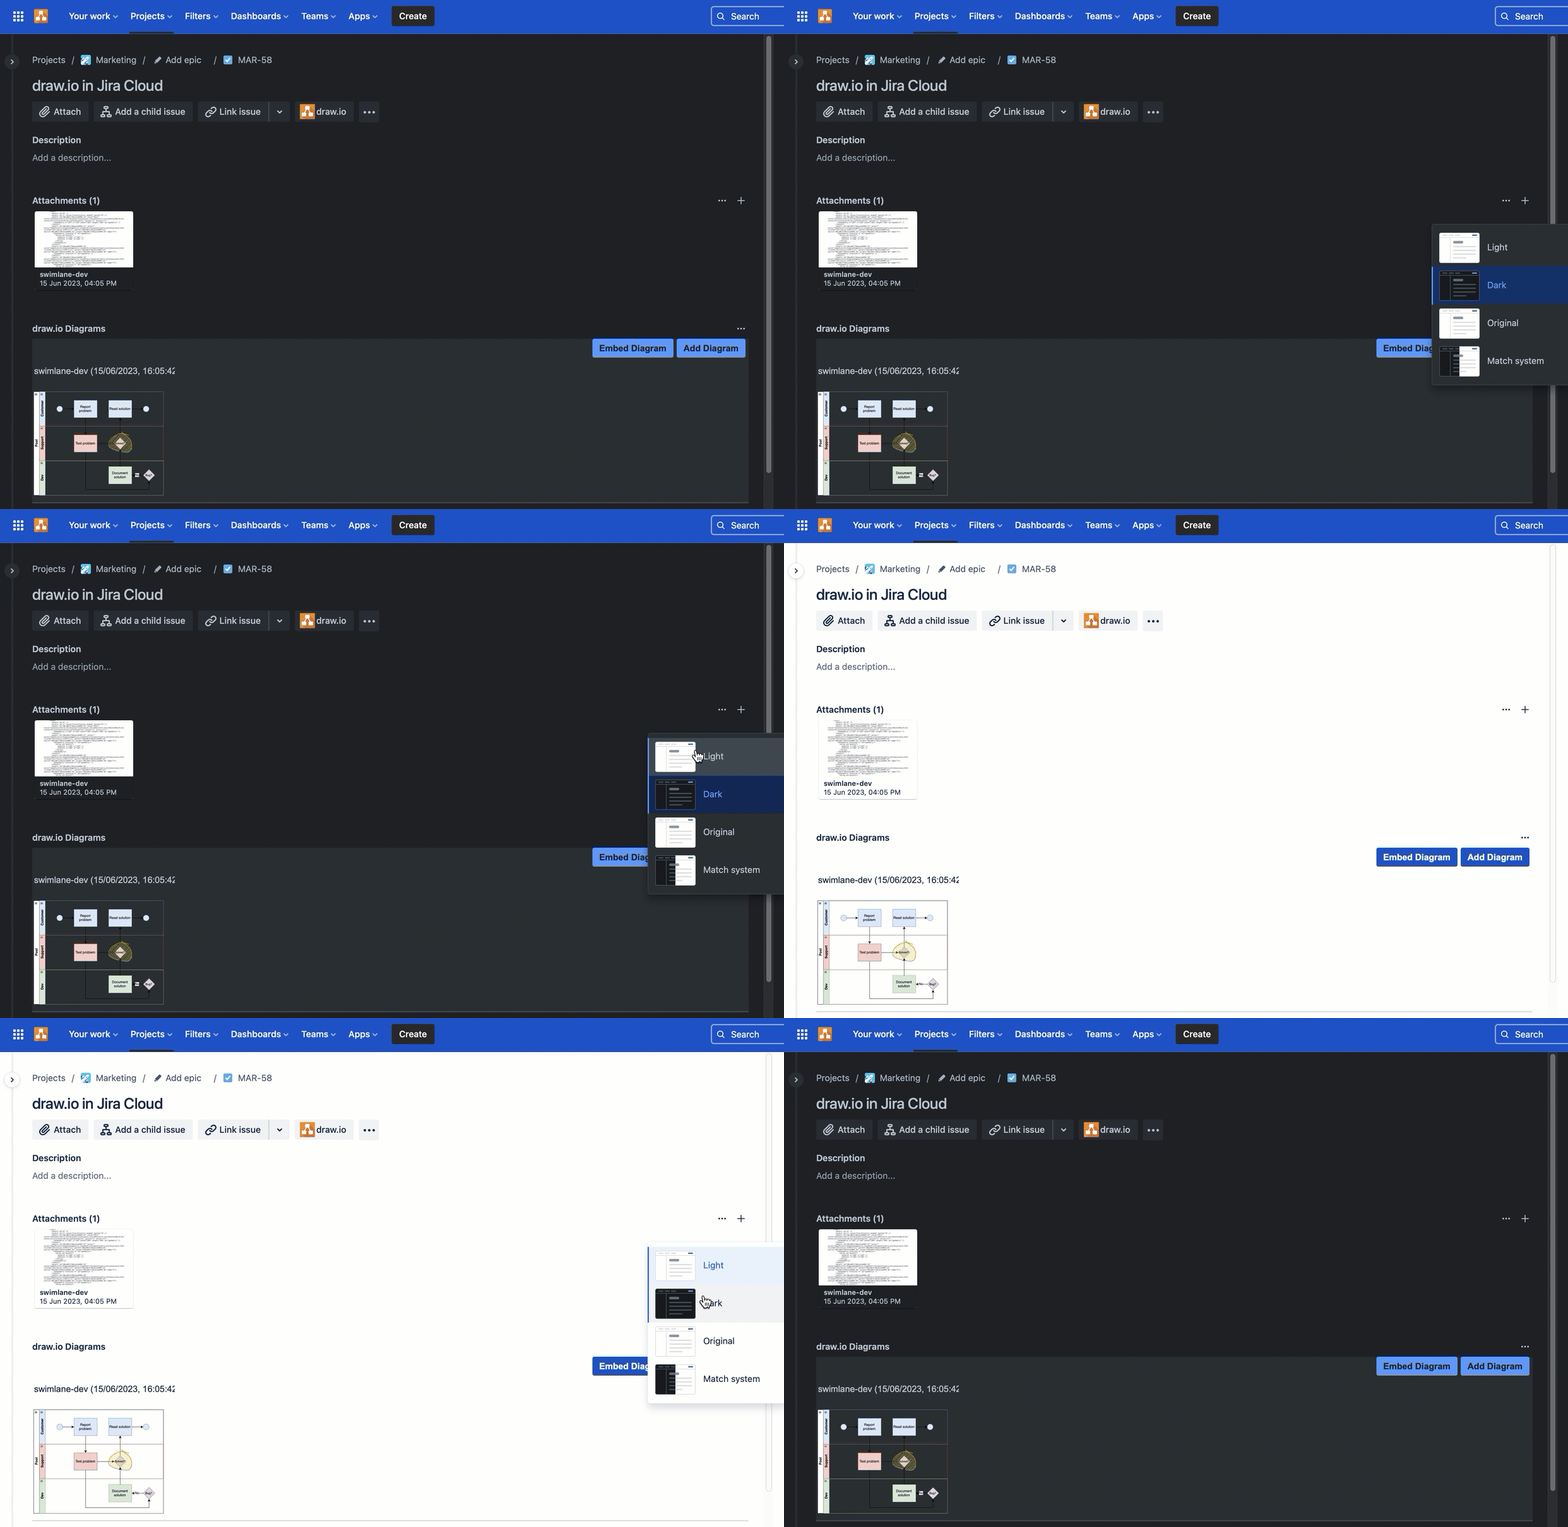
draw.io automatically applies your Jira Cloud theme to diagram thumbnails

· 4 min read

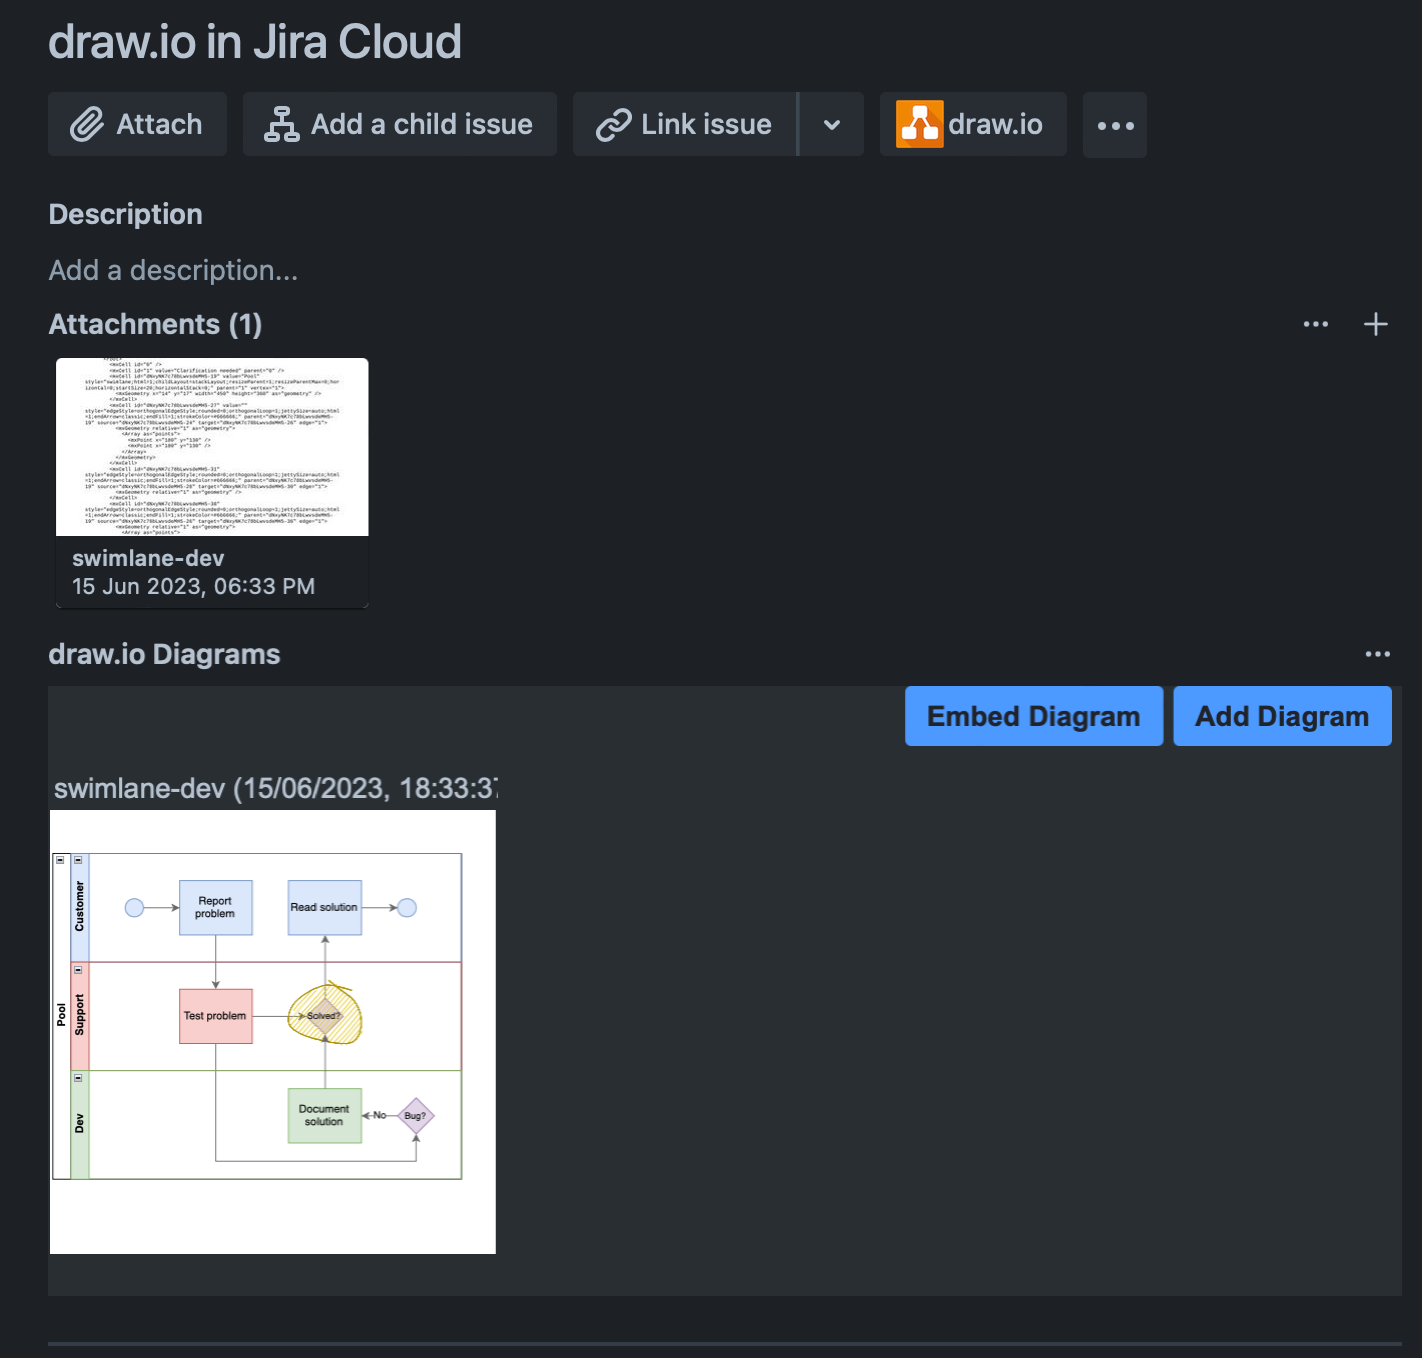
Atlassian has just released a dark theme for Jira Cloud for users who don't like working on light backgrounds. With Jira's new dark theme, draw.io diagram thumbnails in a Jira issue now automatically reflect your selected theme.
draw.io automatically changes the colours in your diagrams to match your Jira Cloud dark or light theme

draw.io has had a dark mode for some time, but diagrams attached to Jira issues displayed on a light background, whether or not you were using the dark mode in the draw.io editor.

Learn more about diagramming with draw.io in Jira

Diagrams on dark backgrounds

draw.io makes an intelligent guess about text and shape fill colours to keep your diagrams readable when you switch between dark and light.

As your team members can use their preferred dark or light theme, and the diagram thumbnail will match their theme, it's best to double check that your diagram is easy to read in both dark and light mode.

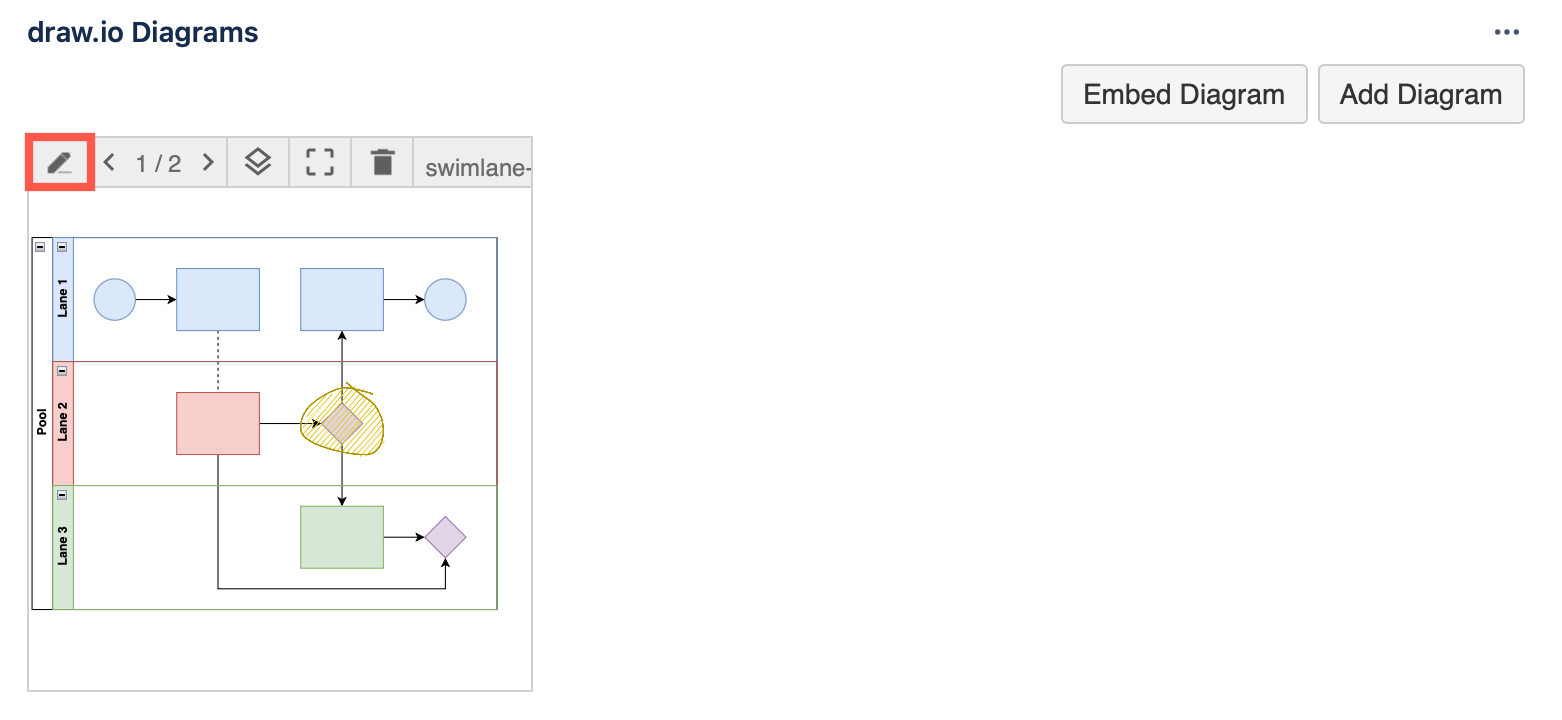
  1. Click on the Edit pencil in the toolbar when you hover over diagram thumbnail in a Jira issue to edit it with draw.io. If you don't see this section, click on the draw.io section at the top.
    Click on the edit button when hovering over a diagram in a Jira issue to open it in draw.io
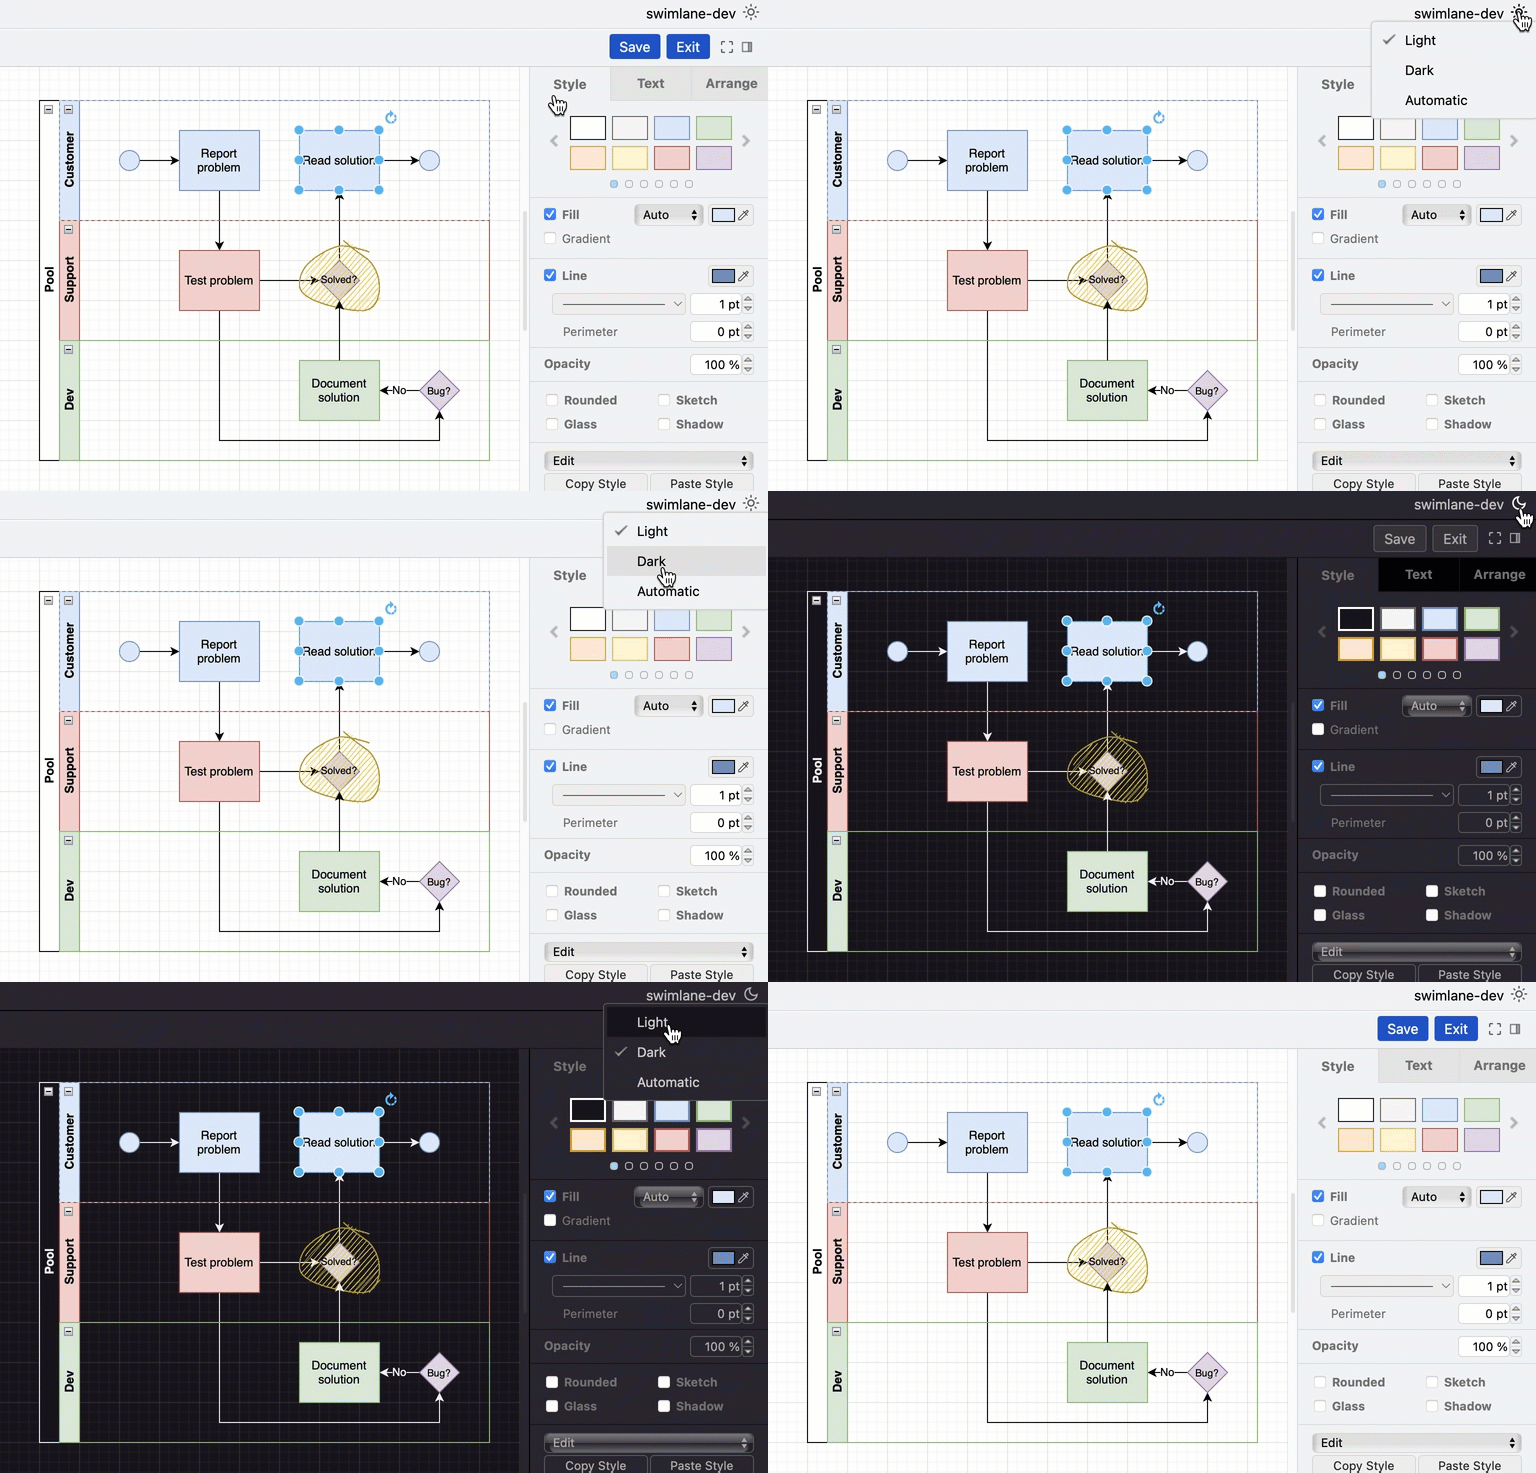
  2. Click on the sun or moon in the top right to switch to the opposite theme - either Dark or Light_ - and check that your diagram is still readable on that background.
    Click on the sun or moon in the top right of the draw.io editor to change the editor mode to dark or light

Choose Automatic to make the draw.io editor automatically match your operating system's mode (dark mode or light mode).

Note: Switching to dark or light mode in the draw.io editor will not affect the thumbnail on the Jira issue - whether it appears on a dark or light background is based on the Jira theme that the user looking at the issue has chosen.

To use draw.io in dark mode on the web, go to app.diagrams.net/?splash=0&ui=dark, or switch modes via the sun/moon icon in the top right or via the draw.io menu.

Set specific colours in a diagram

Colours in certain types of diagrams may have specific meanings - if you change their colours when adapting to dark mode, the diagram might not make sense.

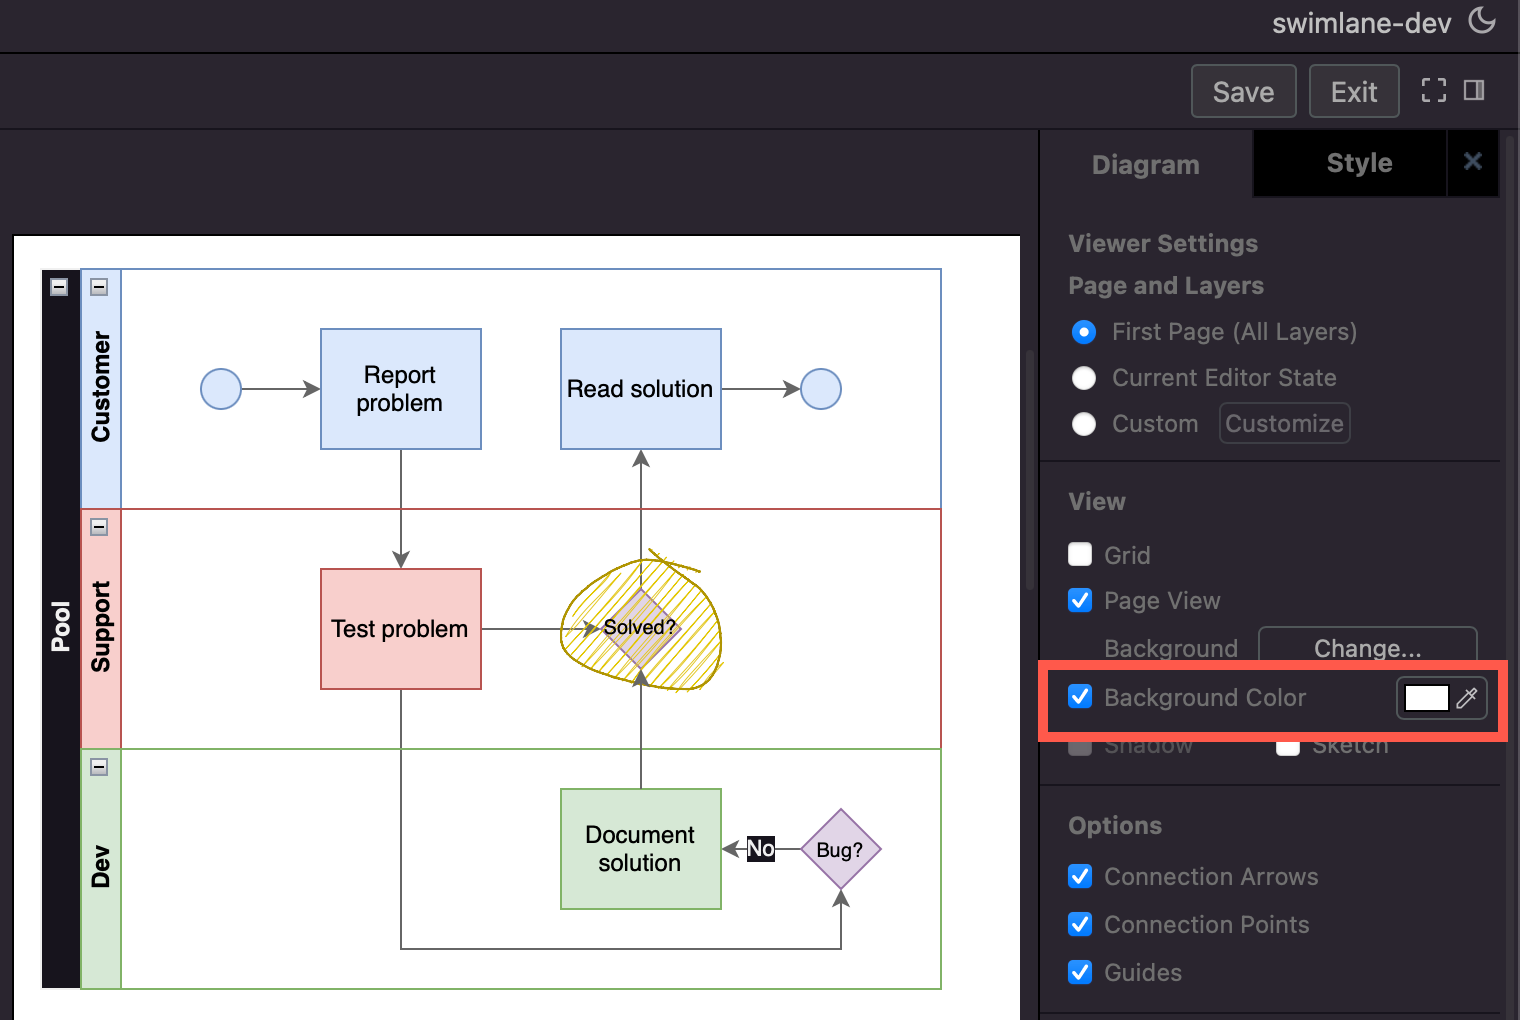
If you want your diagram to only ever be on a dark or a light background and not automatically adapt colours to match the user's Jira Cloud theme, you'll need to set a background colour, as well as a specific colours for both light and dark modes on the shapes, connectors and text in your diagram.

  1. Open the diagram from the Jira issue in the draw.io editor.
  2. Make sure nothing is selected in your diagram, then enable the Background checkbox in the Diagram tab in the format panel.
  3. Click on the colour button, select a colour from the palette or enter a colour code, and click Apply. Open the Advanced drop down and set the same colour as the dark mode background colour.
    Adding a diagram background ensures your diagram looks the same in both Jira's light and dark themes
  4. Style the shapes and connectors via the Fill and Line colours in the Style tab. Make sure you set both the light colour at the top, and the dark mode colour (under Advanced). Style all text labels via the Text tab.

Now, your diagram will use your defined colours in both dark and light mode.
Adding a diagram background ensures your diagram looks the same in both Jira's light and dark themes

Using diagrams with GitLab

· 4 min read

draw.io will be available as an integration in the web-based GitLab Wiki editor on 22 March with the GitLab 15.10 release and product kickoff. When you add your diagram to a GitLab Wiki page while editing the source of that page, it will be saved as an SVG image containing the diagram code, and displayed in the page content.

Like all files in GitLab, the image with its embedded diagram is versioned, so all changes are tracked.

Note: As this integration is still under development until release, small changes may be made.

Diagram in the GitLab Wiki editor

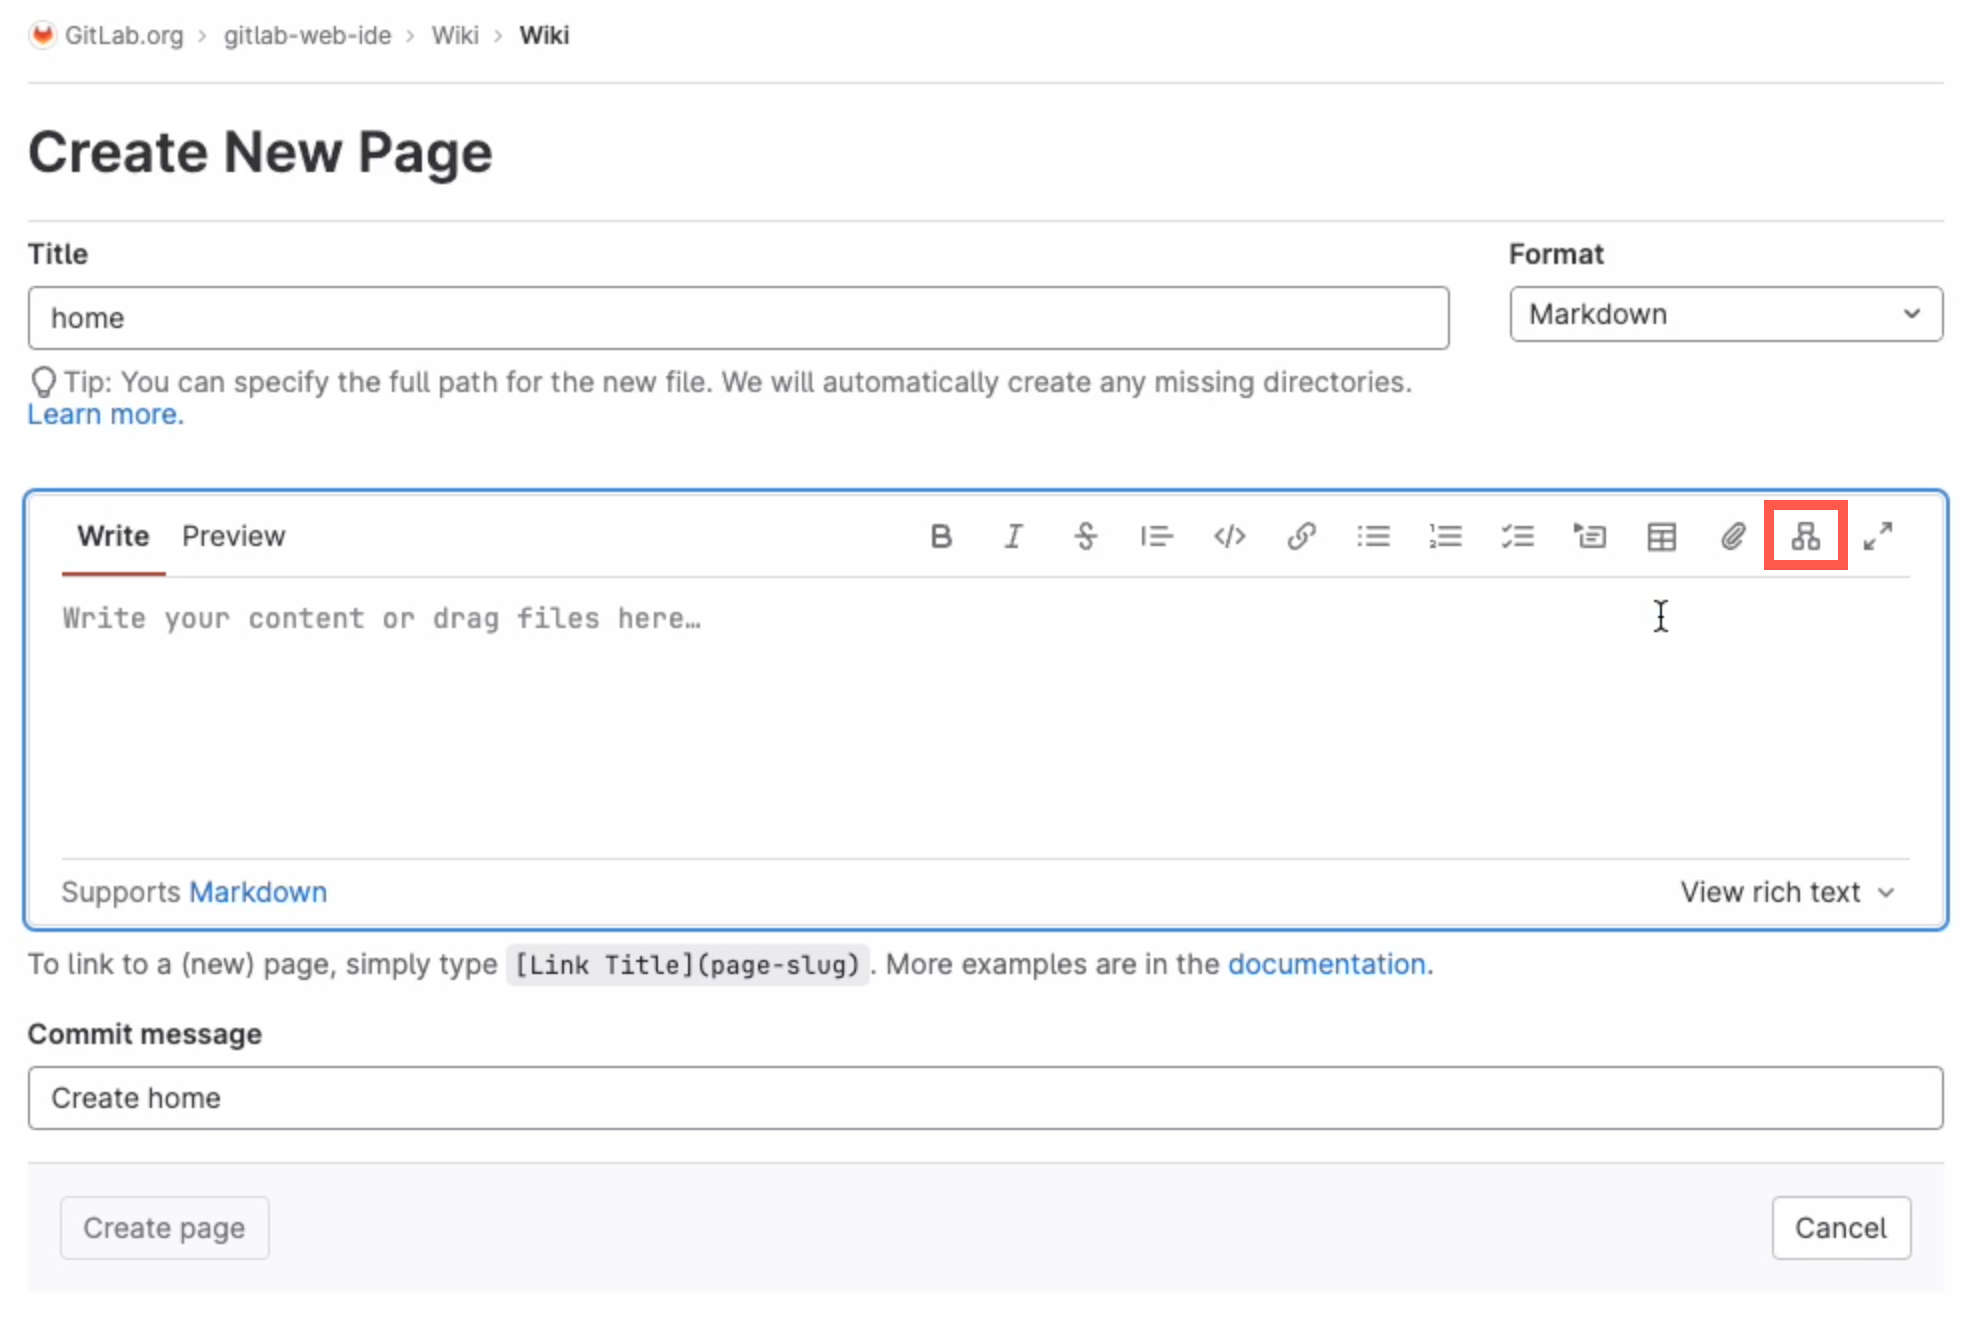
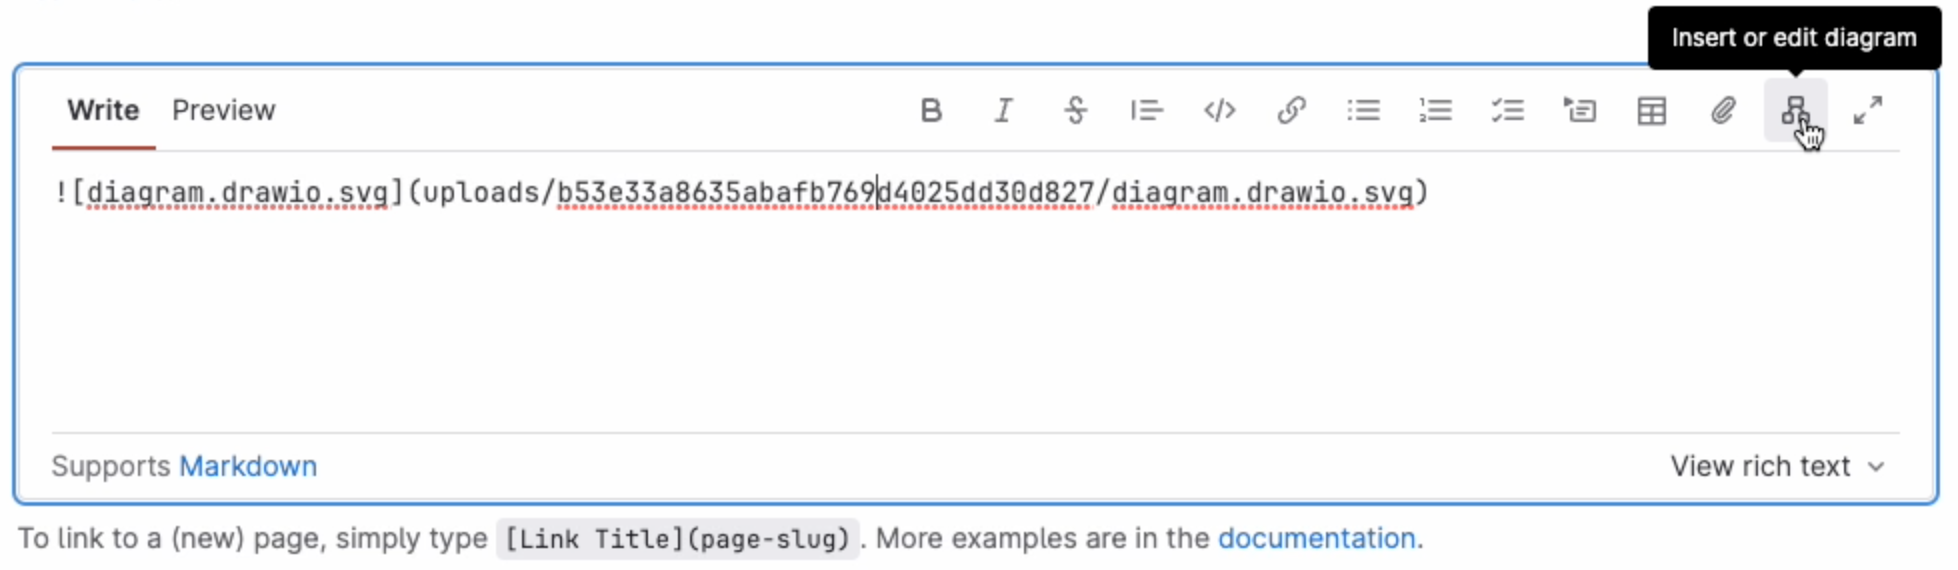
Add a new diagram: Click on Insert or edit diagram in the toolbar in the Markdown editor.
Add a diagram to GitLab in the Markdown editor

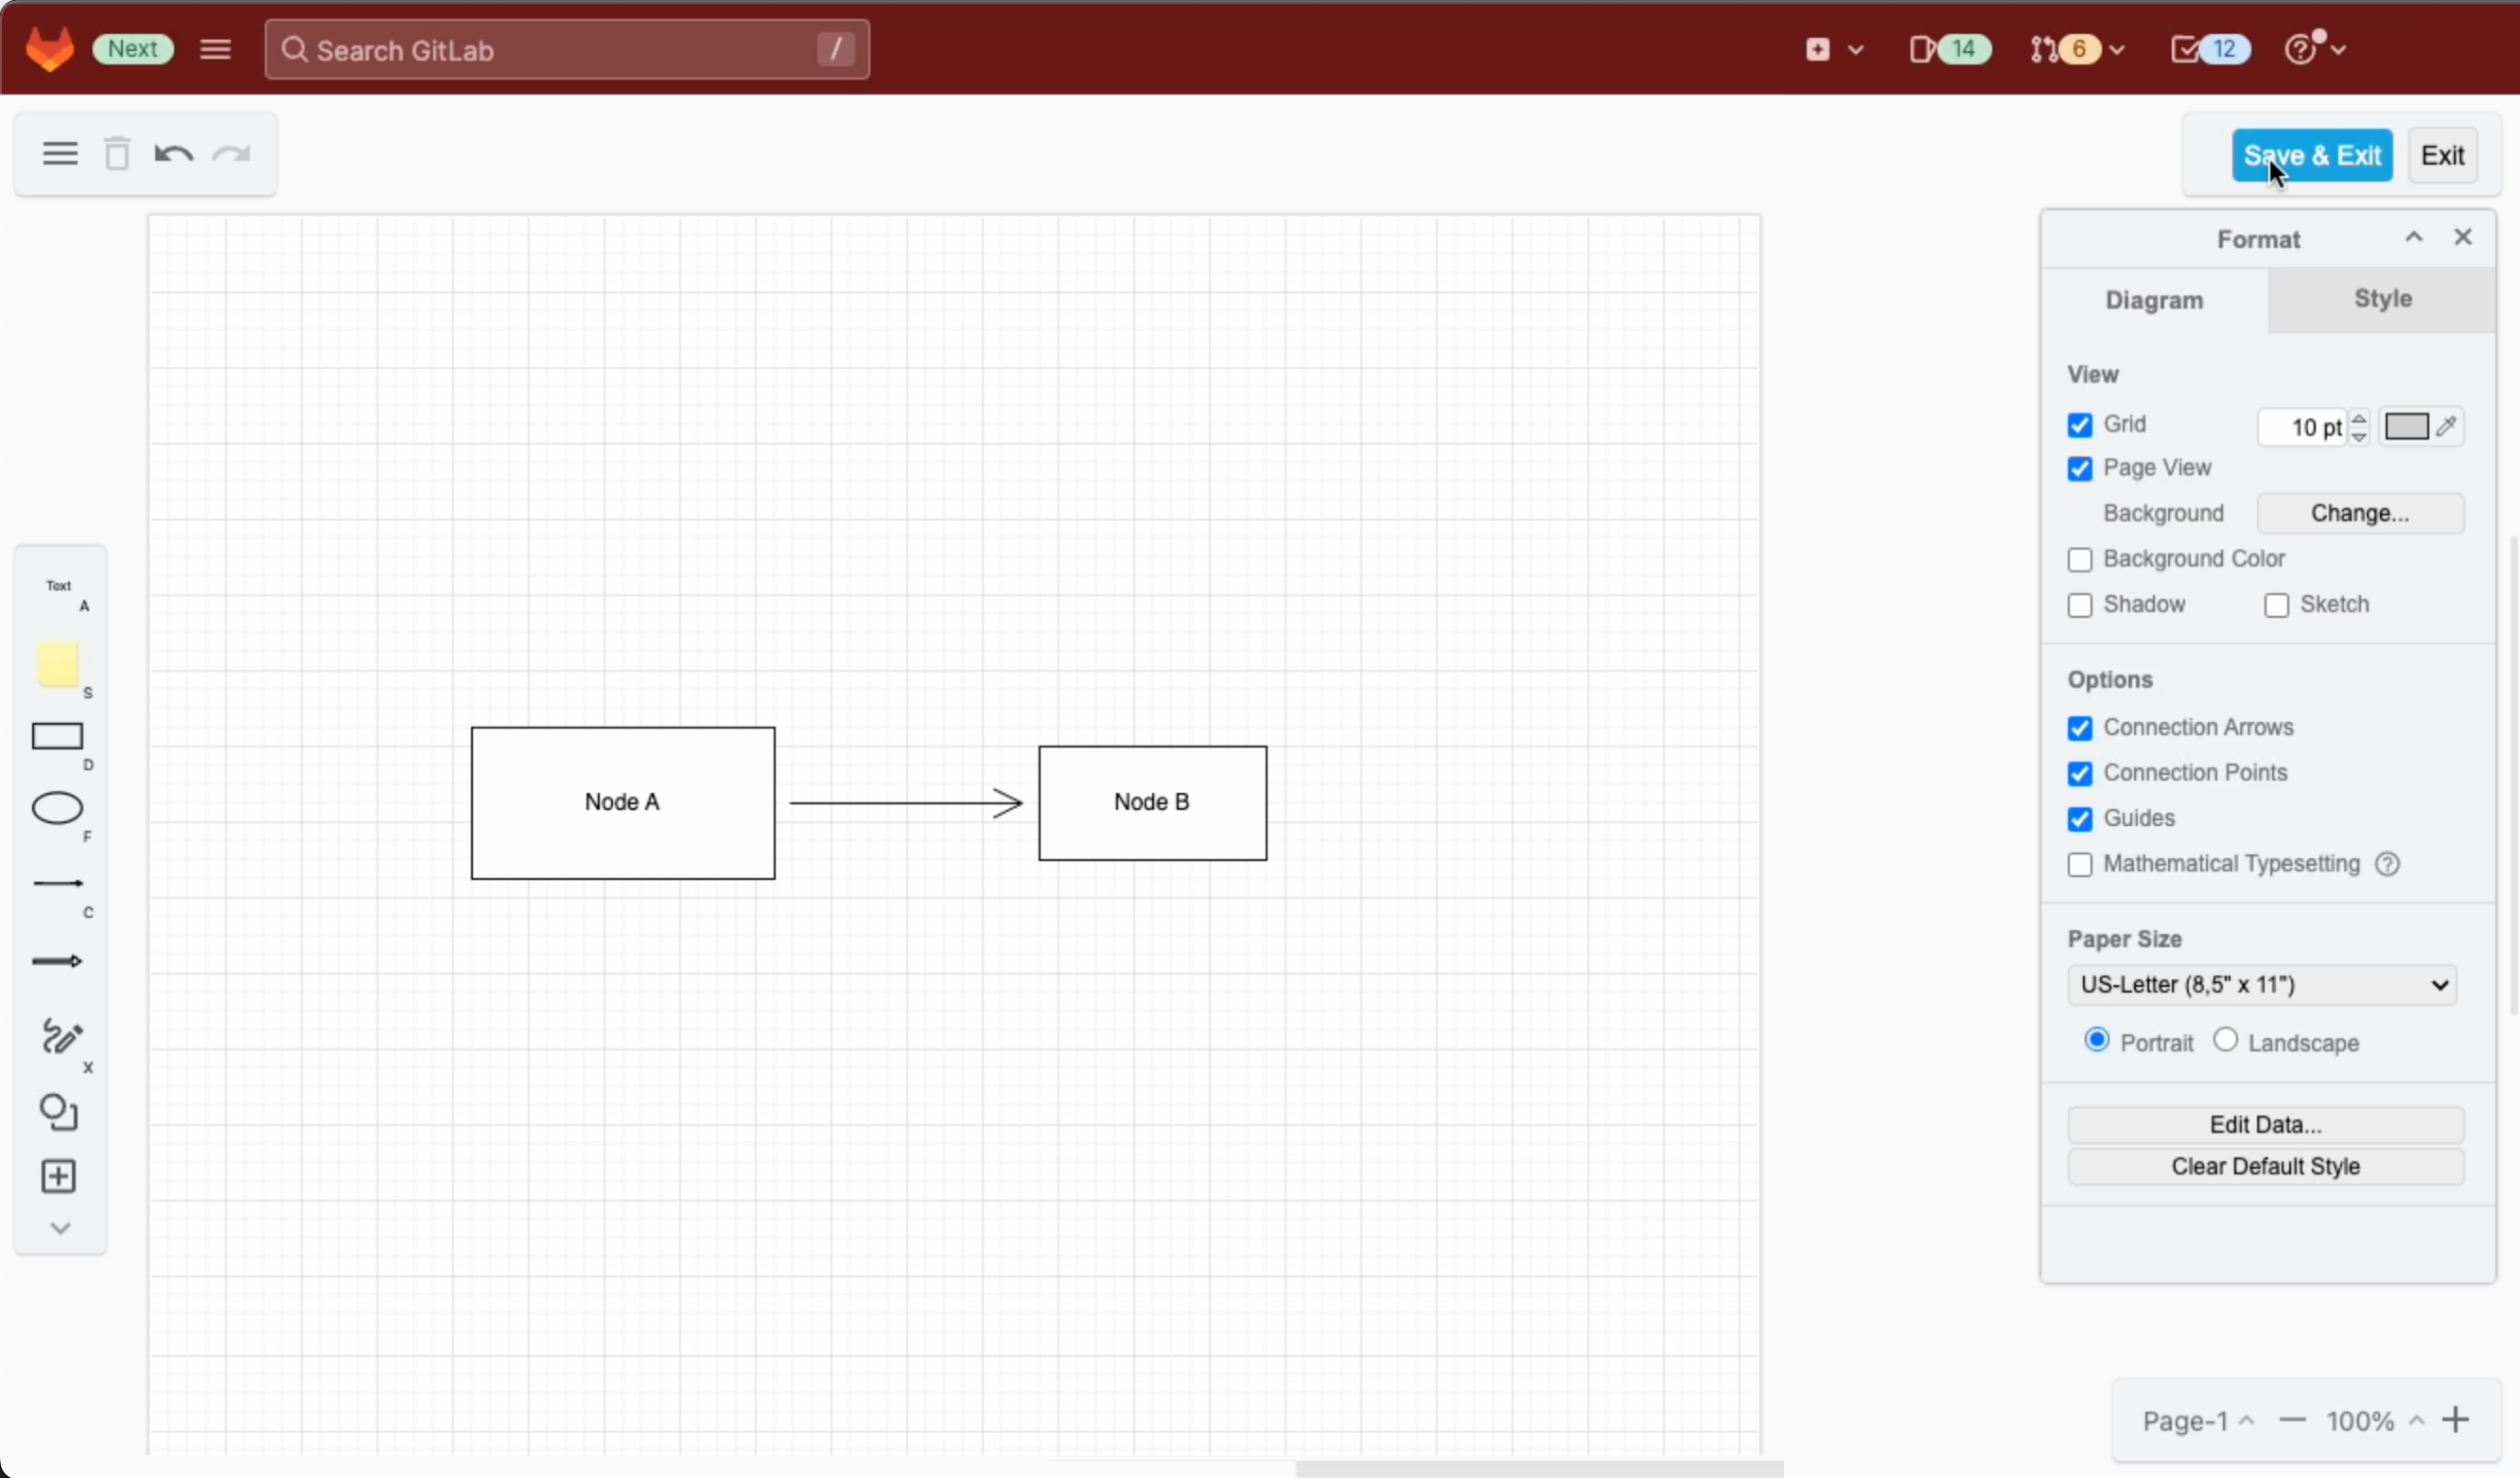
A blank diagram will be opened in the Sketch whiteboard-style editor theme. Use the diagramming toolbar on the left to access templates and shape libraries.
Create your diagram in the Sketch whiteboard-like editor, and save it to return to the GitLab Markdown editor

Save your diagram: It will be added to the page in Markdown as a .drawio.svg file.

Edit an existing diagram: Make sure your cursor is in the diagram file entry in the Markdown code, and select Insert or edit diagram.
Make sure the cursor is in the Markdown reference to the diagram file then edit the diagram in the GitLab Markdown editor

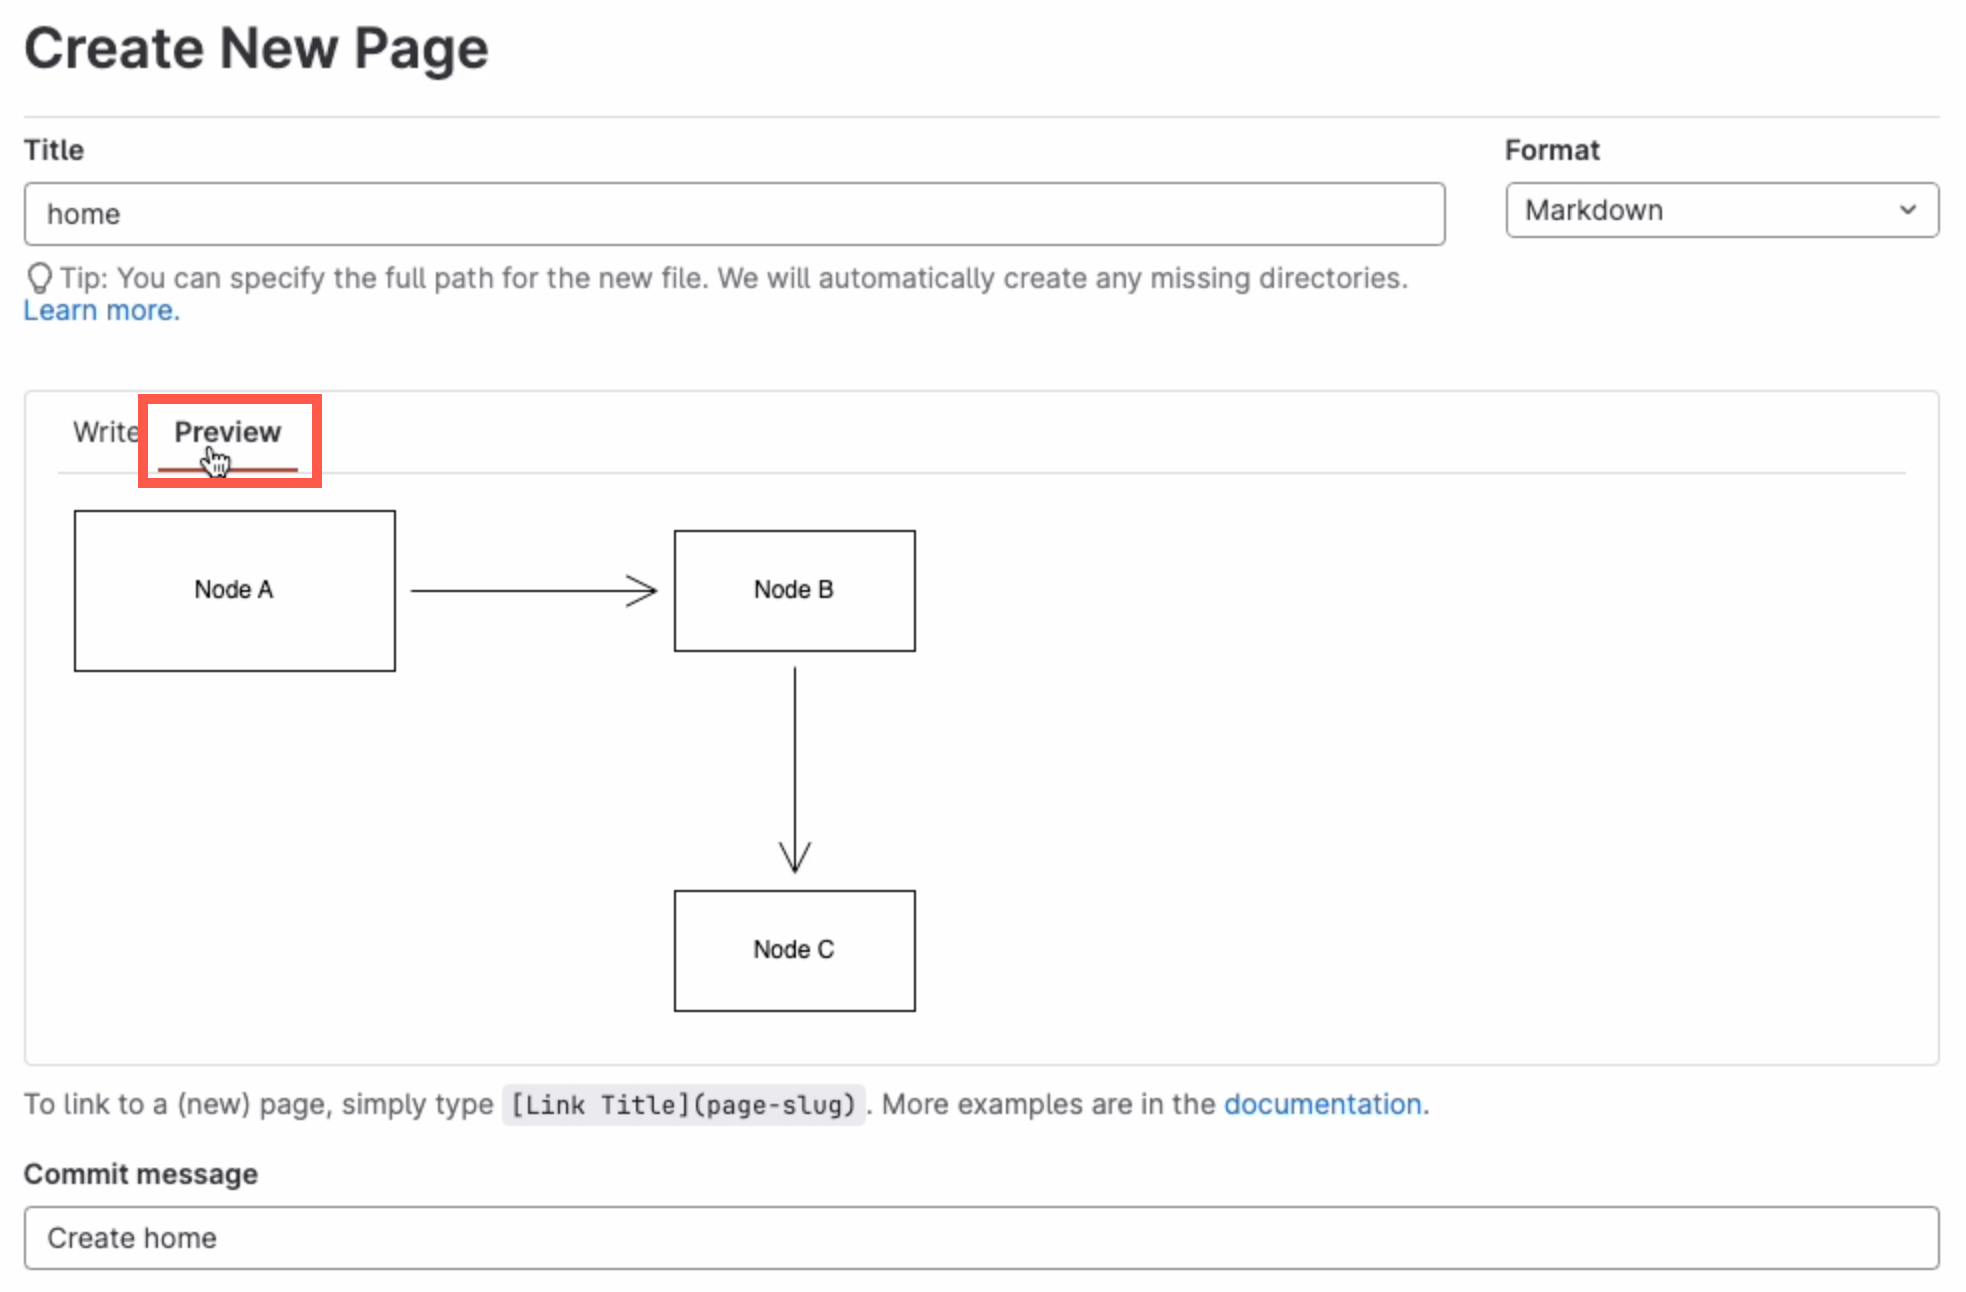
View a diagram in the page: Click on Preview to render the page containing the diagram.
Preview the page to see how the diagram is rendered along with the markdown text content of the GitLab Wiki page

Diagram with the GitLab rich text editor

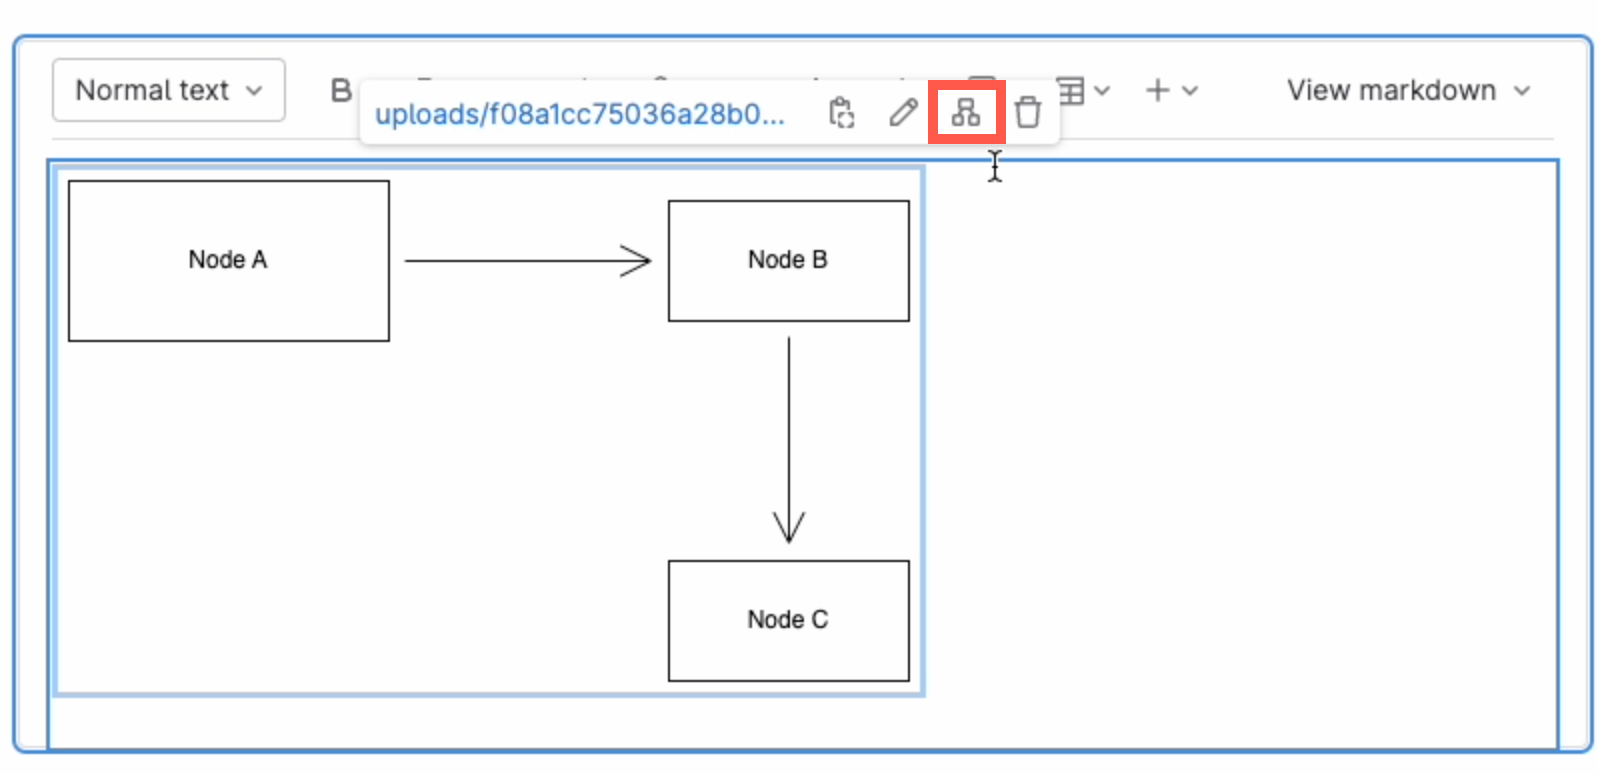
Edit a diagram: Select the diagram, and click on Edit diagram in the hover toolbar that appears above or below.
Click on a diagram and use the hover toolbar to edit it in the GitLab rich text editor

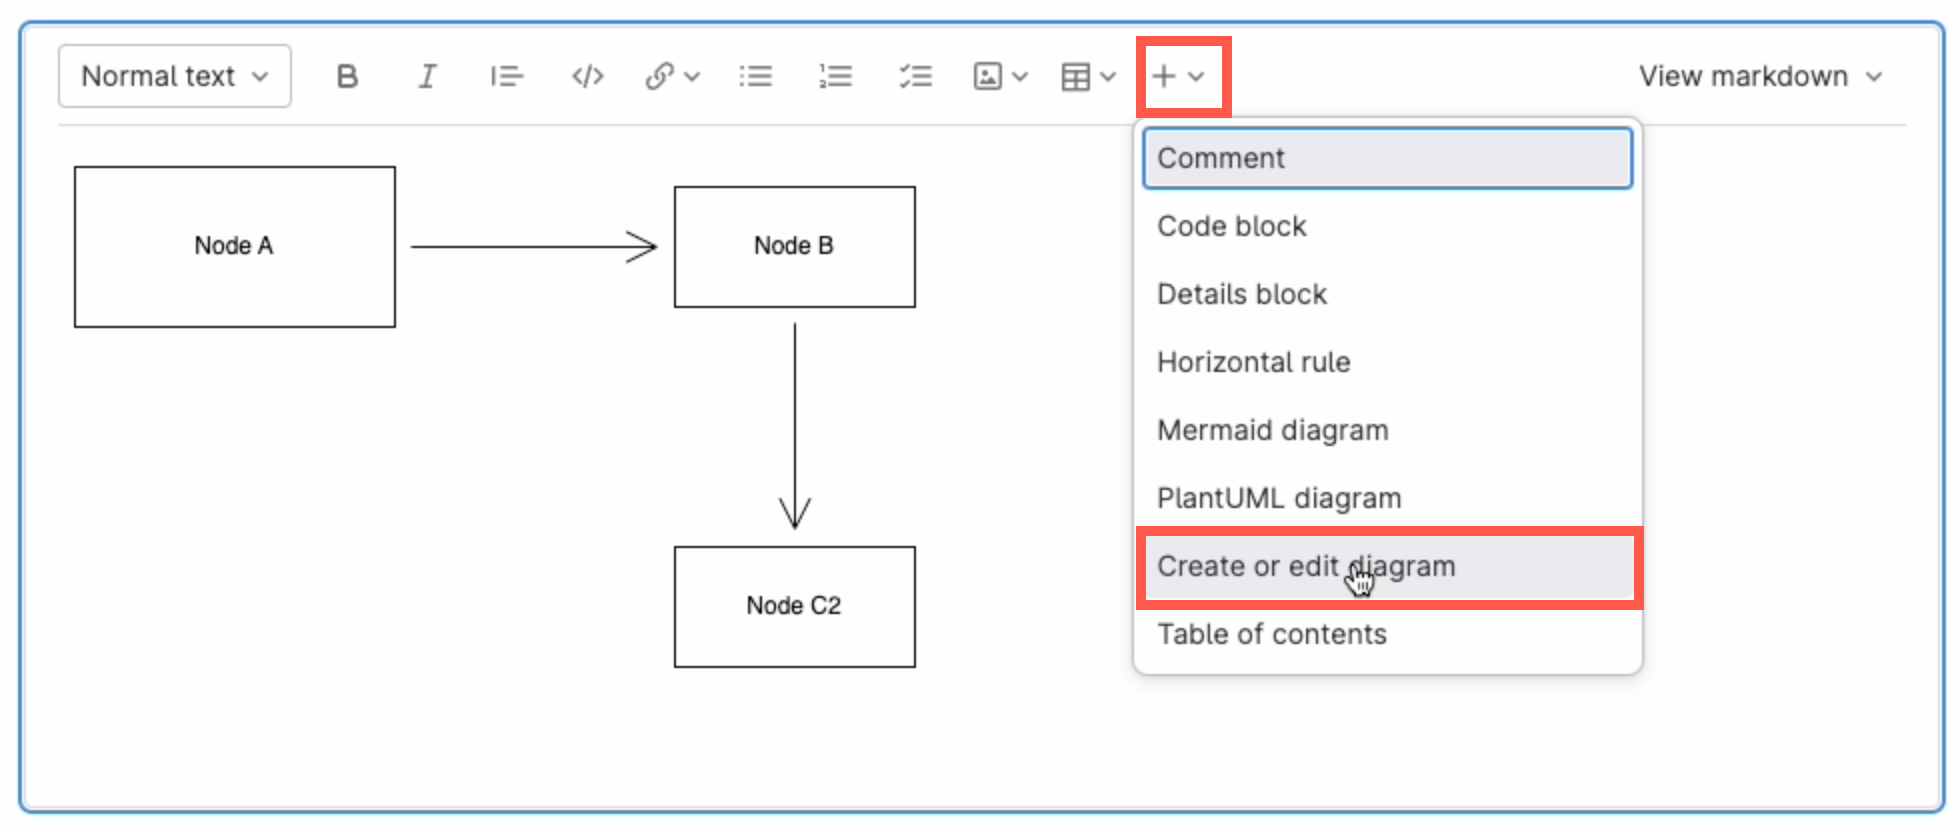
Add a new diagram: Make sure no other diagram is selected, then click on the + in the toolbar and select Create or edit diagram.
Make sure you have not selected any diagram, click on the + in the toolbar and select Create or edit diagram to add a new diagram in the GitLab rich text editor

Save individual diagram files to GitLab

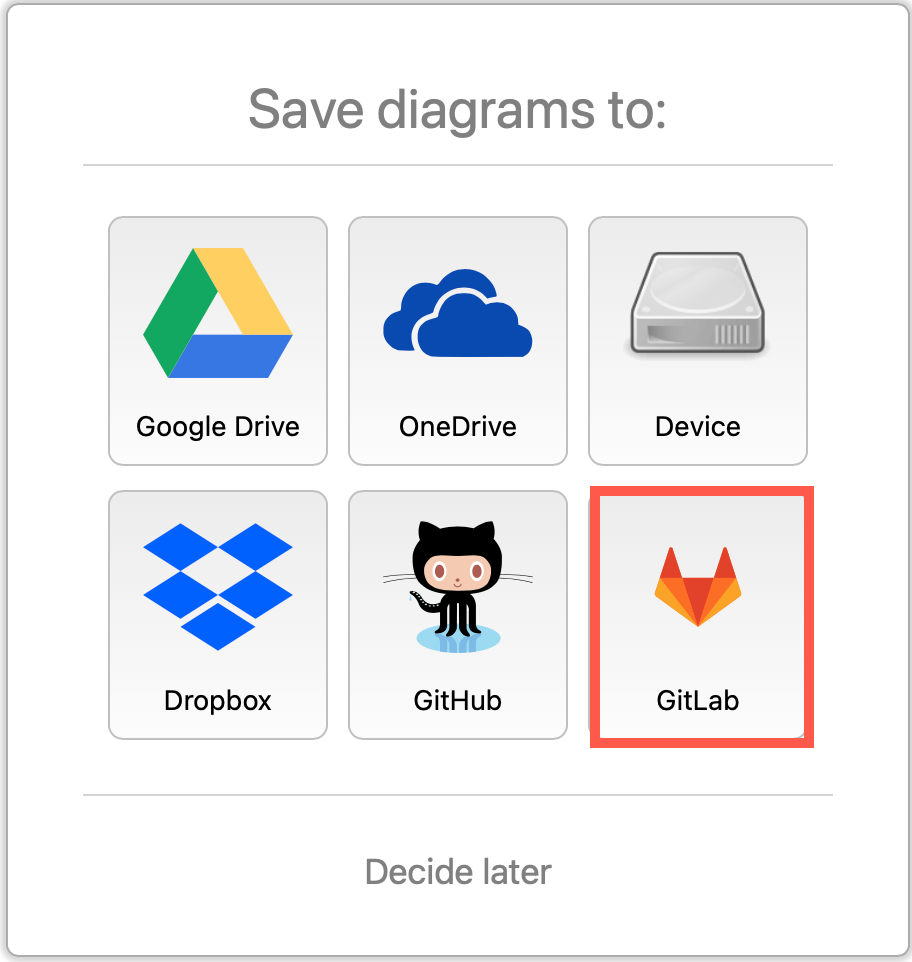
You can also store your individual diagram files in GitLab. Select GitLab as the save file destination when you create a new diagram, or select Save as from the menu.
Select GitLab as the location where you want to store your files

Alternatively go to our online editor to start diagramming now using GitLab to store your diagrams.

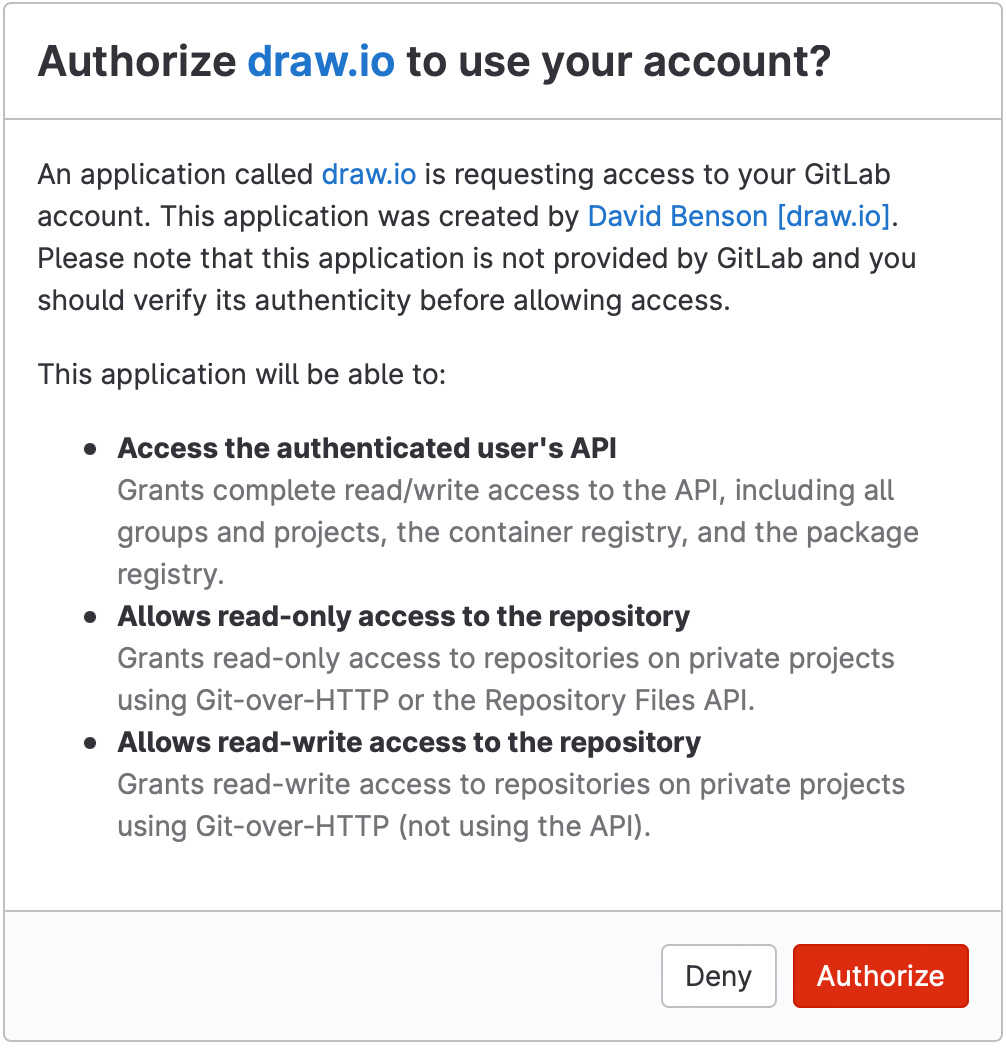
You'll need to authorise access to your GitLab repositories, if you haven't already done so.
Authorize GitLab to save diagram files to this location

Tip:i As draw.io uses secure direct client authorisation, your password is never shared.

Diagram in VSCode with GitLab

  1. Set up the GitLab Workflow extension for Visual Studio Code.
  2. Install Henning Dieterichs' unofficial draw.io extension for Visual Studio Code

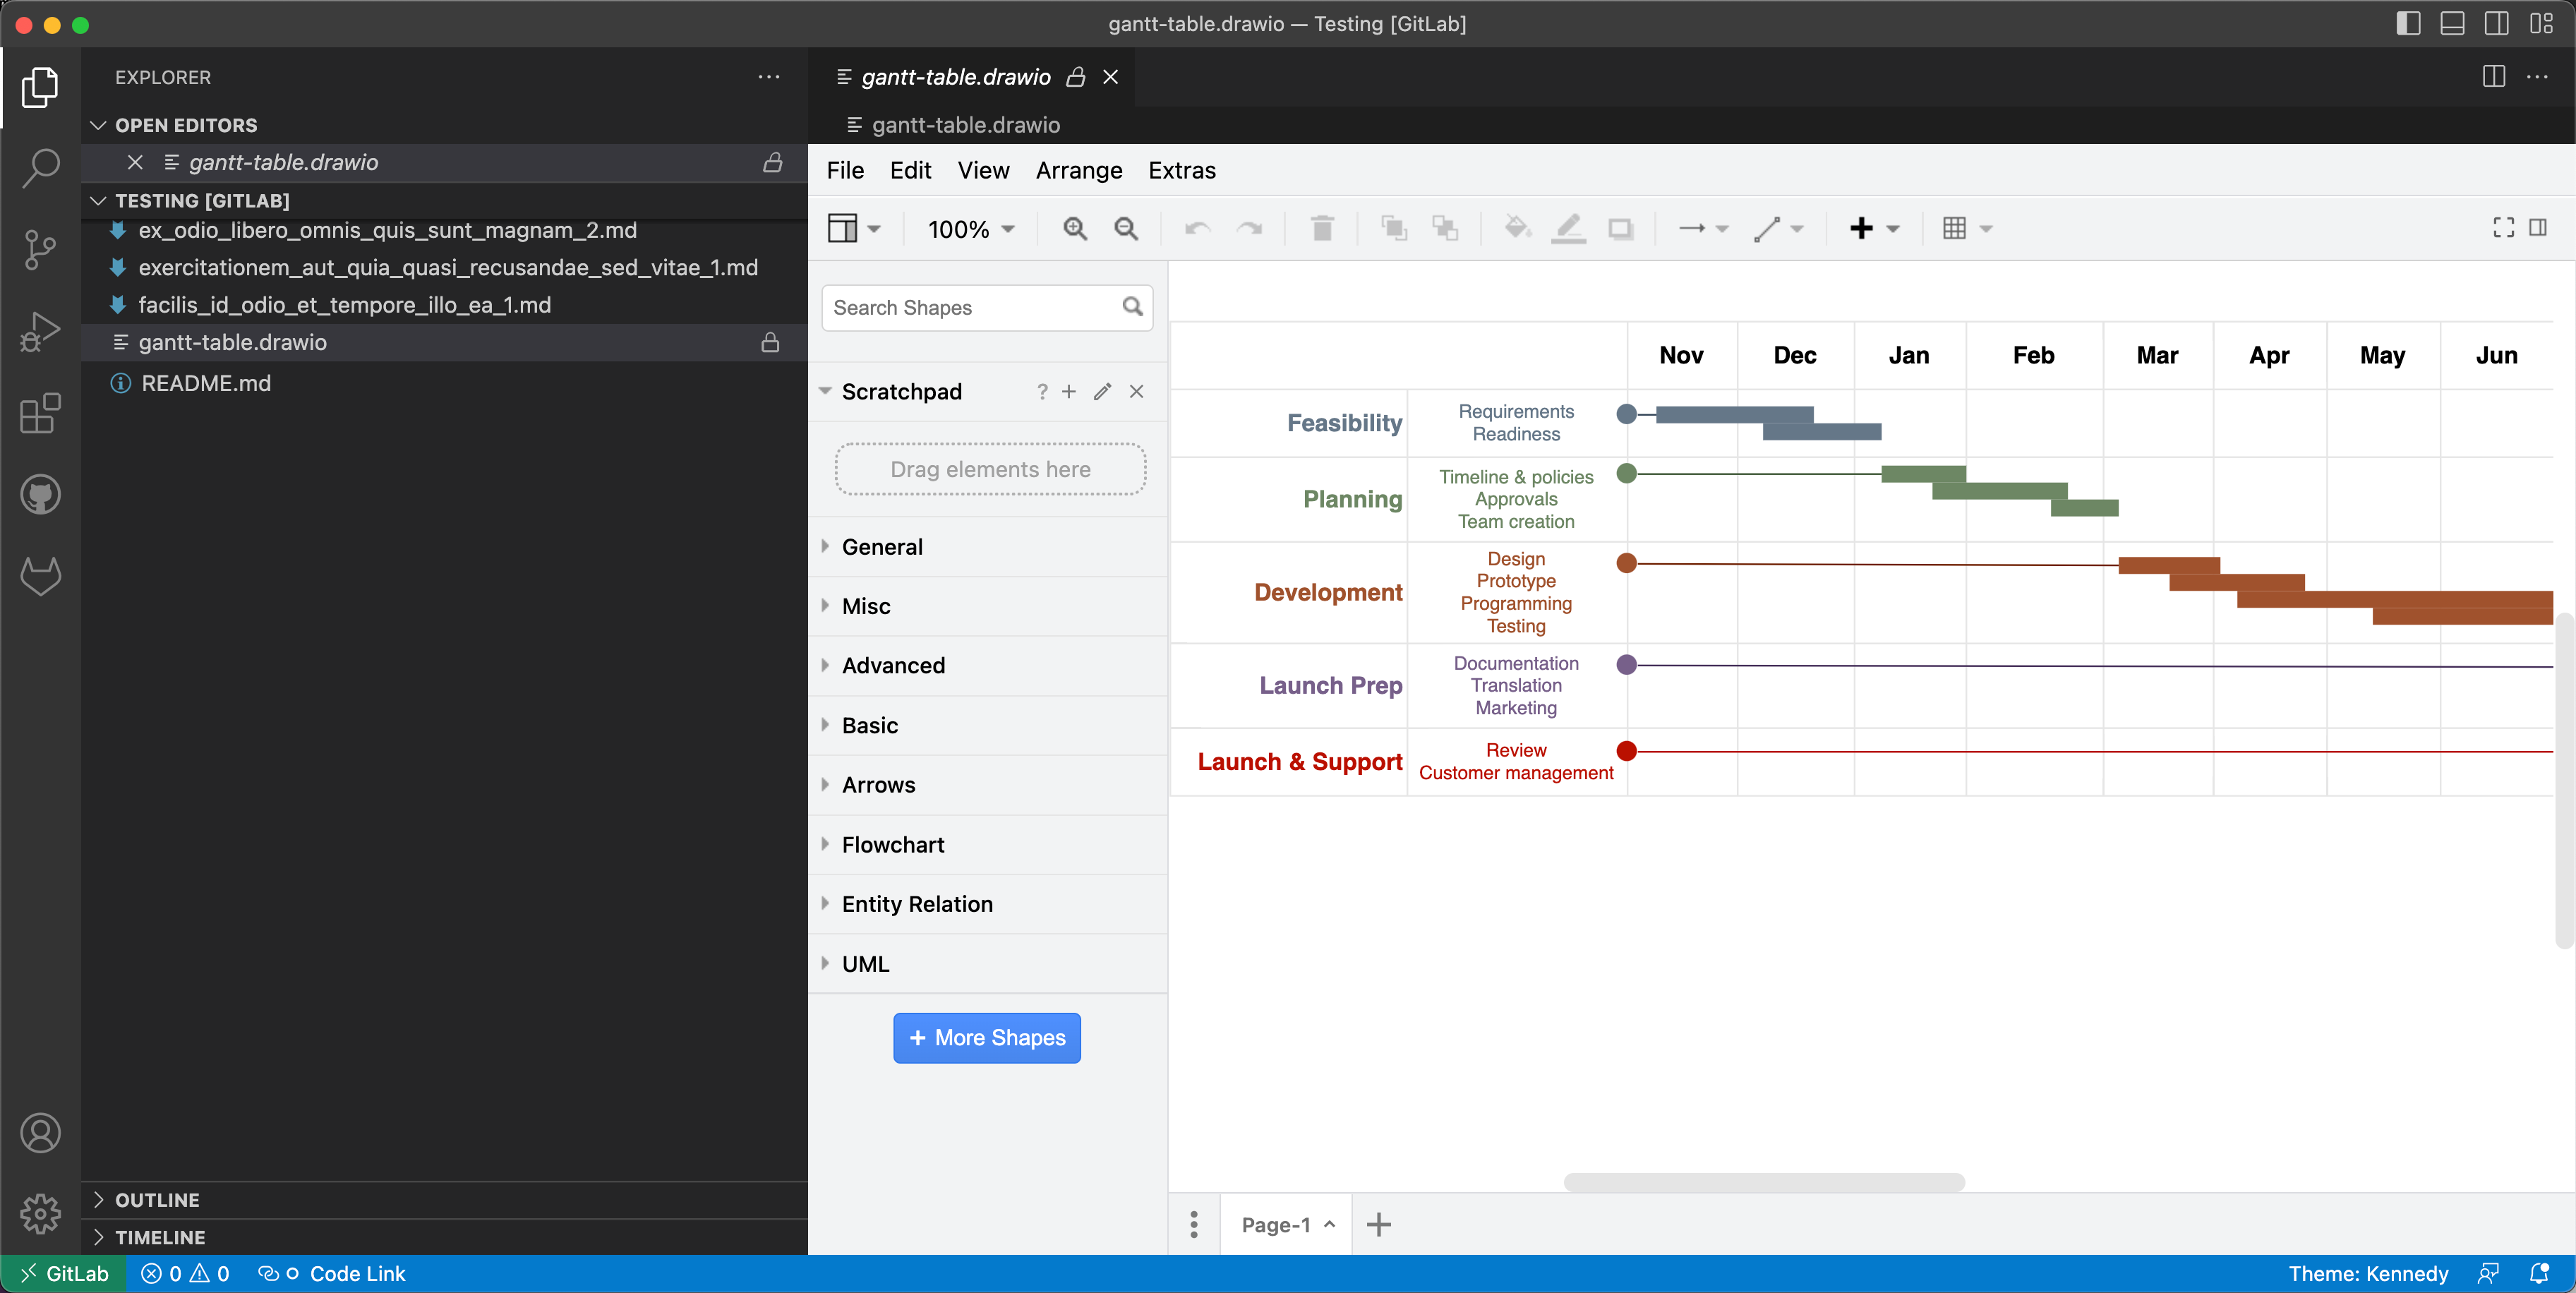
The draw.io extension for VSCode lets you view and edit the .drawio diagram files stored in your repositories.
Use the unofficial draw.io extension for VSCode to edit .drawio files stored in a GitLab repository directly in the Visual Studio Code editor

See how this extension works in GitHub - it works in a similar way with GitLab inside VSCode.

Note: The extension only recognises files with the .drawio file extension.

Thanks for supporting draw.io in 2022

· 4 min read

It was quite a year. We want to take this opportunity to thank you for your support, look back at some of the features we've added and updated.

To our diagram editor users

Whether you use our web-based draw.io app or one of our draw.io integrations, or our standalone desktop app, thank you for your support, feedback, and participation in our Google forum and GitHub discussions.

To our open-source contributors and sponsors

Also to our development and support team, translators, bug reporters, and open-source sponsors - we love that you love our secure diagramming app. Thank you for your support and contributions this year.

To those open-source projects and developers we sponsor

Particularly Henning Dieterichs (unofficial draw.io extension for VSCode), Preet (rough style for shapes) and Dan Brown, but we'd like to thank all those we sponsor for your contributions to the open-source community and our application.

New features and updates in 2022

The biggest and most recent new draw.io feature is our redesigned toolbar and menu for a distraction-free diagram editor.

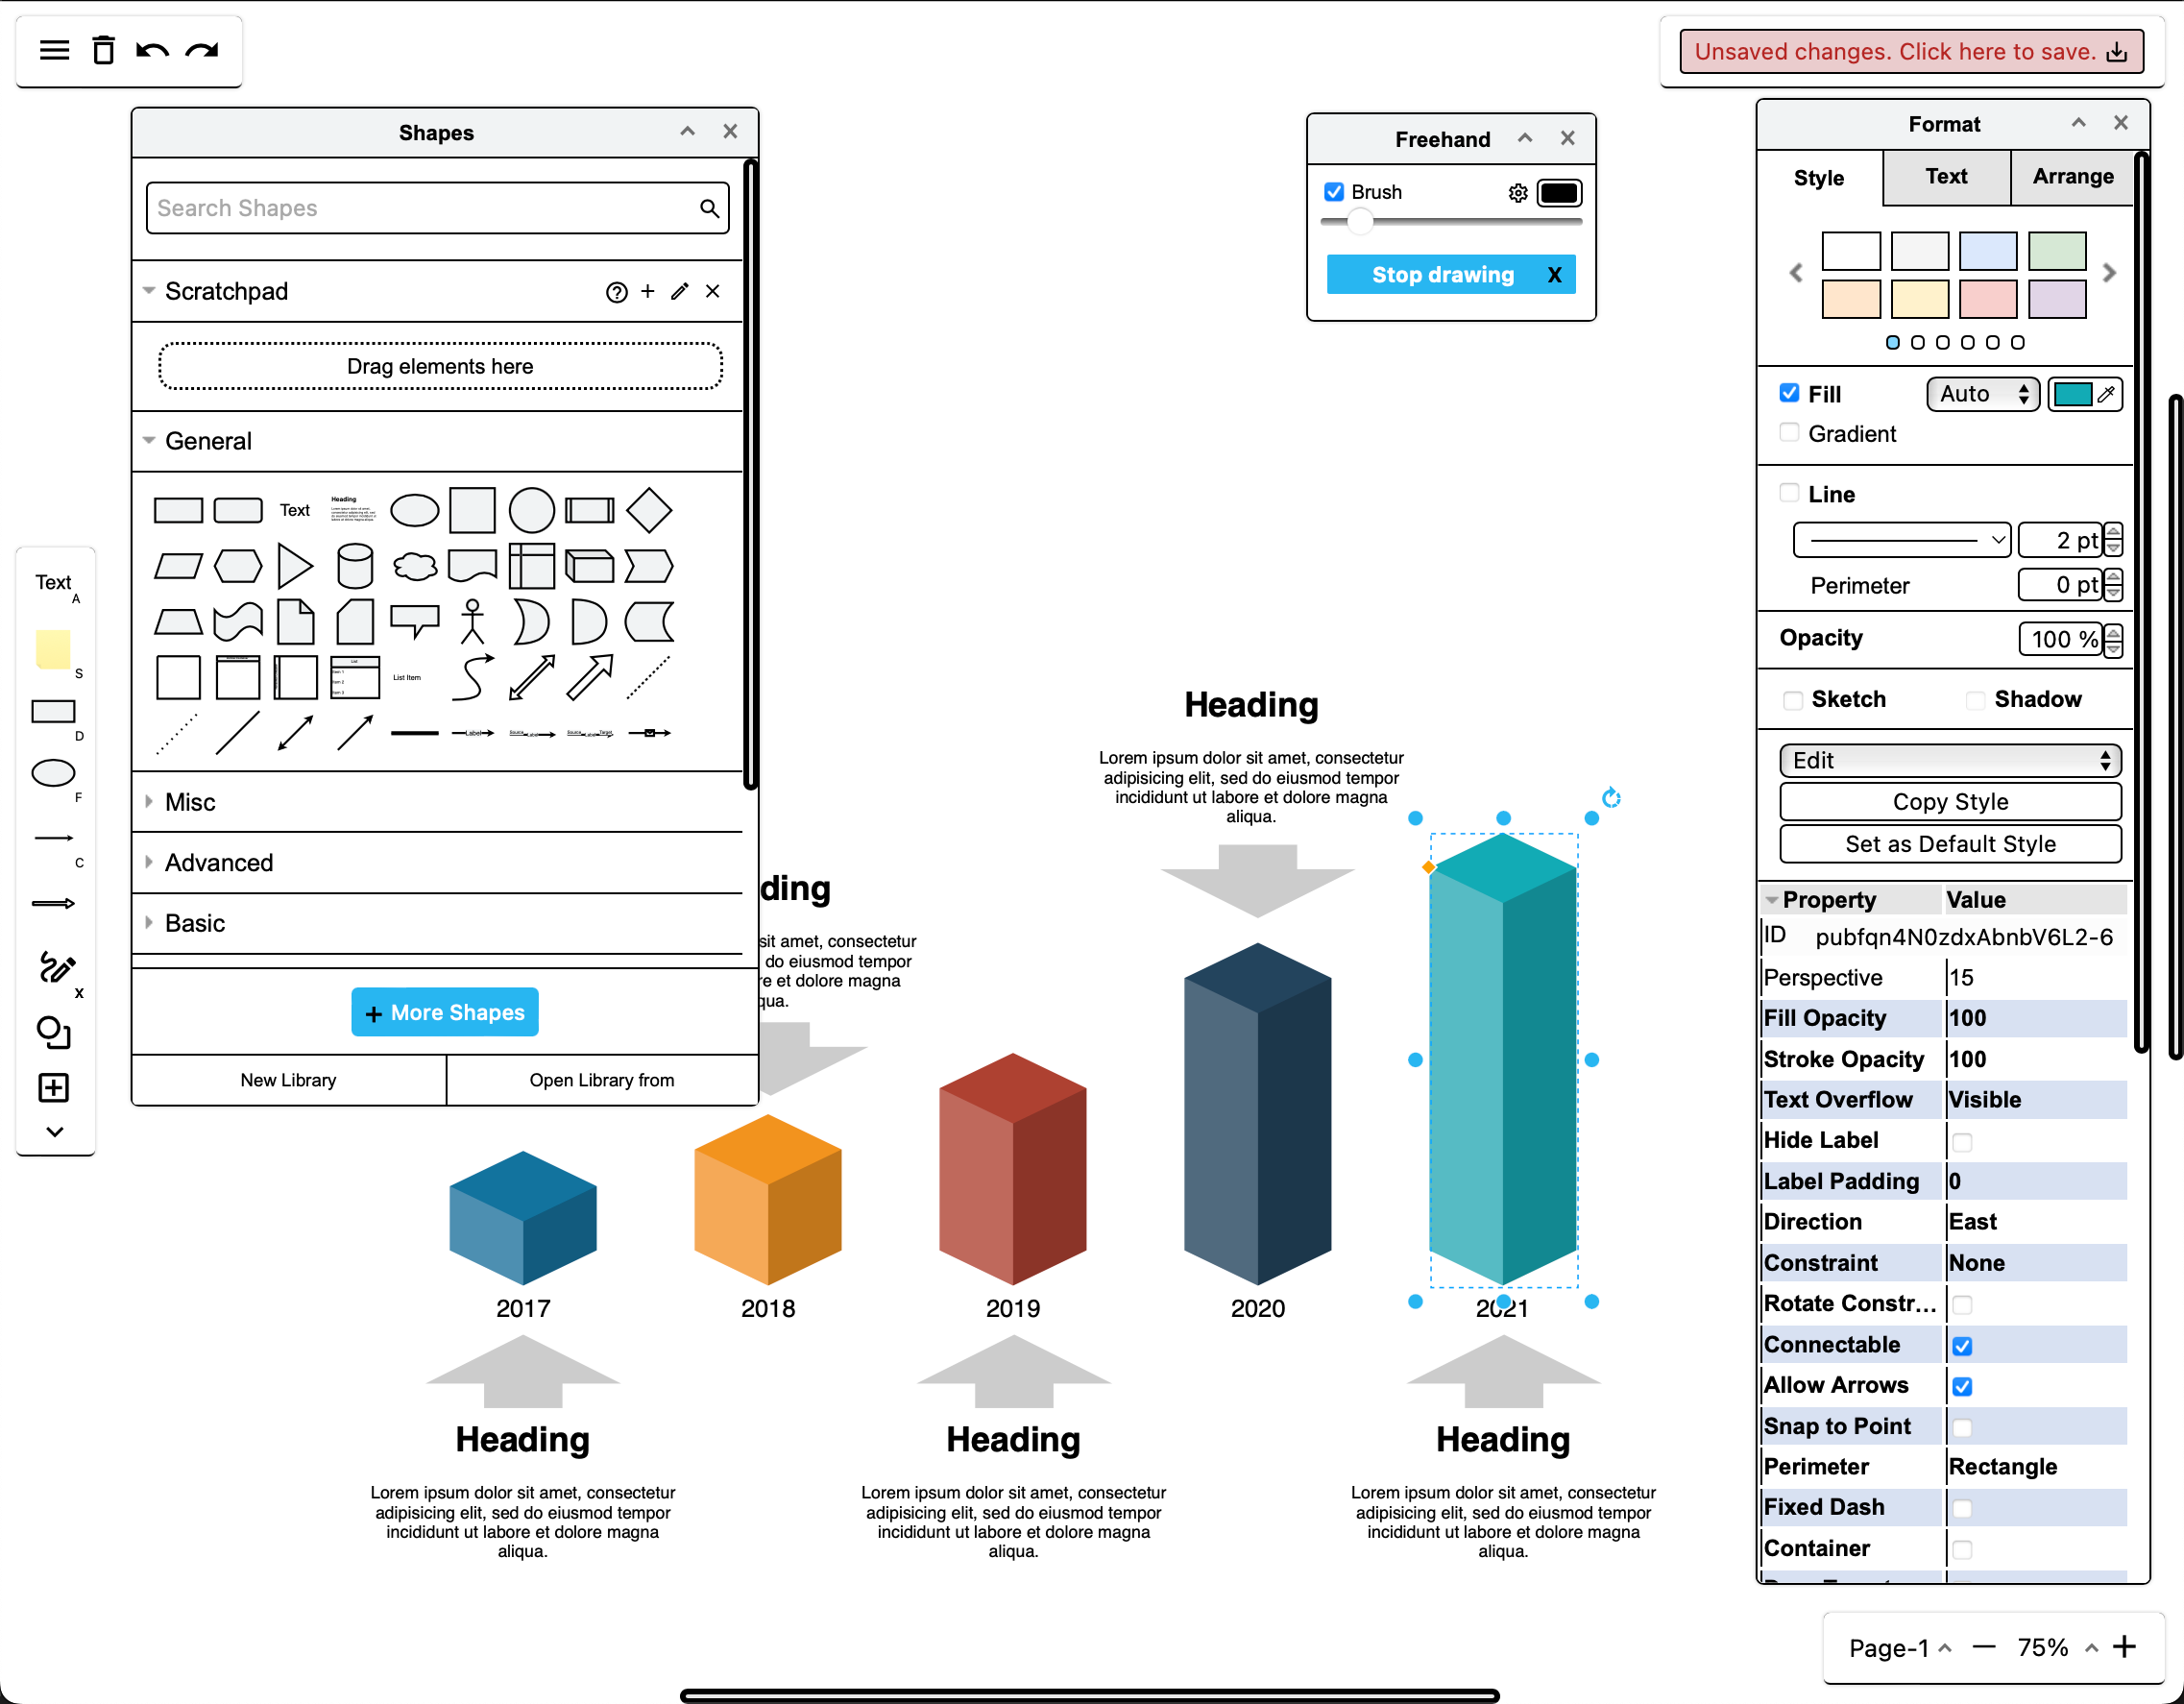
The new simple mode takes the best parts of all of our editor themes and blends them together with a simple, responsive toolbar and large drawing canvas. To switch to this mode, click on the sun/moon in the top right, and select Simple.
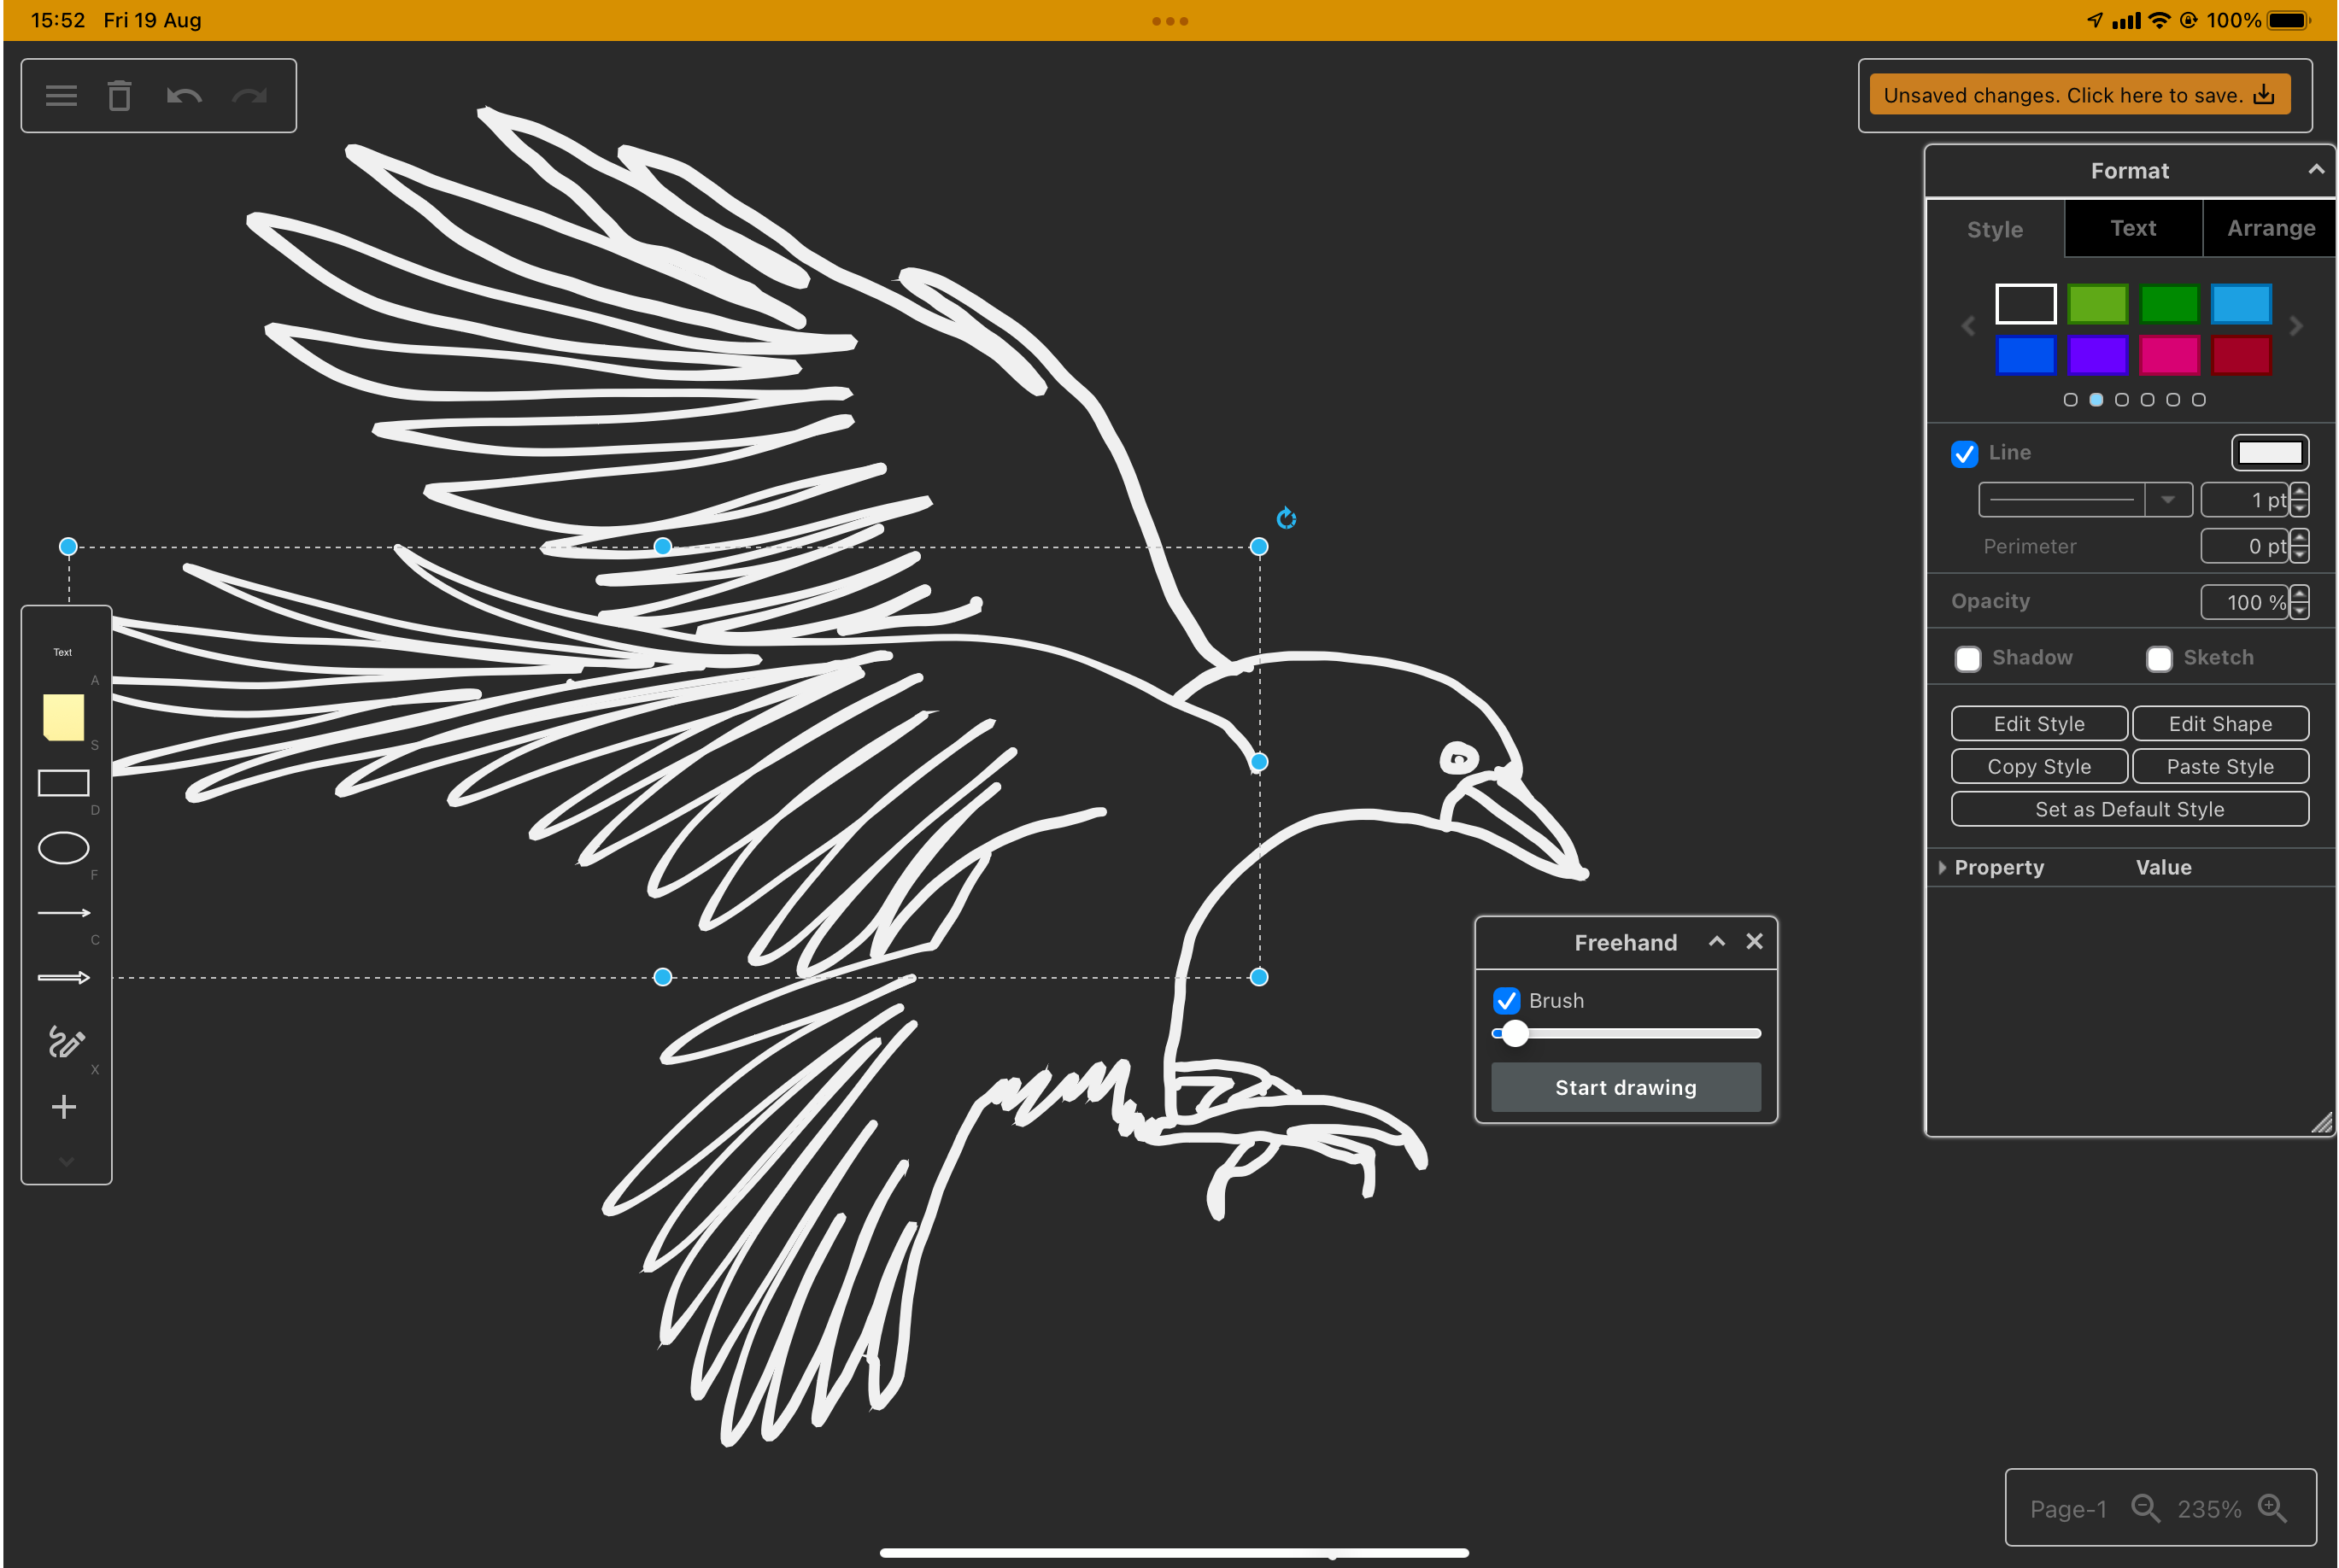
Draw a freehand shape in your diagram via the toolbar in simple mode in draw.io

  • draw.io users in Confluence Server/Data Center can apply a sensitive label to exclude diagrams from recent lists and search.

  • draw.io users in Confluence, and with Google Drive and Microsoft One Drive can see each others' mouse cursors in real time as they collaboratively edit a diagram.
    Share your mouse cursor with others who are editing the same draw.io diagram in Confluence Cloud

  • Improvements were made to the mass Gliffy import and Confluence instance migration tools for draw.io users.

  • Shape libraries have been expanded and updated with new icons - particularly the Azure, AWS, Google Cloud and SysML shape libraries.

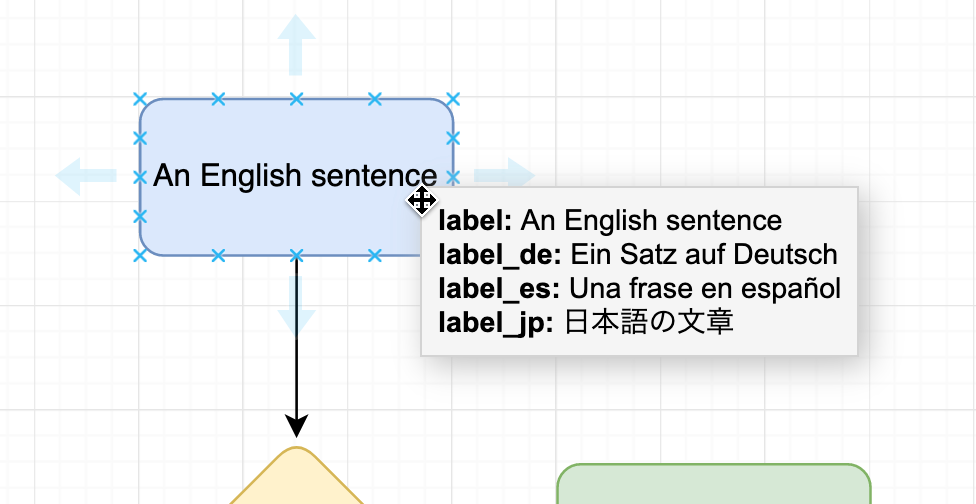
  • You can add and edit translations within the shape labels as shape metadata - no need to keep separate diagrams for separate languages.
    Translate labels on shapes and connectors directly in the draw.io editor

  • The editor was translated into new languages - Lithuanian and Latvian.

  • Switch between dark and light modes without having to reload the browser tab - click on the sun/moon in the top right and select Dark.

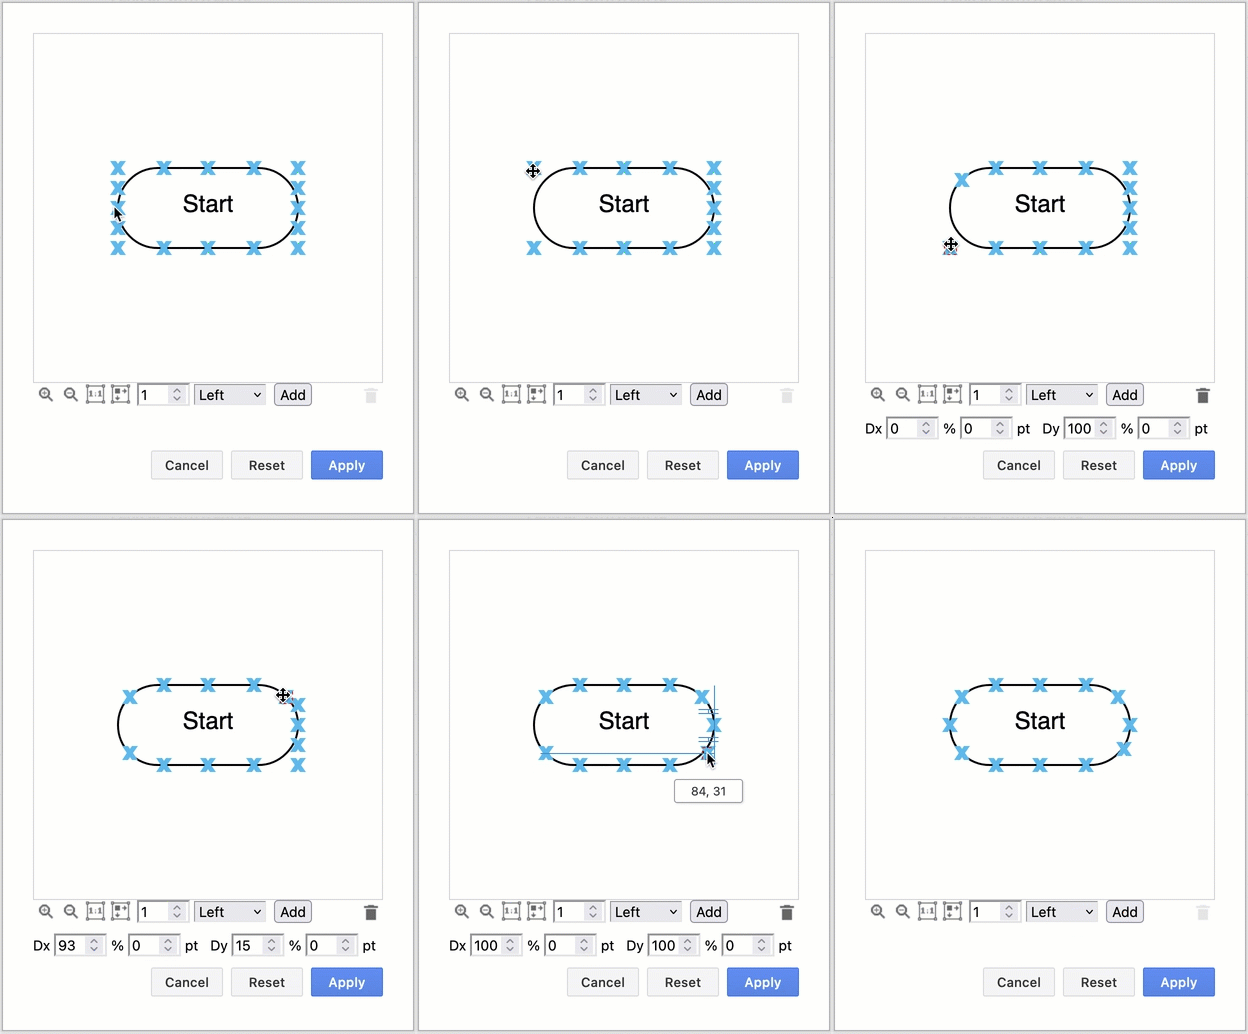
  • A connection point editor tool was added - you can now easily customise the fixed connection points for any shape on the drawing canvas.
    Move, delete and add connection points to a shape visually in draw.io

  • Swap existing shapes on the drawing canvas by holding down Shift as you drag one over the other. Flip connectors and groups of shapes via the Arrange tab on the format panel.

  • Number shapes and connectors with the built-in enumerate property (to replace the number plugin).

  • To run your own diagramming server, you can use our Docker image of draw.io for secure and private diagramming behind your firewall.

  • Freehand drawing was updated with a variable size brush, which works well with a tablet and pen.
    Freehand drawing in draw.io on a tablet - click the freehand tool in the toolbar on the left

  • Several advanced tools and features were updated, including Mermaid import, mathematics typesetting, rough style, CSV import, image cropping, font mapping, SVG export, drag and drop diagram import, and more.

  • More integrations with a wider range of tools for built-in diagramming - thanks to the developers who have integrated our open-source diagram editor.

And, of course, our team also published a mountain of bug fixes, security patches and smaller optimisation changes to both the web version of draw.io and our own draw.io app integrations.

The many faces of draw.io

· 3 min read

Finding a typo-proof word that is also pronounced the same throughout the world is simple, how sensible companies fail to stop users from mis-spelling product names eludes us. draw.io demonstrates the right way to do this, clearly. However, a small, minor, fractional, minority of users regularly fall asleep on their keyboards while typing our product name, this is the only rational explanation.
Freehand drawing in draw.io on a tablet - click the freehand tool in the toolbar on the left

craw.io - do our diagrams make you angry? Or maybe it's a reference to the cleverness of crows? Do those filthy BPMN shapes make your skin crawl?

dra.io - the languages with a close appropriate meaning would be Norwegian (to draw or drag) or Swedish (to pull or tell a story). Or perhaps Yola, the Forth and Bargy dialect (to draw) in County Wexford. We bet you've dropped your lunch under the w key.

dran.io - your turn! (German) Seriously, we're not sure how n slips in for w as those two keys are usually far from each other in most layouts. Perhaps Maltron 3D keyboard users slipping from the a?

draq.io - uncertain, unexpected, indefinable, but riveting. Or perhaps fashionable? Or cut off accidentally while typing something longer...

drag.io - a wonderfully concise description of how to use draw.io - drag shapes onto the canvas and drag connectors between them.

drsw.io - That's tough to say after you've been drinking. Maybe that's the reason you spelt it like that. But that's cool, we'd totally all vote for Sanna Marin if we could.

drwa.io - Polish for firewood or wood, probably. Also Creole for right (entitlement).
Different types of hardwood and softwood trees for firewood, and useful firestarters

dwaw.io - this brings to mind an old movie ...
"Mawwiage ... mawwiage is what bwings us togevvar, today."

draw.net and diagrams.io - how could anyone get this wrong? Our naming change will go in marketing textbooks for years to come as an example of how to re-brand effectively.

diagram.io - our top secret site to get money from you. You're only allowed a single diagram here, until you pay up and we redirect you.

graph.io - because draw.io is developed by JGraph? Or is it diagrams.net...

drow.io - flanked by dark elves? Seriously though, the aw sound in English is difficult in other languages - in Japanese, it is closest to the vowel o. It seems to be tricky in Spanish, too.
drow.io should really redirect to a vector drawing of Drizzt.

ddra.io - when said aloud, this is suspiciously close to daedra. Perhaps we should ask Bethesda if Hermaeus Mora, Jyggalag or Peryite is the patron prince of diagrams? Ooo, an idea - a wabbajack tool for hilarious chaos when teams collaborate!

It's summer, we're bored and it's hot. If you'd like to contribute additional misspellings or propose different meanings for those above, share it with draw.io on Twitter.

How many of these domains will be purchased within a week? You can offer to sell them to us at [email protected].

Gliffy vs draw.io - concurrent editing

· 4 min read

TL;DR : Gliffy on Confluence Cloud saves with last write wins, you lose data concurrently editing. draw.io supports real-time collaborative editing with shared cursors.

Gliffy vs draw.io for Confluence

When comparing diagramming apps, you'll see lists of standard Confluence-supported features - sharing, import and export, search, version history, customisation, security - and, of course, pricing.

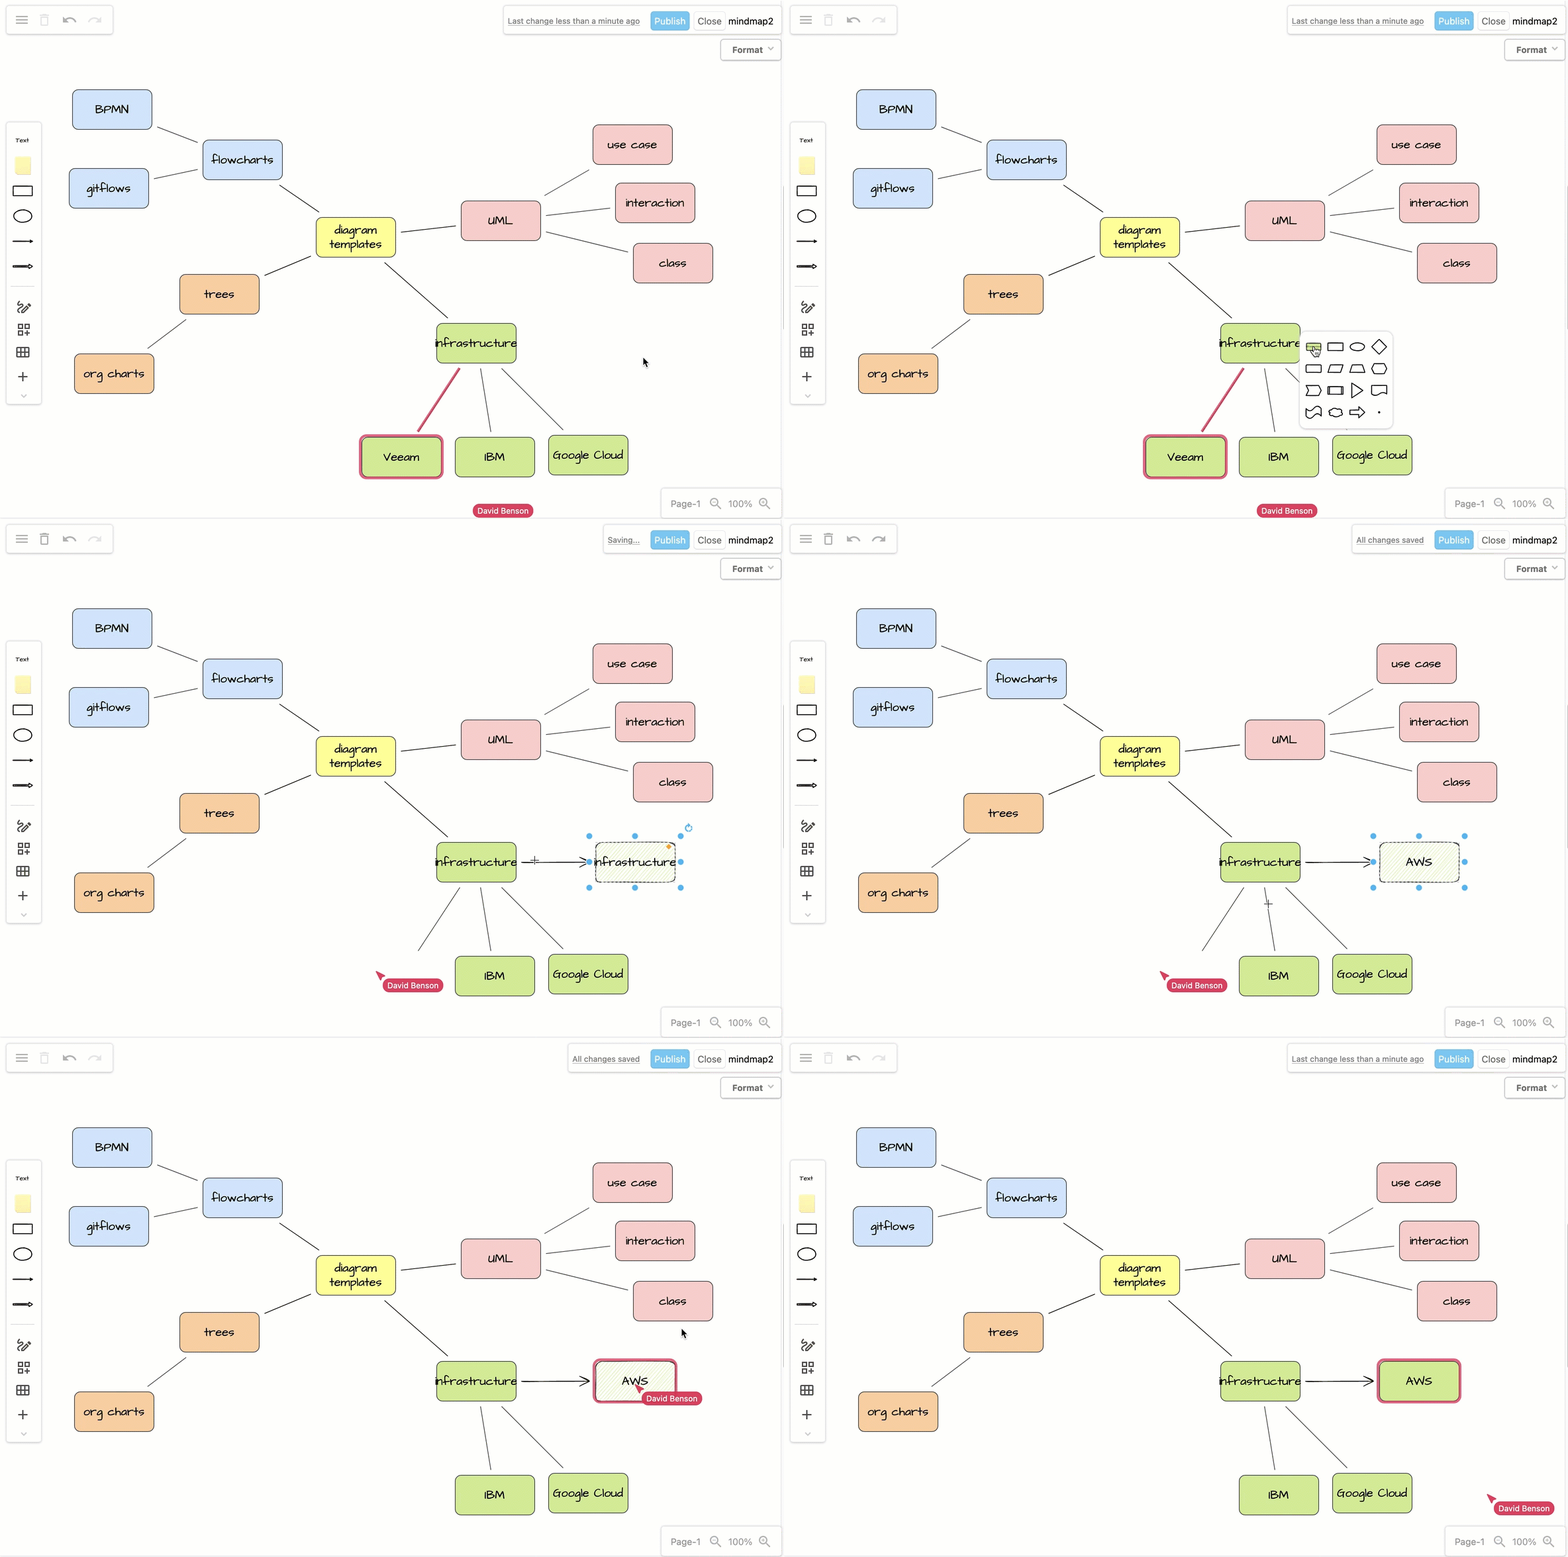
Unlike Gliffy, draw.io has concurrent diagram editing. All team members' changes are merged and synchronised - visible to each other in the diagram editor.

When you choose to show your cursor, your team will see where you move your mouse and what you select, all in real-time.

Shared cursors mean better collaboration in draw.io for Confluence

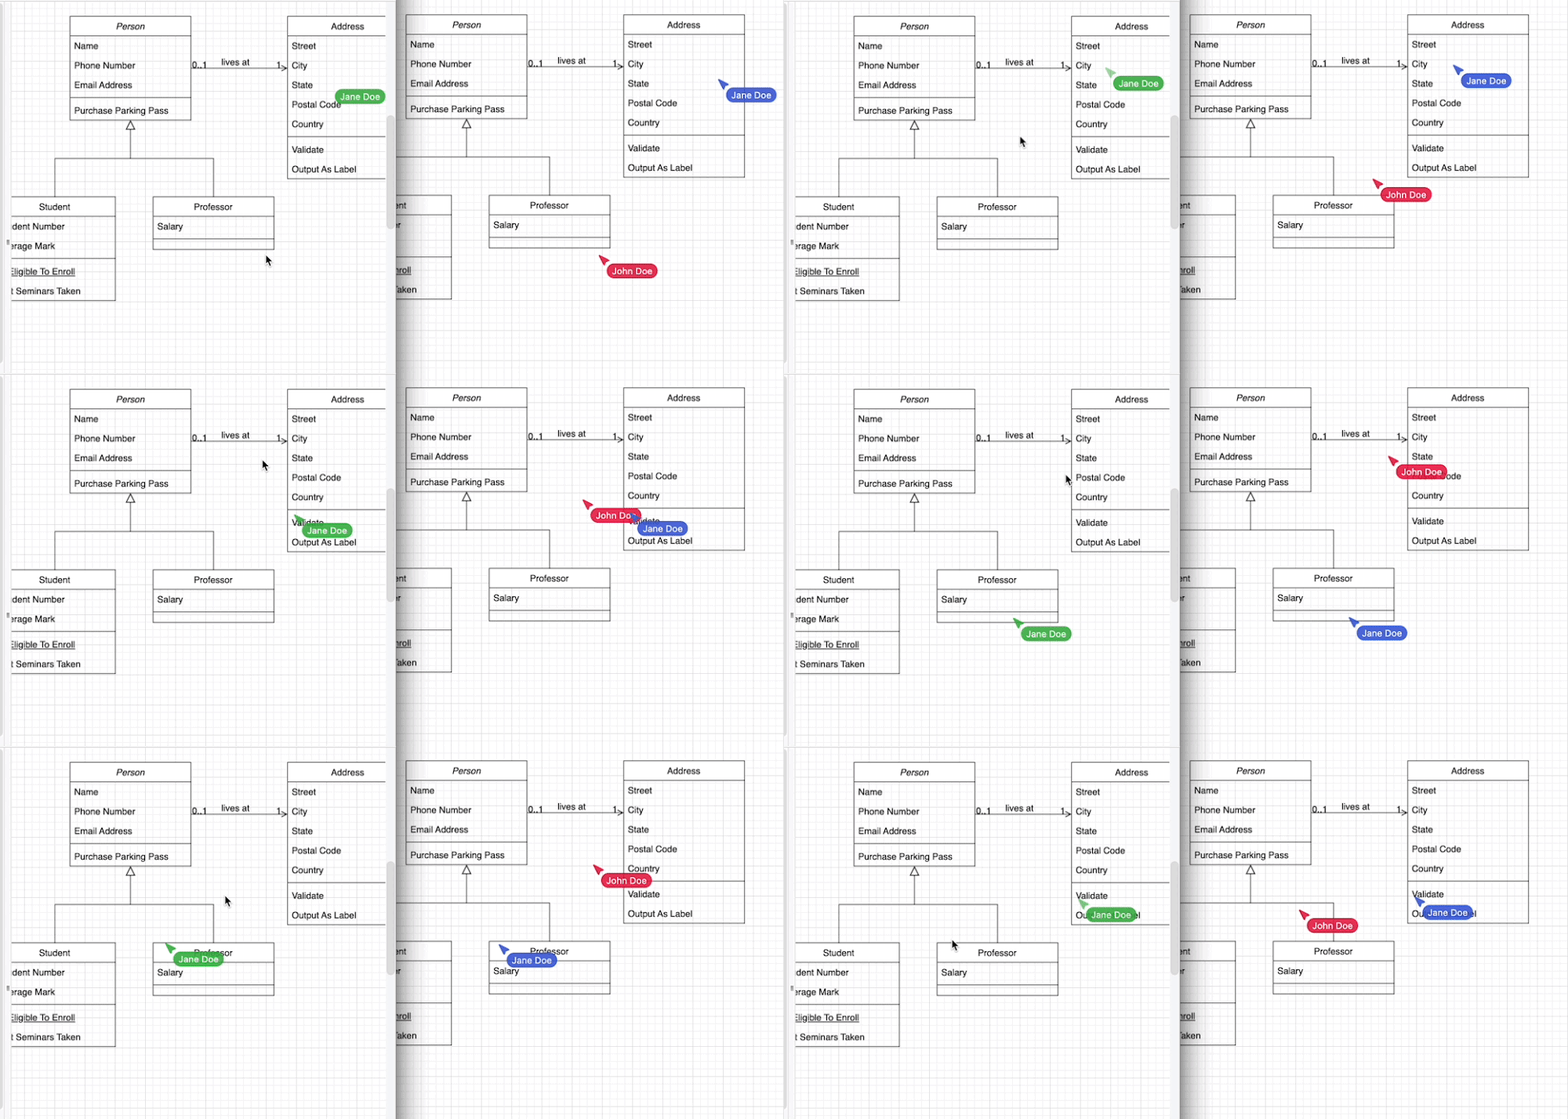
Each person who is editing a draw.io diagram in Confluence is assigned a colour. Cursors are shared by default - you'll see everyone's name with their mouse pointer as they move around and edit the diagram.
Share your mouse cursor with others who are editing the same draw.io diagram in Confluence Cloud

Additionally, when you select a shape everyone else will see it highlighted in your colour.

Don't lose diagram data - use draw.io

More importantly than seeing a mouse cursor in real time, you don't want to lose any changes as you collaboratively edit a diagram.

That's why draw.io merges and synchronises the changes while you are editing. You don't even have to publish the diagram to Confluence to see everyone's changes in the editor - draw.io saves and synchronises automatically.
When multiple people edit draw.io diagrams in Confluence, share cursors to see their mouse movements and selection. As changes as they are made, they are saved and synchronised to your editor.
Recorded using two different devices, both editing the same draw.io diagram file in Confluence Cloud. Changes are constantly merged and the draw.io diagram is updated in the editor in real time.

Now, let's contrast the collaborative editing process in draw.io the animation above with editing a diagram in Gliffy.

Gliffy vs draw.io - when a team edits a diagram

The following example shows that you can't see the changes made by others while editing the same Gliffy diagram in Confluence, and that Gliffy follows a last-write-wins approach.

1: Person A adds a shape and publishes the edited Gliffy diagram, then returns to Confluence to view it.
2: Person B was already editing the Gliffy diagram file, so doesn't see the added shape, or that any changes were made by another person.
3: Person B deletes an existing shape and publishes their version, returning to Confluence to view it.
4: Because Person B's Gliffy diagram was the last to be published, it overwrites and ignores the changes made by Person A.

Recorded using two browser windows, both editing the same Gliffy diagram file in a Confluence Cloud instance

Person A must now manually refresh their browser tab to see the updated Gliffy diagram. Only then will they see that their changes have been overwritten by Person B.

Person B remains unaware that another person had edited the Gliffy diagram.

Use draw.io to avoid this problem - share your cursor and let others see you collaboratively edit a diagram in Confluence.

Updated shapes for GCP and AWS network diagrams

· 4 min read

You can create network diagrams from scratch in draw.io using shapes that match the platform you are using - AWS, GCP, Veeam, Azure, Cisco, IBM and many more. Both the draw.io AWS19 and GCP Icon shape libraries for network and cloud architectures have been updated recently.

Open the updated network shape libraries

Both the Amazon Web Service and Google Cloud Platform shape libraries have been updated recently. Enable the shape libraries that you need to use in draw.io.

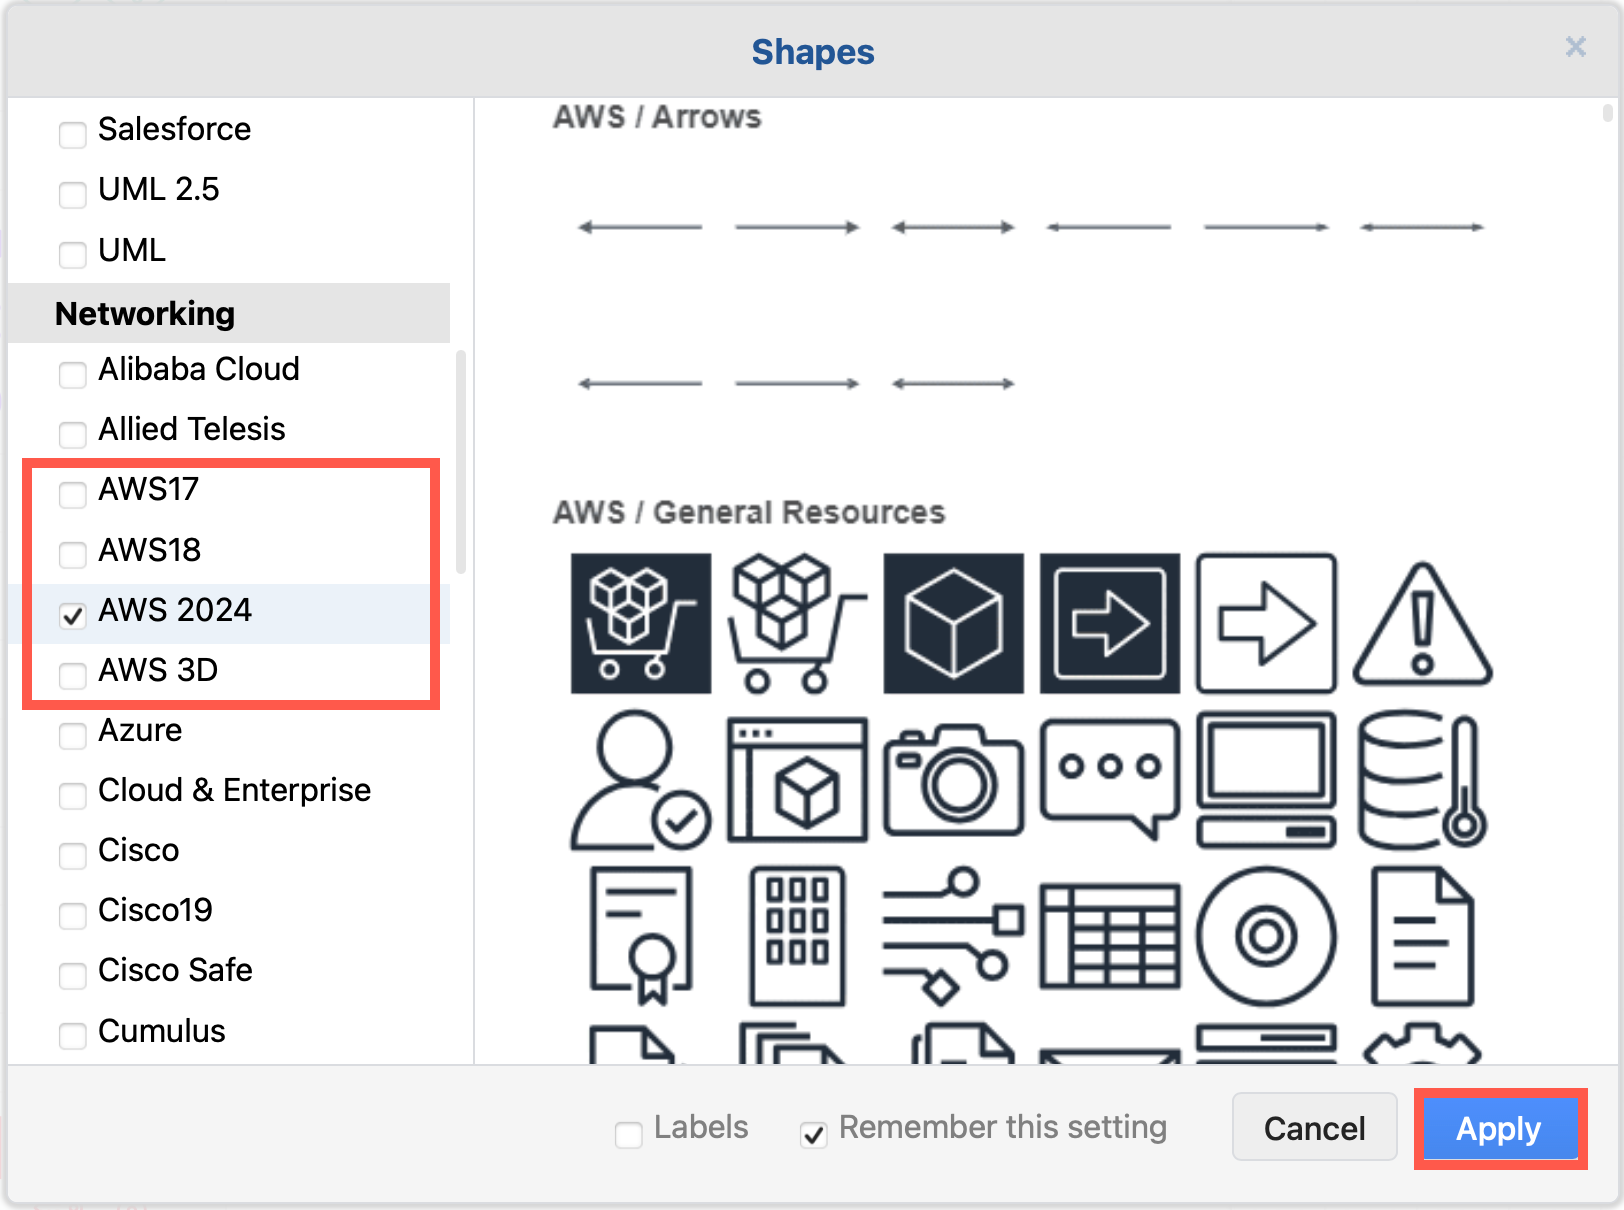
  1. Click on More Shapes in the left-hand panel.
  2. In the Networking section, click on the checkboxes next to the libraries you want to enable, then click Apply.
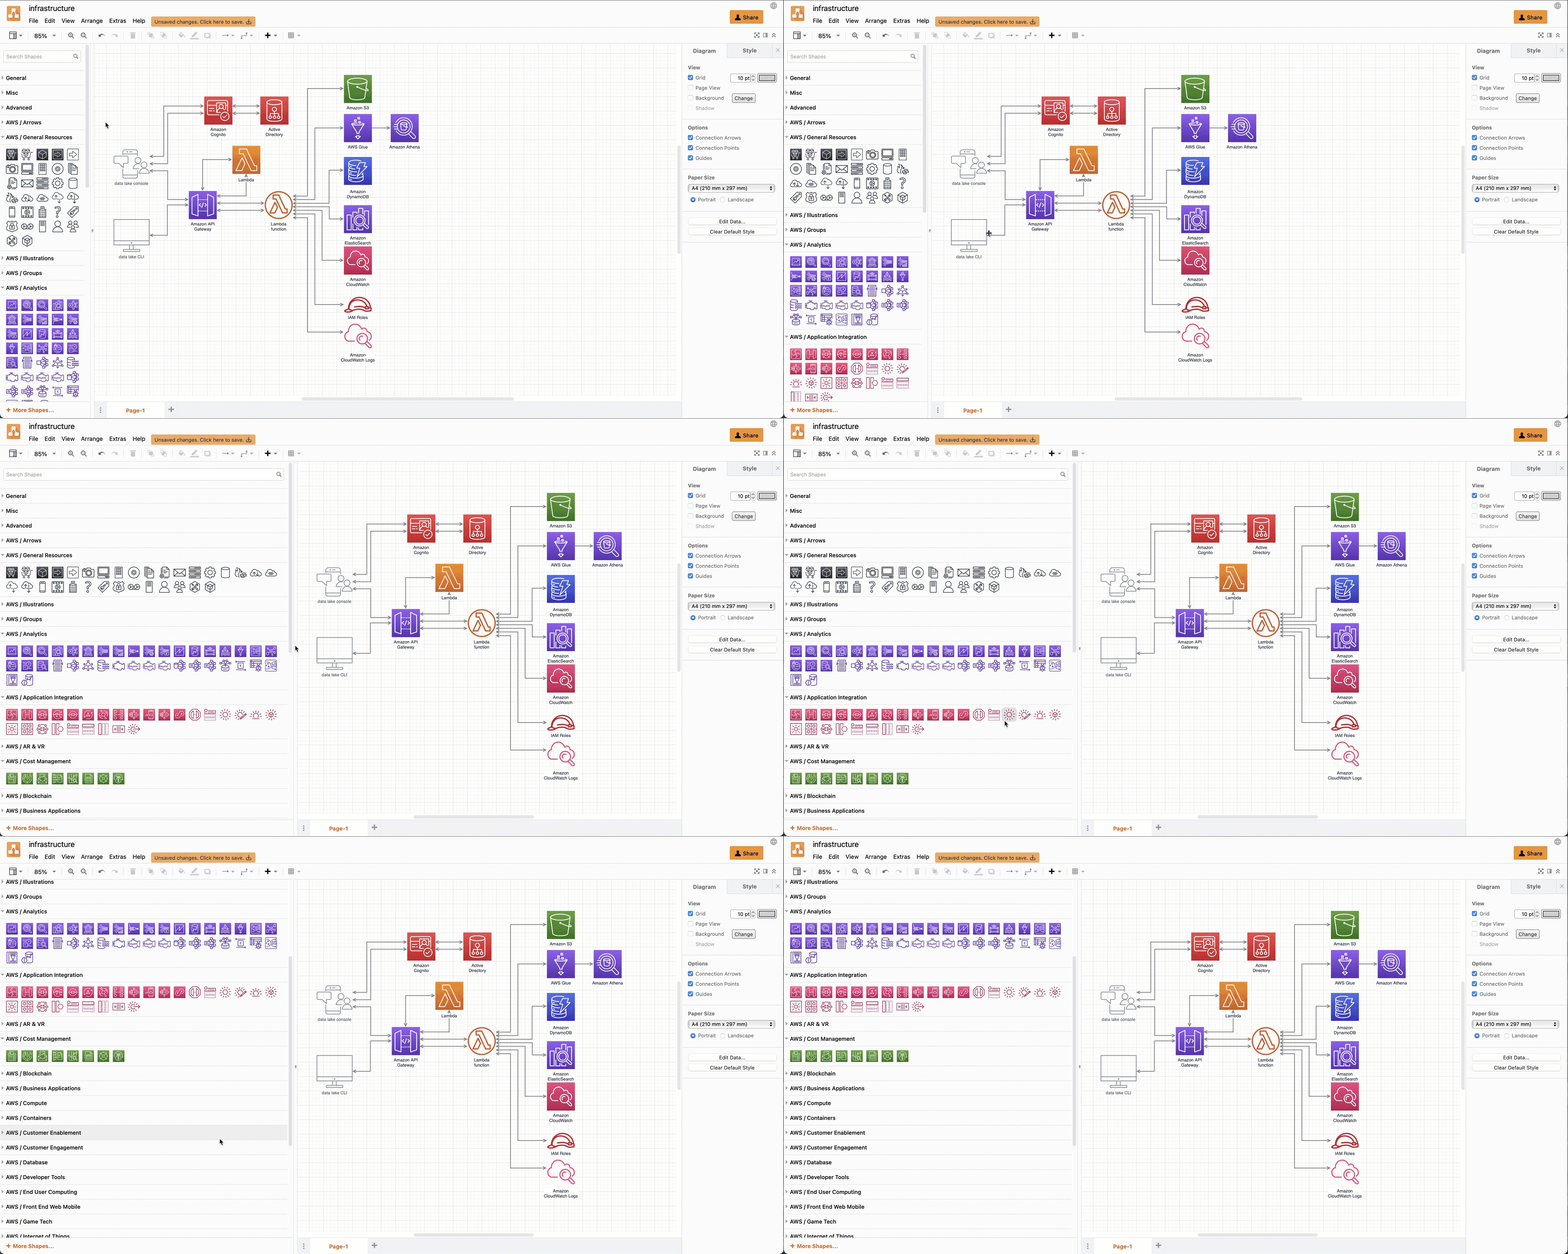
    Enable the AWS19 shape library for Amazon Web Services infrastructure diagrams in draw.io

If you want to see the shape names even when you aren't hovering over a shape in the shape libraries, click on the Labels checkbox in the shape library selection dialog.

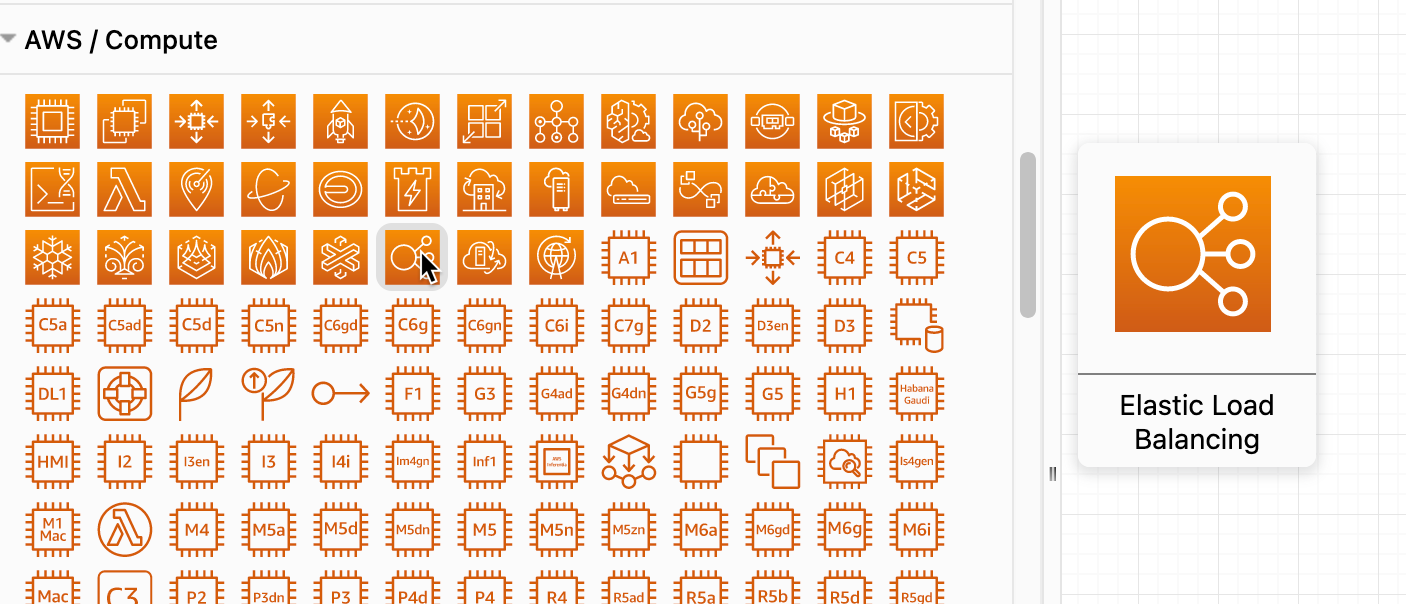
Hover over any shape in the shape libraries on the left of the drawing canvas to see a preview and its name.
Hover over any shape to see a preview and its name in draw.io

Drag the shape library panel edge towards the drawing canvas to expand the panel and see more shapes.
Drag the edge of the shapes panel to make it larger

Updated AWS19 network shapes

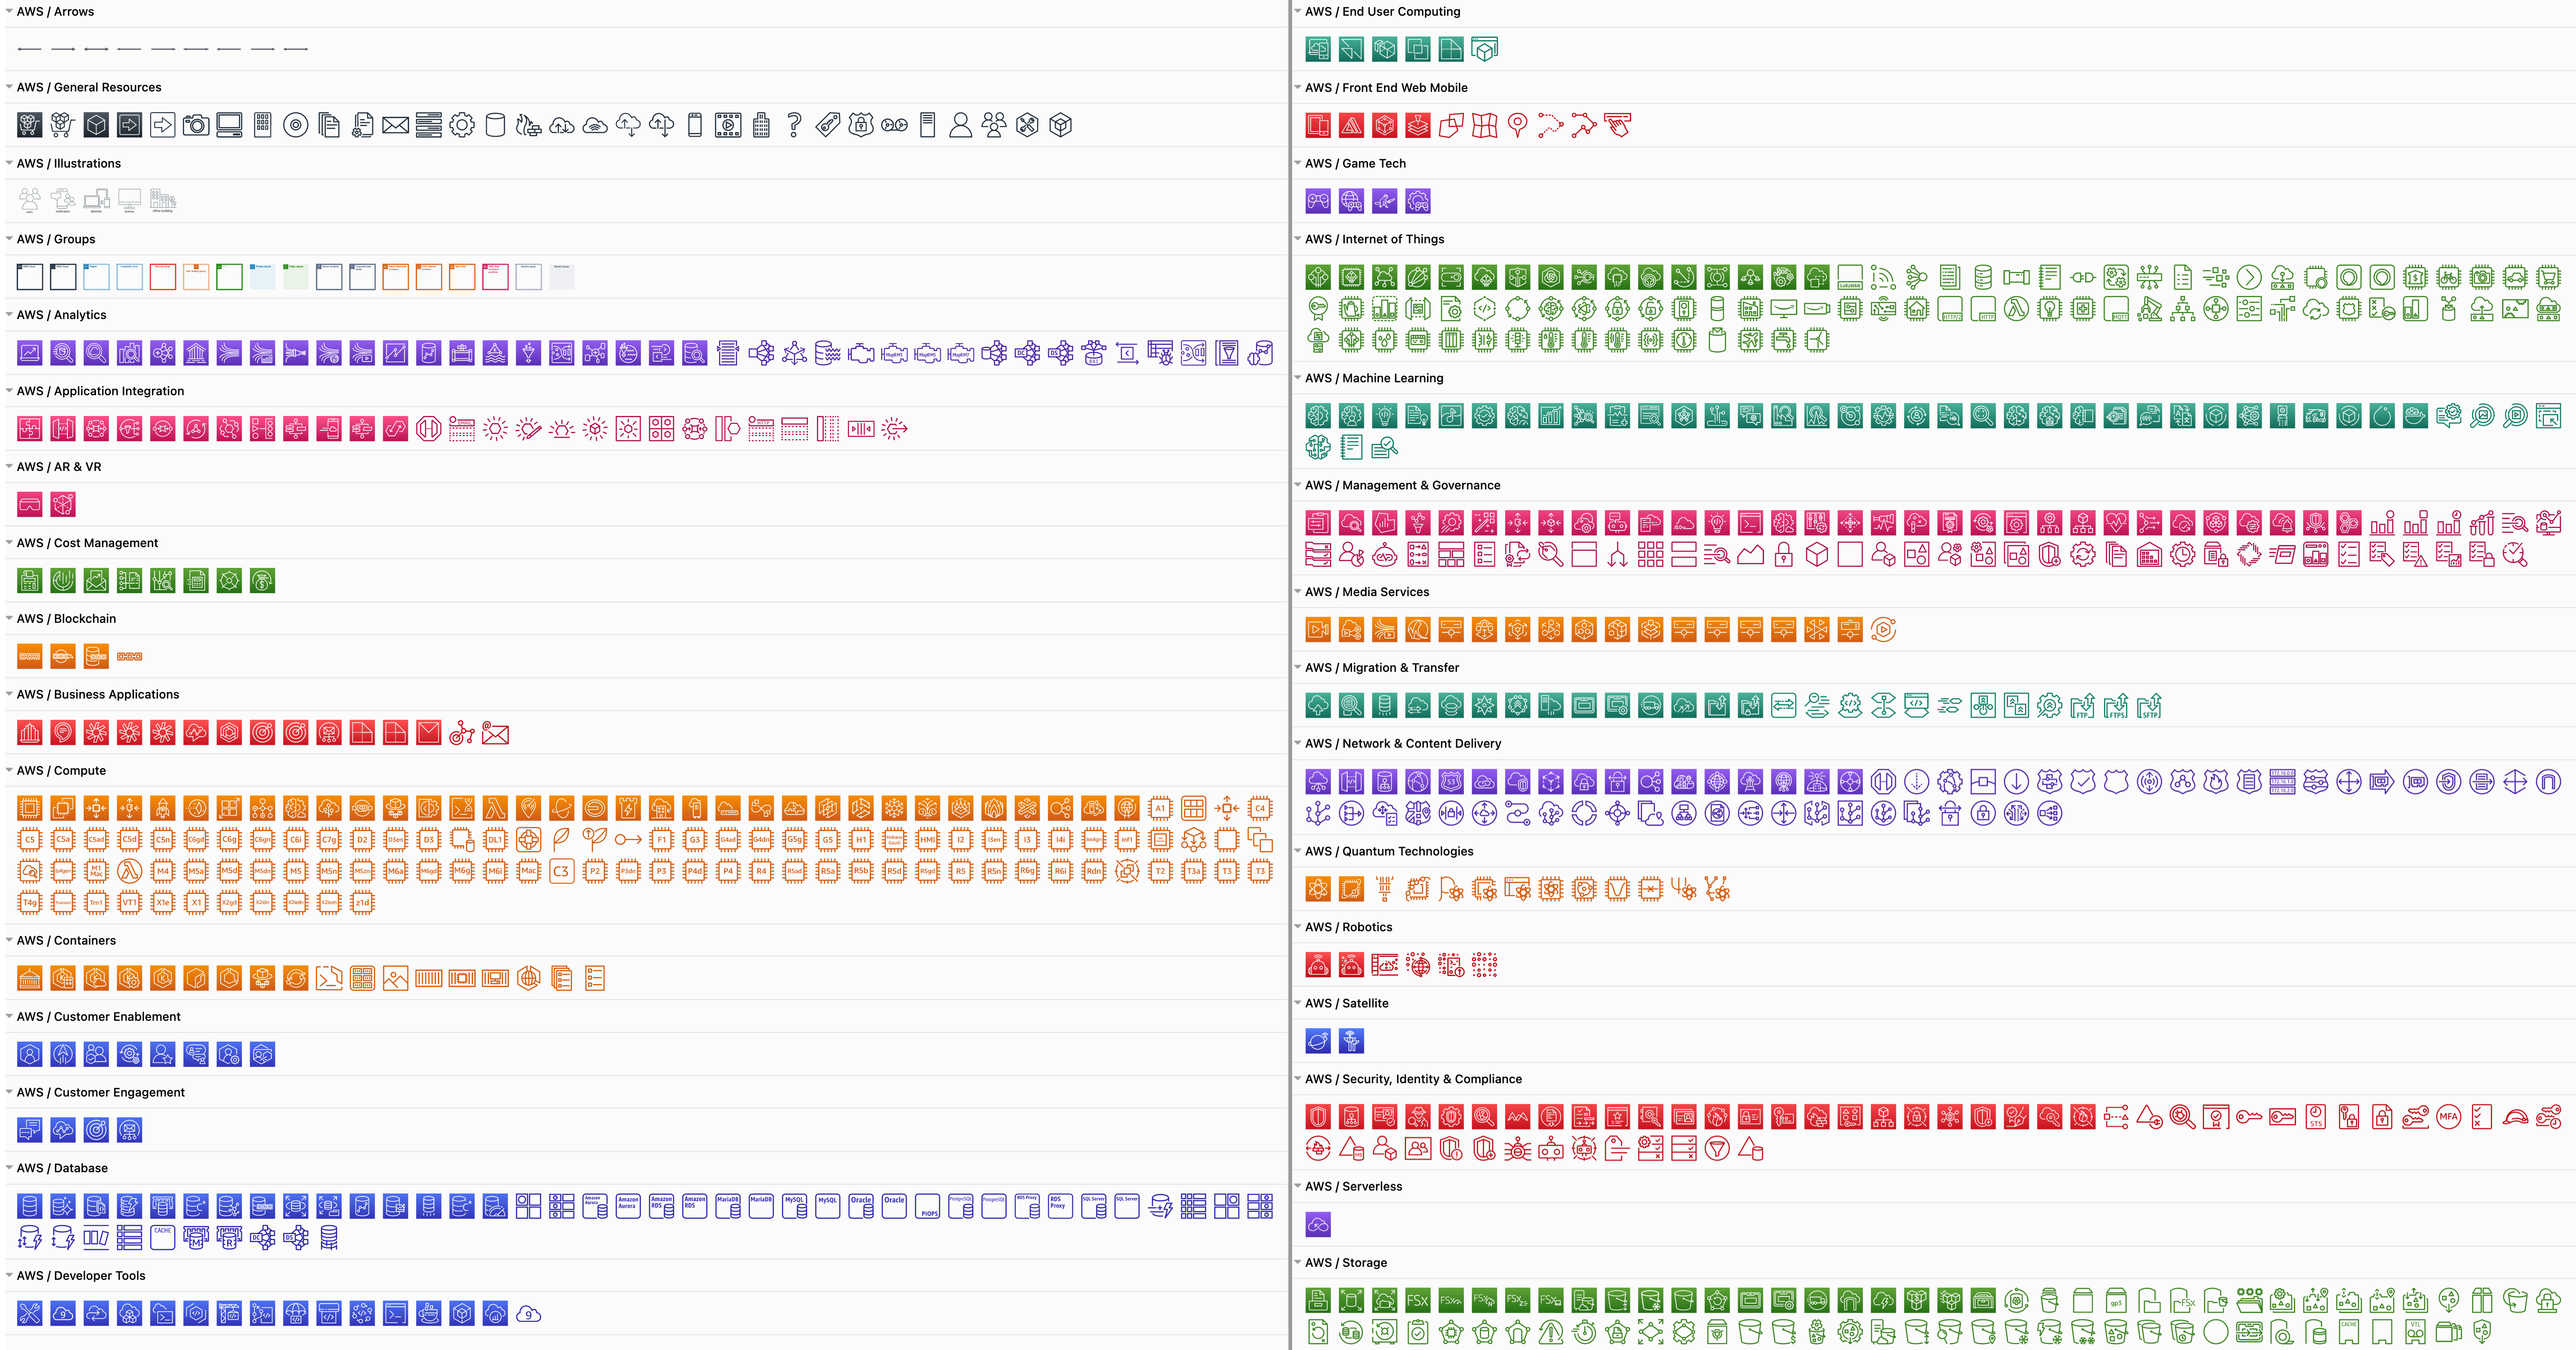
Enabling the AWS19 shape library will give you a large number of sub-libraries in the left panel, sorted into logical categories. Expand the categories that you need by clicking on the sub-library's title or the arrow next to it.

As you can see below, the AWS19 shape library for modelling cloud service architectures on Amazon's platform is large and varied.
The AWS19 shape library for Amazon Web Services infrastructure diagrams has been updated in draw.io

Create a new diagram with the AWS19 shape library already enabled

Updated GCP Icons

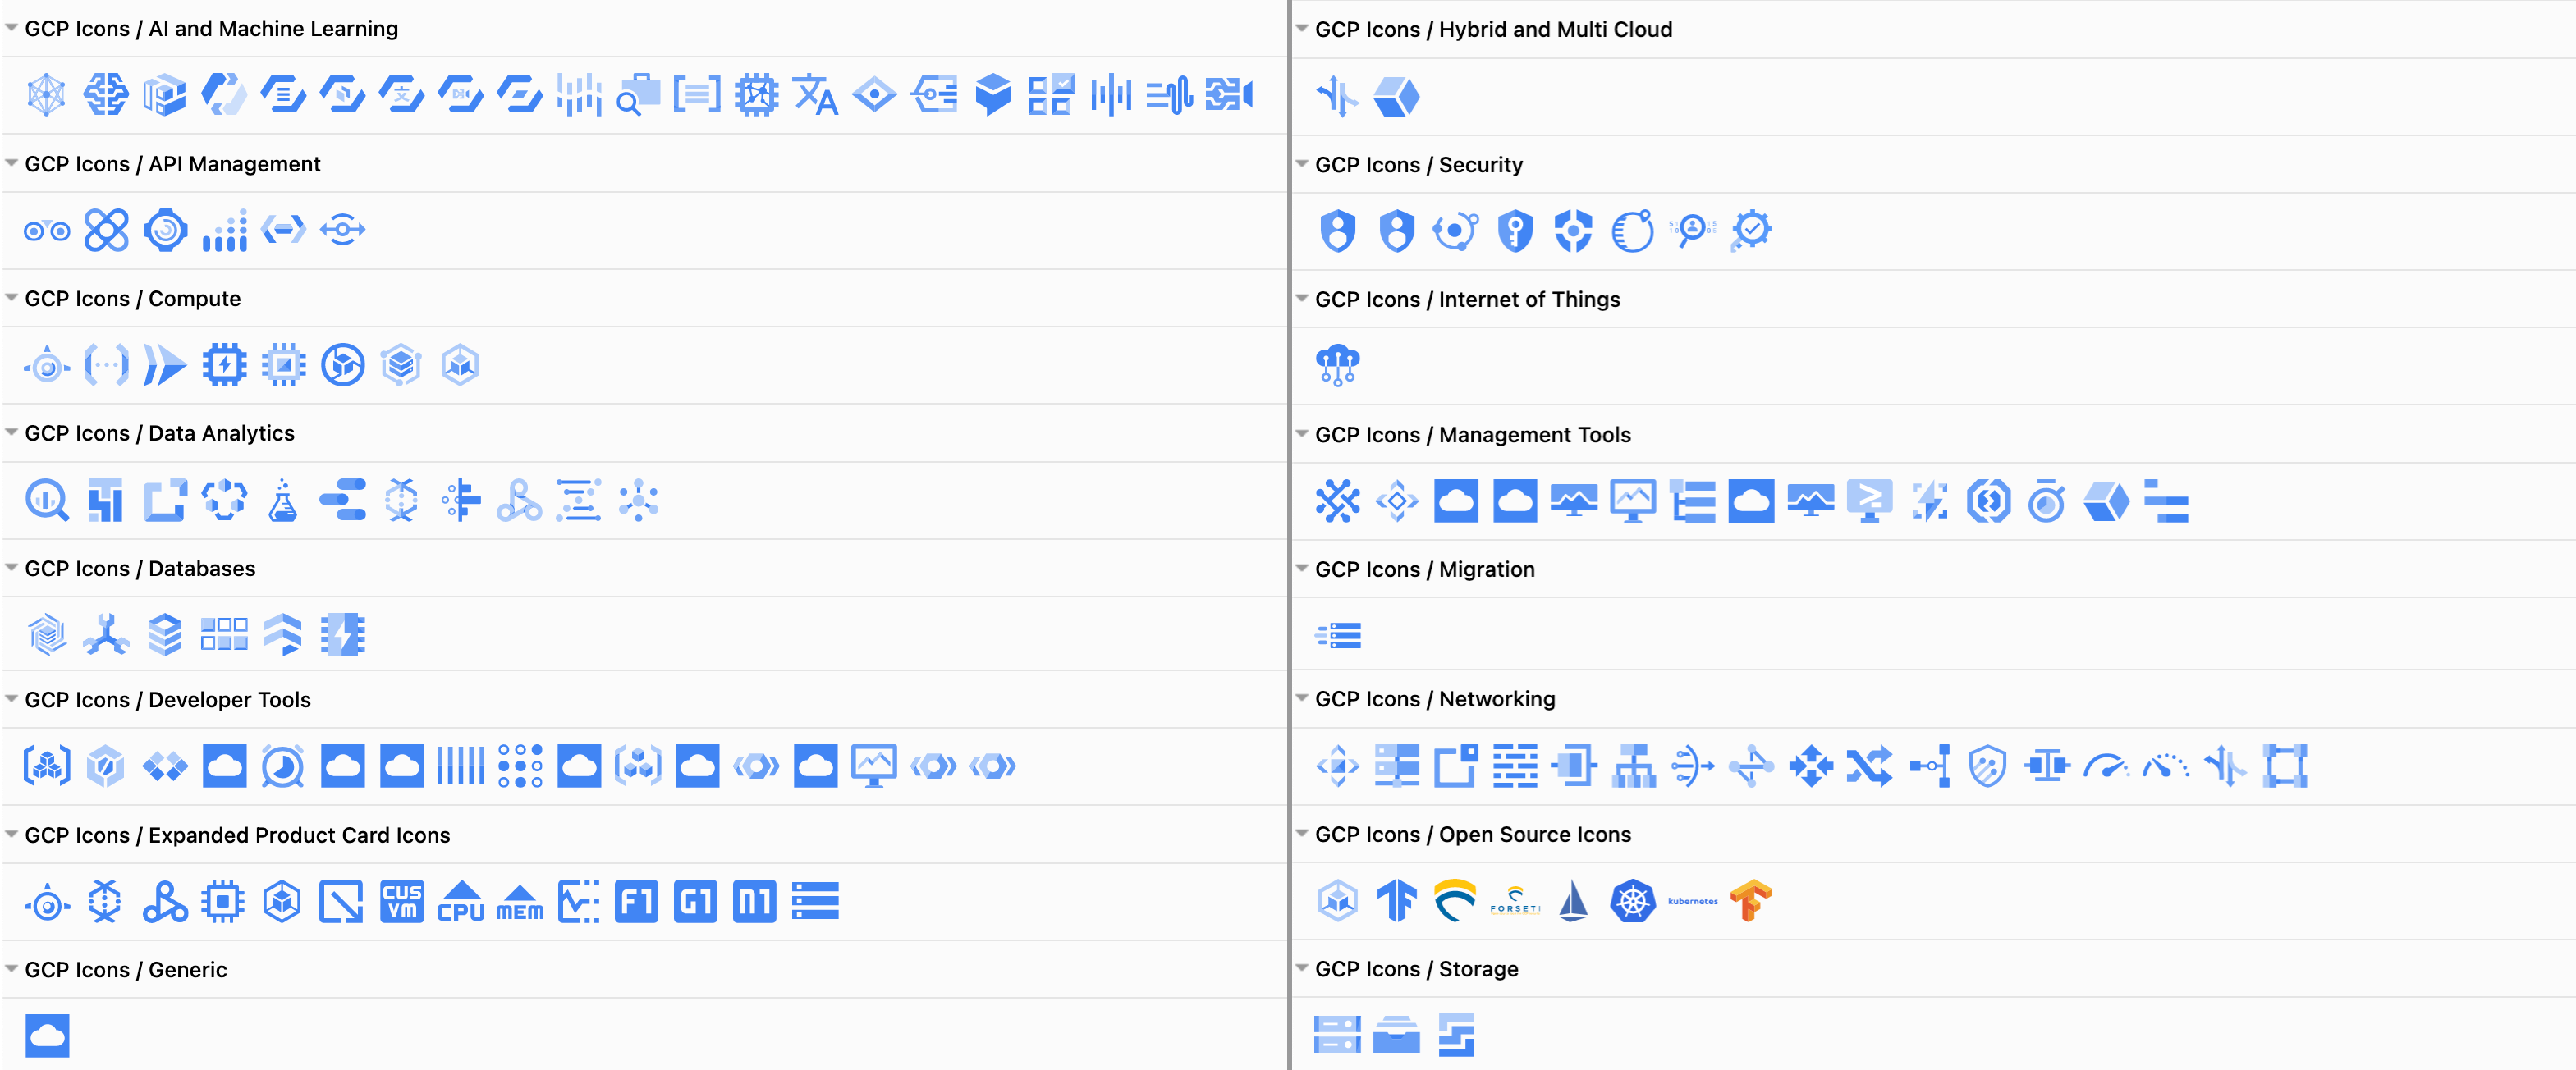
The large Google Cloud Platform shape library containers older labels and icons, whereas the updated GCP Icons are sorted into their own shape library. Click More Shapes and enable the GCP Icons library to see updated sub-libraries shown below.
The GCP icons shape library for Google Cloud Platform infrastructure diagrams has been updated in draw.io

Create a new diagram with the GCP Icons shape library already enabled

Some cloud visualisation platforms can output diagrams in the .drawio format, including Cloudcraft and Cloudockit.

Embed the exported diagram in your system documentation or display it in your wiki with one of our draw.io integrations.

Network diagram templates

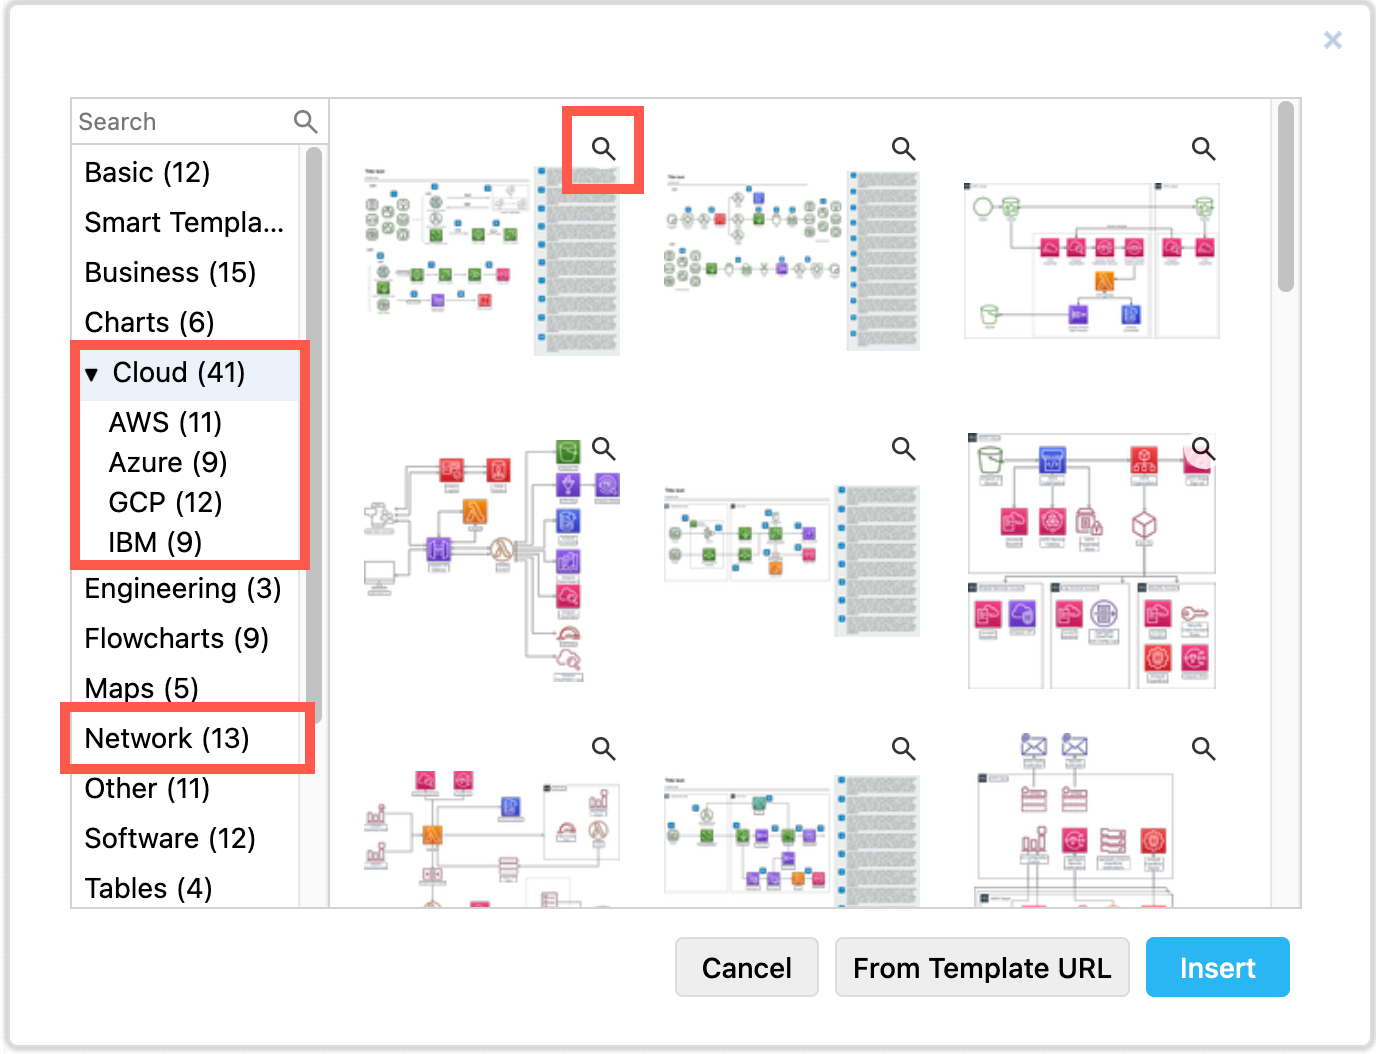
draw.io includes many templates for common cloud infrastructures on several platforms. Select Arrange > Insert > Template from the menu.
Network diagrams in the templates at draw.io

Edit the connection points on a shape

· 4 min read

You can now edit a shape's connection points visually with the new connection point editor. Drag the connection points around the shape, add new connection points, and delete those you don't need.

While you can set custom connection points by entering the coordinates when defining a custom shape, editing the connection points visually is faster and easier.

Right click on a shape and select Edit Connection Points.
Use the context menu to edit the connection points of a selected shape

The shape will be displayed with its connection points shown as blue crosses.

Select a connection point: Click on a connection point, or select multiple connection points by dragging a selection box around them.

Move connection points: Drag a connection point to a new position. You can also drag connection points to be inside or far outside the shape's outline.
Move, delete and add connection points to a shape visually in draw.io

Alternatively, you can shift selected connection points to the left/right or up/down by precise percentages or points. Note that you can only shift these in one direction at a time in this way.

  1. Select one or more connection points.
  2. To shift them to the right, enter a value in the Dx % or pt field and press Enter. Use a negative value to shift them to the left.
  3. To shift the selected connection points up, enter a value in the Dy % or pt field and press Enter. Use a negative value to shift them down.
    Shift connection points precisely from their current location

Delete connection points: Select one or more connection points, then press Delete or click on the Delete icon just under the editor on the right.
Delete connection points on a shape in the visual editor with draw.io

Add new connection points: Double click anywhere on or around the shape to add a new connection point.

Alternatively, make sure no connection points are selected, then click Add.
Specify how many connection points to add, and which edge to add them to

  • To add multiple connection points at once, change the number in the text field to the left of the Add button.
  • To change which edge the connection points are added to, select another value from the drop down list.

Zoom in and out: To zoom in and out, click on the magnifying glass icons, or on the Actual Size and Fit icons directly under the editor on the left.
Zoom in and out to see the connection points more clearly

Define connection points on custom shapes

You can also add and edit connection points on complex custom shapes using the same steps as above. For example:
Edit the connection points visually, even on a custom shape with draw.io

Note: If you don't see connection points when you hover over a custom shape, check the Connection Points option in the Arrange tab of the format panel is enabled.

Reporting issues, suggesting features and upvoting

· 6 min read

We've recently implemented a number of features, most popularly requested via our drawio Github repository. To reach support at draw.io for diagrams.net and our draw.io apps, please read and follow the instructions on our support page.

Skip to the end of this post to see how to upvote existing issues and feature requests.

Tip: To use the updated features in our online editor, clear the draw.io cache in your browser (clear.diagrams.net), then reload the draw.io editor.

Crop images in the diagram editor

You can now crop images in the draw.io editor. This works on both images imported into the editor from your device, as well as images embedded from a URL.

  1. Right click on an image and select Crop.
  2. Resize the crop using the grab handles and drag the crop box to reposition it.
    • Click on Ellipse to use a circular or ellipse-shaped crop.
    • Click on Rounded to round the corners on the rectangular crop.
  3. Click on Apply
Crop an embedded or imported image in draw.io

This is a non-destructive crop. To reset the crop to the original image, click on Reset in the crop image dialog.

Merge and unmerge table cells in the Sketch editor theme

Merge and unmerge table cells using the Table tool on the toolbar in the Sketch editor theme - our uncluttered online whiteboard theme.

These options only appear when you have selected multiple table cells or a previously merged table cell.

Merge two or more table cells

  1. Select two or more adjacent table cells (hold down Shift and click on multiple cells).
  2. Click on the Table tool in the toolbar and select Merge. Alternatively, click on Merge in the Arrange tab of the format panel.
    Merge table cells in the Sketch whiteboard-like editor theme in draw.io

Unmerge merged table cells

  1. Select the merged cells in the table.
  2. Click on the Table tool in the toolbar on the left and select Unmerge.
    Unmerge table cells in the Sketch whiteboard-like editor theme draw.io

In all of the editor themes, you can also unmerge merged table cells via the Arrange tab of the format panel.
Unmerge table cells in the draw.io editor via the Arrange tab in the format panel

SVG export options for formatted text

Previously, draw.io exported shapes and labels with HTML formatted text embedded as a foreign object in the SVG. This displays fine in browsers, but a number of users had issues with exporting and editing in SVG editors, which wasn't a use case we had considered.

Now, you can choose how formatted labels should be exported, and whether the SVG file it should contain a warning about the text not being SVG.

For example, in the following diagram, some of the shapes have bold and italic words in the label text - they use formatted text.
You can use different formatting options inside a text label - on part of the label only

When you export this diagram as a SVG (File > Export as > SVG), you can now choose the Text Settings.

  • No Change includes the warning embedded in the raw SVG data (default).
  • Embed Fonts includes the fonts in the exported SVG file in case the viewer doesn't have the font installed.
  • Convert Labels to SVG transmits the diagram to our servers, generates a PDF, then pipes that through Inkscape, and returns the SVG output.
    Choose how to export formatted text labels when exporting to a SVG file

Note with this last option:

  • You transmit the diagram to our servers. Diagram data is not stored after this PDF/SVG conversion has finished and the SVG output is returned.
  • The text is converted to a path. Screen readers can't read it and you can't select it.
  • The file size will be larger.

To report a bug or request a feature

If you are using our draw.io apps in Atlassian Confluence or Jira, please contact your instance administrator for details of your support entitlement.

For our online diagram editor and any of the draw.io integrations that we support via our open source project, follow the steps below.

Go to the Issues tab in our drawio GitHub repository and first search through the list of existing issues to see if your issue or idea has been previously posted.

Upvote an existing issue or feature request

If you find an existing issue related to yours:

  1. Click on the issue title to see the full issue description.
  2. Click on the emoji icon at the bottom of the description, and select the 'thumbs up' icon.
    Register that you also have a reported bug or want the requested feature in our drawio repository on GitHub

This will ensure that the most popular bugs and feature requests get pushed to the top.

Raise a new issue or request

If you have a question, rather than want to report an issue or request a new feature, please look under the Discussions tab in our Github repository.

  1. From the Issues tab in our drawio GitHub repository, click on New issue.
  2. Click on Get started next to either Bug report or Feature request.
  3. Enter a clear and unambiguous title for your bug report or feature request.
  4. Follow the instructions and fill in the Preflight Checklist in the large text field.
  5. Describe your problems or suggested feature in the appropriate sections of the checklist, clearly and in detail.
  6. Click Submit new issue when you have finished.
    Register that you also have a reported bug or want the requested feature in our drawio repository on GitHub

Reviews from real draw.io users

· 3 min read

The barrier to anyone diagramming and whiteboarding with draw.io is lower compared to many other SaaS applications. From reviews and customer feedback, some of the things they like the most include:

  • you don't need to register and it costs nothing
  • you can diagram in all major operating systems
  • there is an offline desktop version
  • you can give your diagram to anyone else and they will be able to load and edit it freely
  • you can store unlimited diagram files wherever you prefer
  • project development is in the open and anyone can take part

But don't take our word for it - here is what draw.io users are actually saying on popular review sites.

On Capterra

Capterra verifies reviewers through LinkedIn and checks their reviews for a range of fraudulent activity and credibility. They are one most popular software review sites for businesses.

draw.io review from real users on Capterra


draw.io review from real users on Capterra


draw.io review from real users on Capterra


draw.io review from real users on Capterra

See more draw.io reviews on Capterra

On GetApp

GetApp has monitored software trends for the past 10+ years, and collates reviews on its site from a number of other trusted platforms.

draw.io review from real users on GetApp


draw.io review from real users on GetApp

See more draw.io reviews on GetApp

On G2

The G2 company gathers user reviews of software products from their own community, and aggregated data collated from various other social and online sources, with more weight given to recent reviews.

draw.io review from real users on G2.com


draw.io review from real users on G2.com

See more draw.io reviews on G2

Thank you to our reviewers

Useful as these reviews are, we don't actively monitor review sites regularly - if you have a suggestion or want to report a bug, please go to the the support page on the Github project. That is best place to get our attention.