Configure draw.io online to disable AI diagrams

· 4 min read

Like many software apps, diagramming tools now have AI-powered features that 'help' you diagram. These can be premium features and may not be easily disabled. With the free online draw.io editor, you have access to the diagram generation features by default. It's easy to disable this in draw.io - configure the editor or use the fully offline draw.io Desktop app.
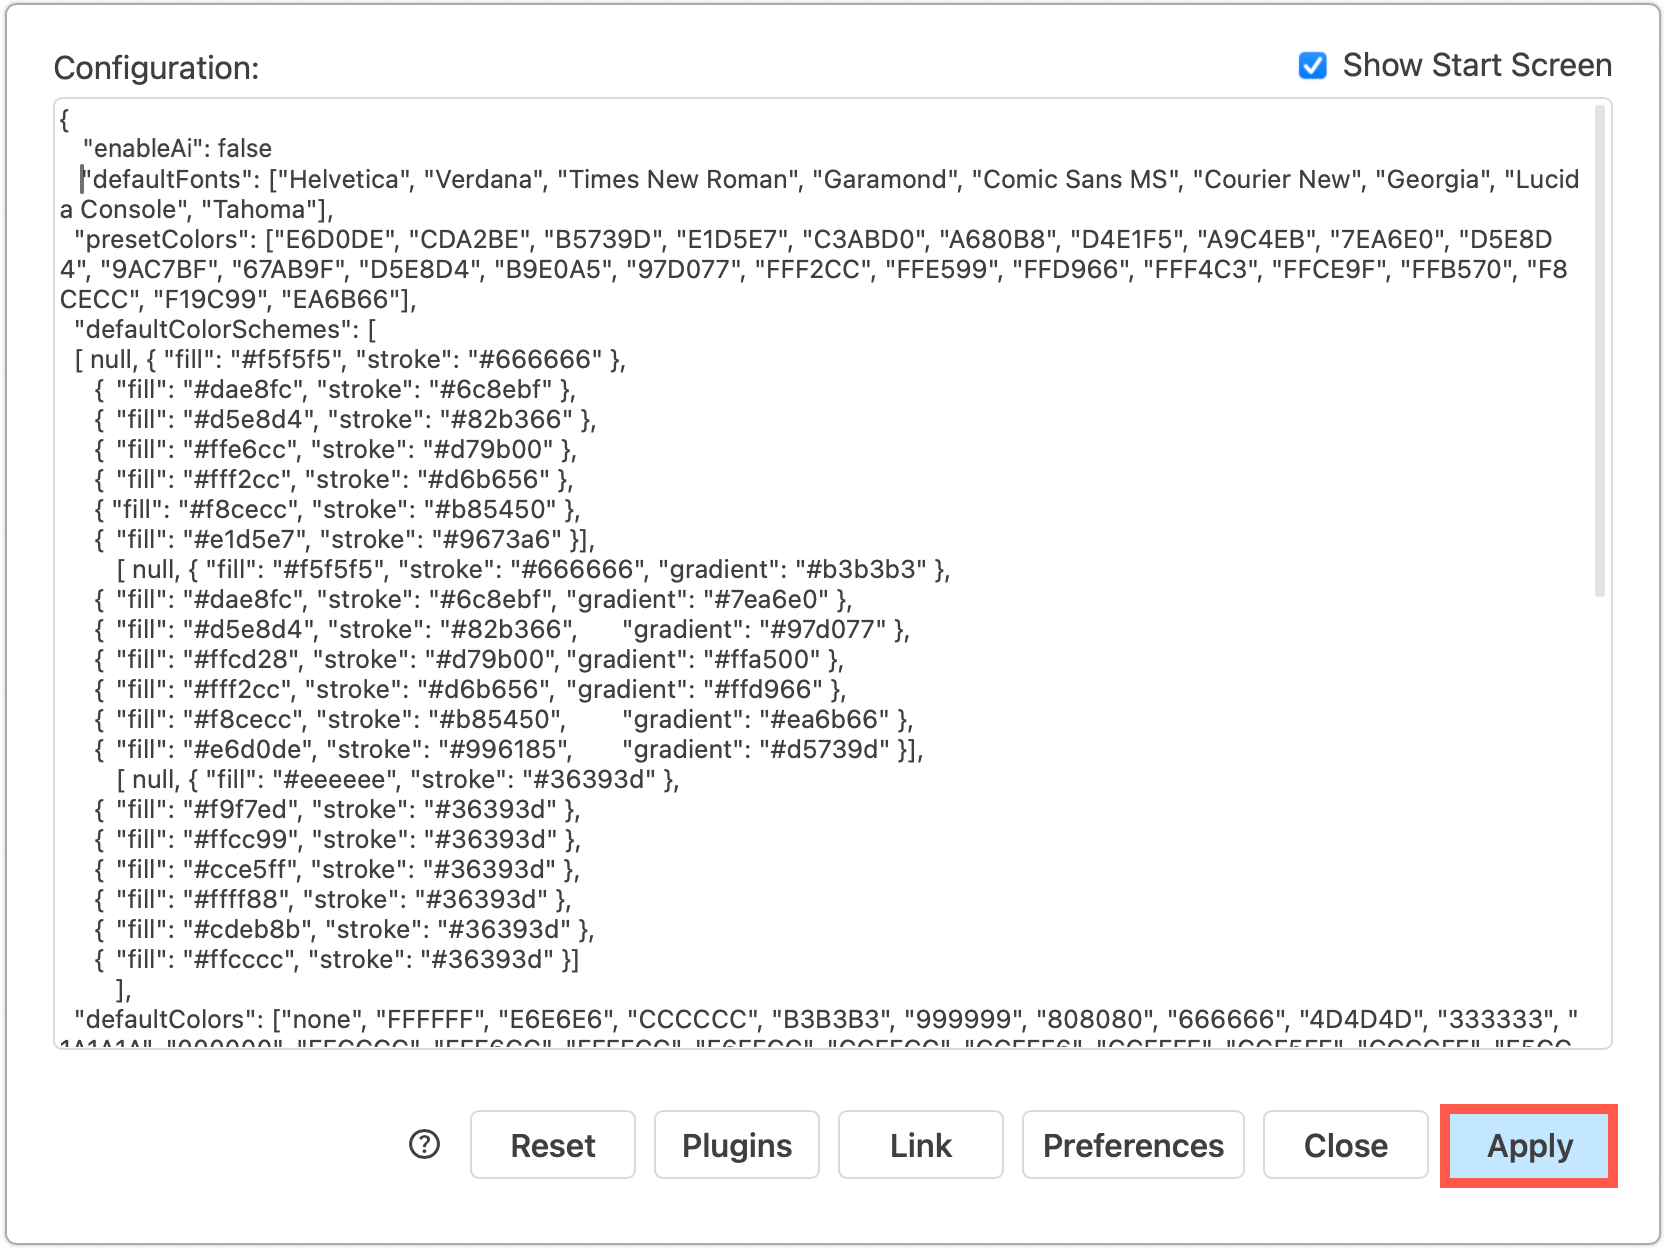
All version of draw.io are highly configurable, with options for custom colours and fonts, and to enable or disable specific features

Note: Diagram generation features are disabled by default in the draw.io apps for Confluence - ask your instance administrator to configure the draw.io editor if you want to (and are allowed to) use this feature.

While draw.io only shares the text you enter as the query to generate a diagram, and only at the time of generation.

draw.io does not share your diagram data with these LLM tools unless you specifically request that the generator modify your diagram or a selection of your diagram (this behaviour can be customised or disabled in the draw.io configuration).

Note, other diagramming applications typically share your diagram data in full and by default with these generation tools, and do not allow you to customise or limit this behaviour.

If you need to include sensitive data or draw confidential diagrams, your diagramming application must not share your diagram data.

Use an offline tool like draw.io Desktop

Since version 10.7.5, draw.io Desktop has been a fully offline application. You do not need a connection to the internet to use all the built-in shape libraries and templates, or use your own custom shape libraries, fonts or templates stored on your device.

Diagram generation features are not available in draw.io Desktop.
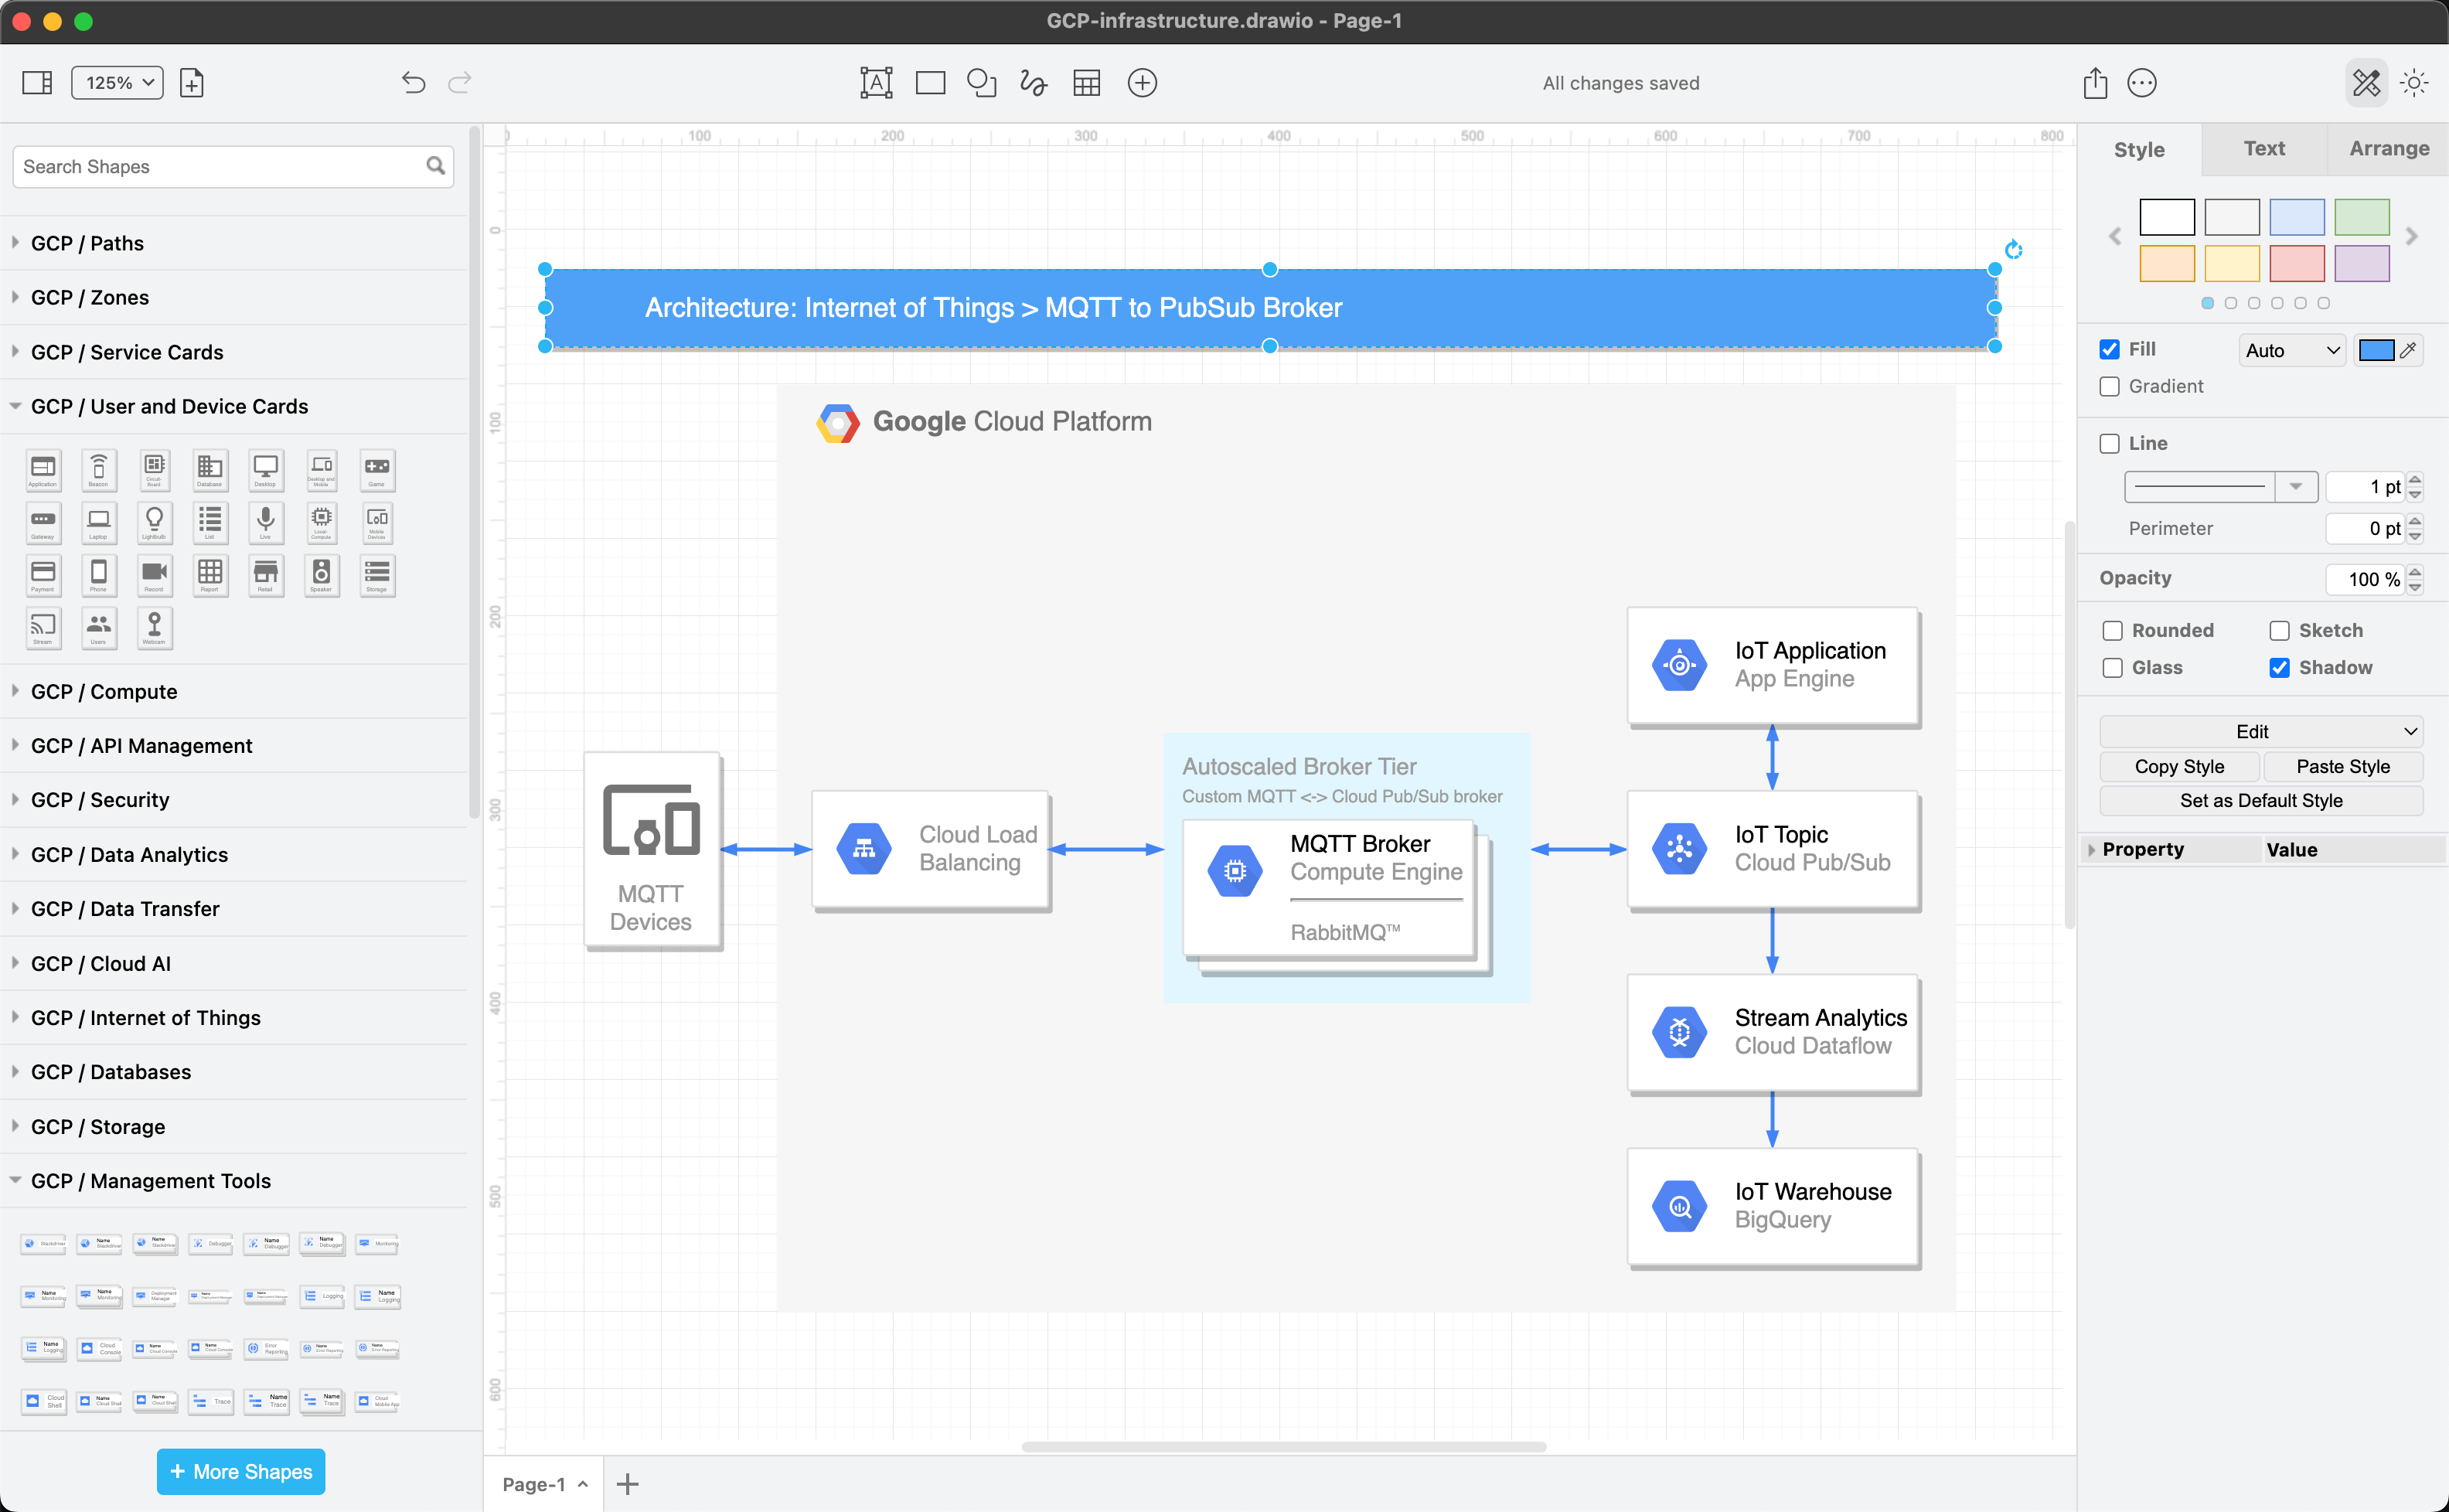
The draw.io desktop app works on MacOS, Windows and Linux

Choose your platform (Windows, macOS or Linux), and download draw.io Desktop to start diagramming securely and privately.

Tip: Many extra template and example diagrams are available in the JGraph/drawio-diagrams repository on GitHub. Download these in advance to use them in draw.io Desktop.

Configure the draw.io web application

Alternatively, you can run the web app while offline as a progressive web app, or configure the editor in your browser to disable the diagram generation features.

All versions of the draw.io application are highly configurable, including but not limited to:

  • default palette colours and styles
  • default and custom fonts
  • custom templates and a customised template library
  • default and custom shape libraries to automatically open by default
  • default page and grid size

Here's a full list of the draw.io editor configuration options for the web application, draw.io Desktop, and the draw.io apps for Confluence Cloud and DC.

Only the online draw.io web application has the diagram generation enabled by default. To disable the diagram generation features, add a line to the editor configuration and refresh the tab to reload the draw.io editor.

Disable diagram generation in the draw.io configuration

This removes the Generate tool from template library and menu, the Generate option from the search field, and the sparkle tool from the toolbar.

Note: Be careful about capitalisation - draw.io configuration options are written using lower camel case (Java).

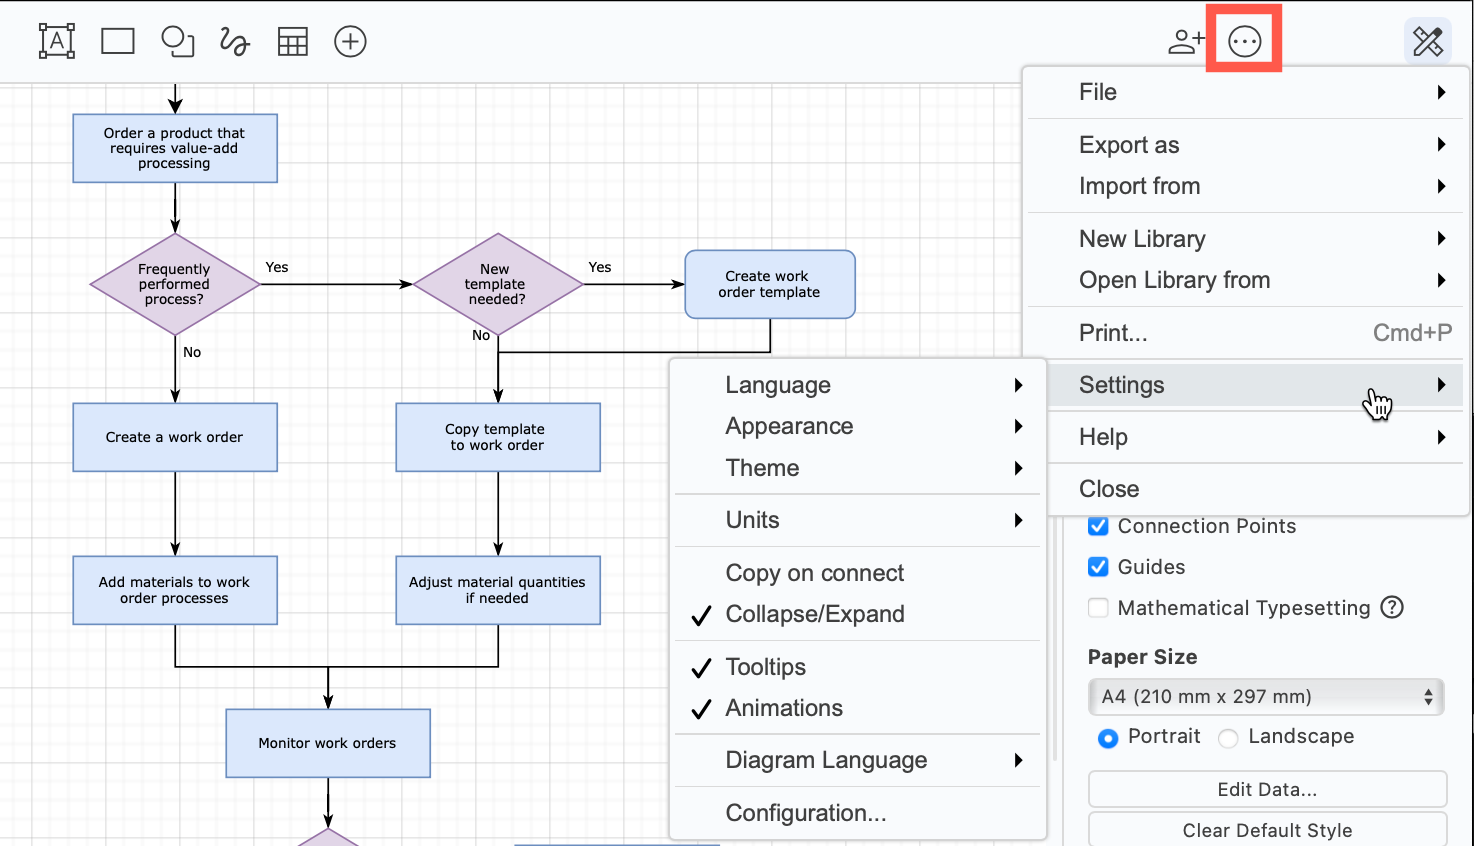
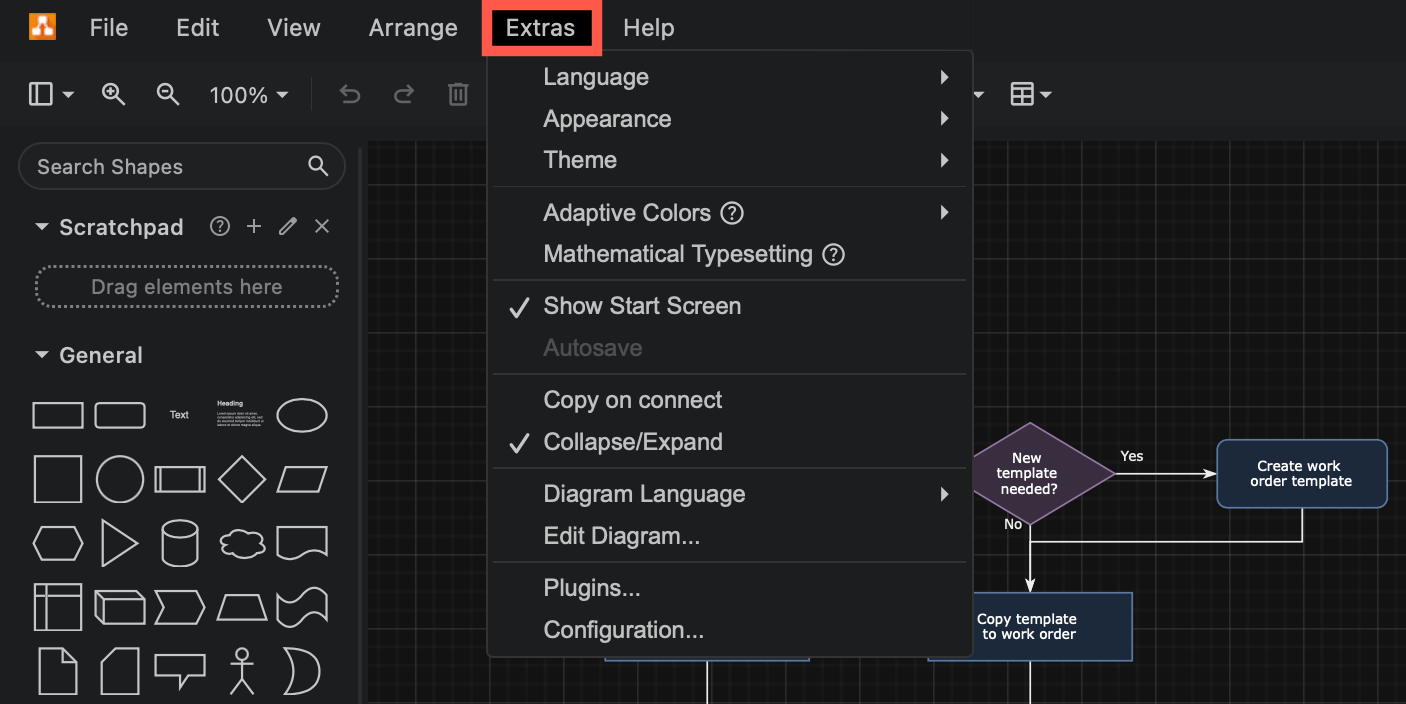
  1. Select Extras > Configuration from the menu, or ... > Settings > Configuration from the toolbar.
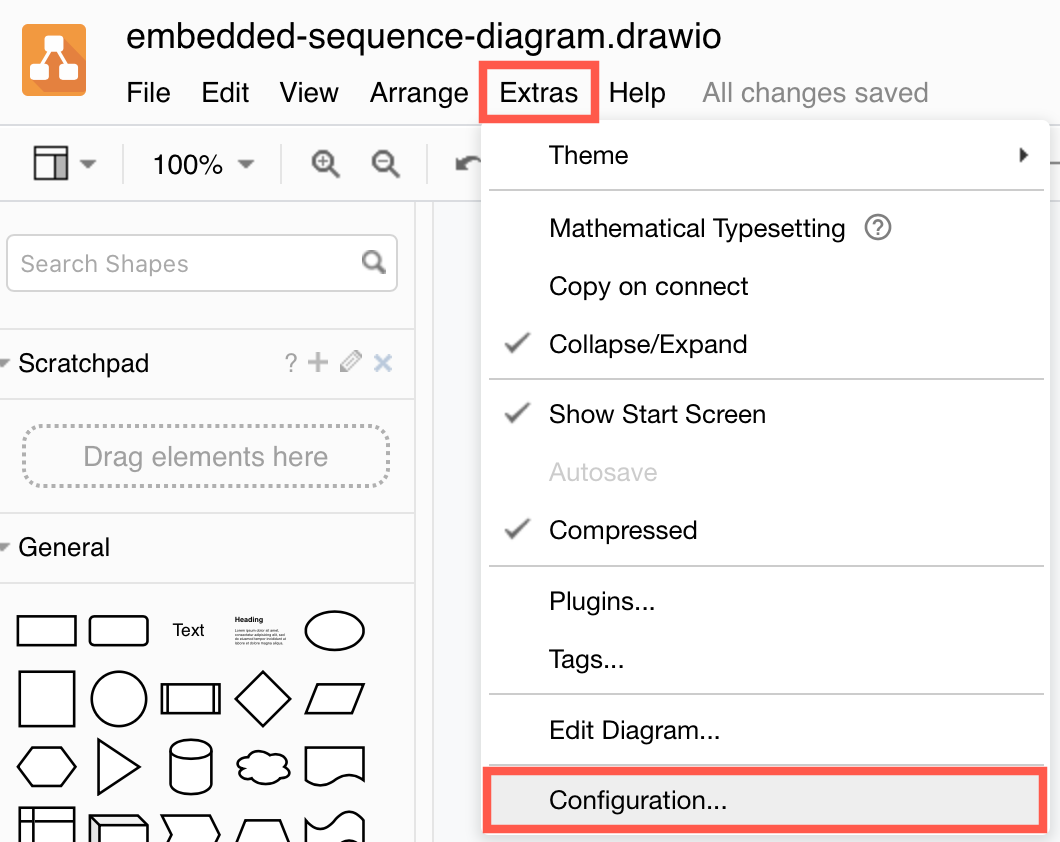
    Access the draw.io configuration via Extras /> Configuration
  2. Add the following JSON string to the configuration: "enableAi": false
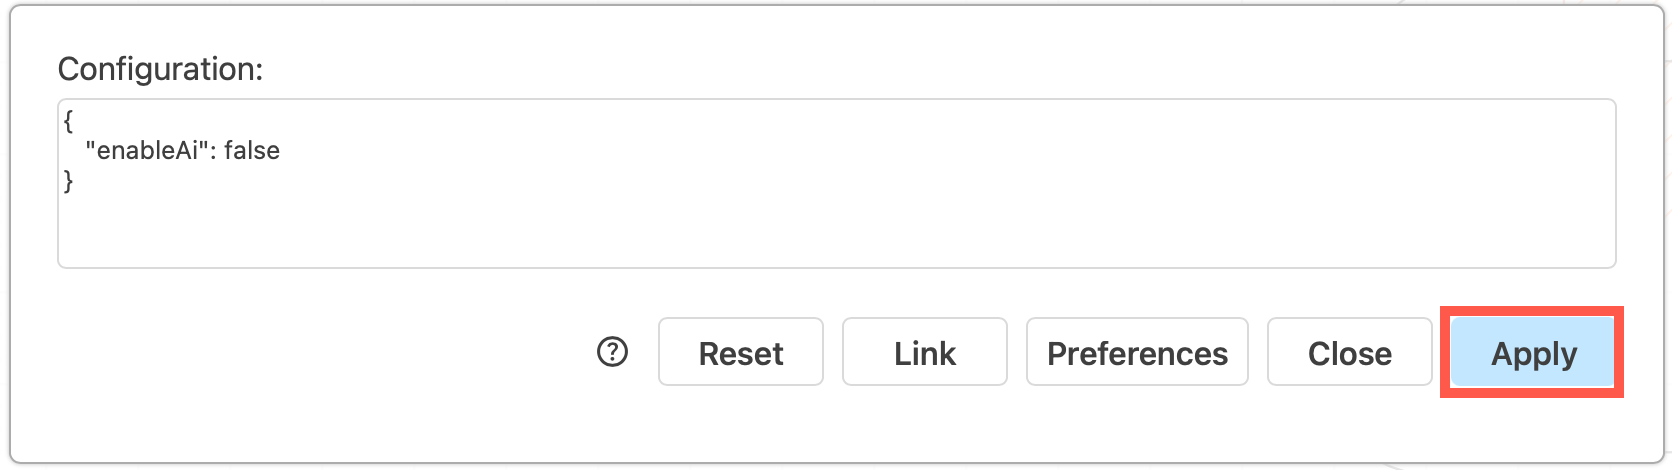
    Set the enableAI option to false in the draw.io configuration to disable the Generate in the template library, the Generate menu and search options, and the sparkle tool
  3. Click Apply to save your changes. Reload the browser tab to load the new draw.io configuration and disable the diagram generation features.

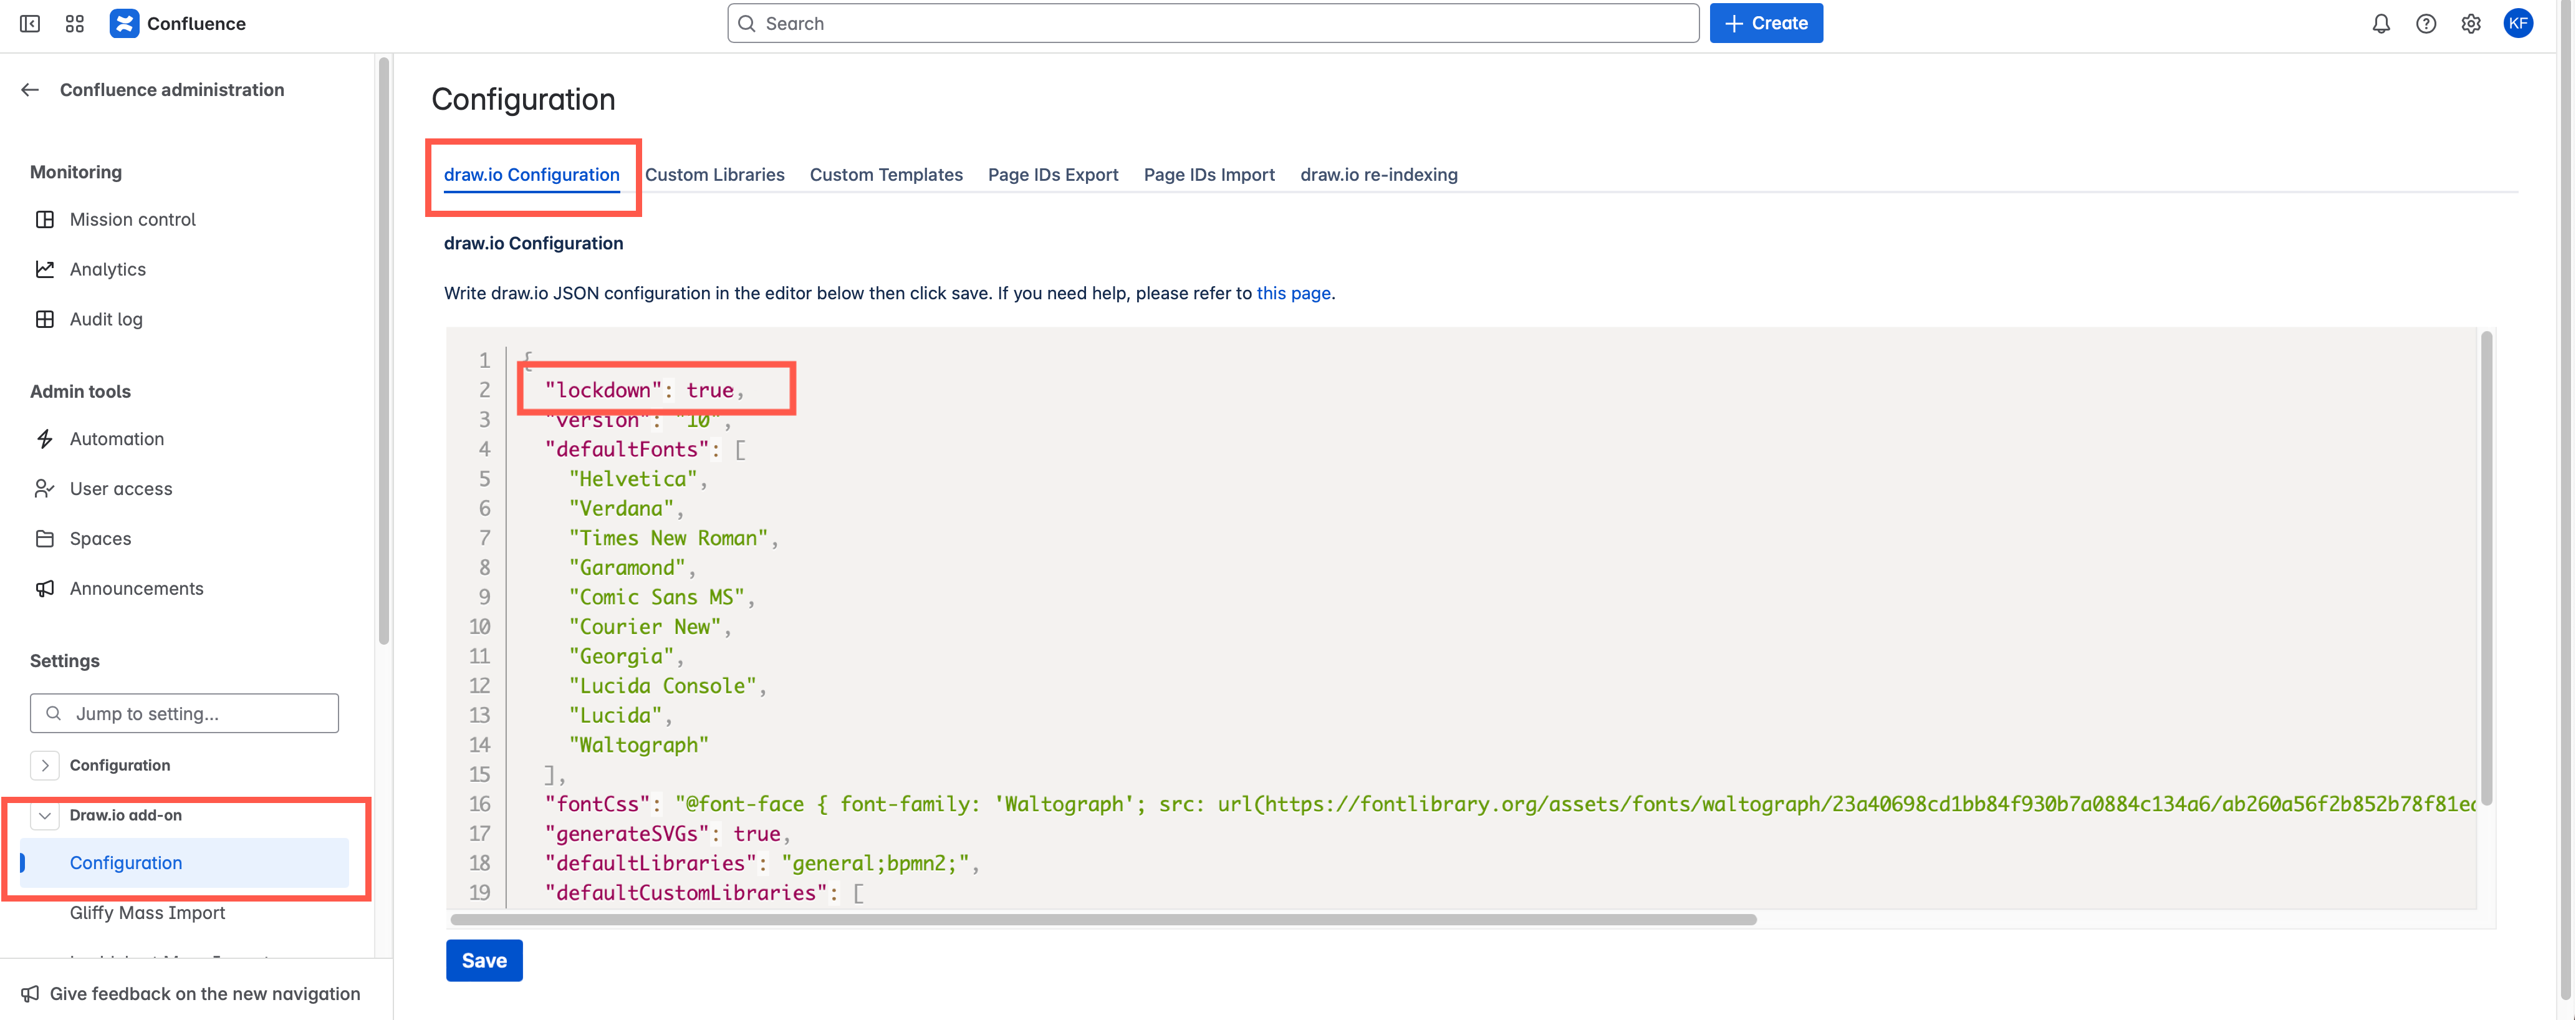
Note: If you set the lockdown option to true in the draw.io configuration, this will also disable the diagram generation features.
Deprecated - draw.io apps for Docs, Sheets and Slides

· 3 min read

Previously, the draw.io apps for Google Docs, Slides and Sheets allowed you to embed the diagrams directly into your documents. Unfortunately, Google has instituted new security permissions limitations that limit access to your files stored on Google Drive. This means that new installations of the draw.io apps for Docs, Slides or Sheets are unable to access the diagram data in those files.

If you have older, installed versions of these apps, you may be able to continue to embed and work with diagram file in your documents.

Important: We have not disabled the Google Store listings for these apps as that would immediately disable all existing installations. Currently, those older installed versions of these apps still work.

We recommend you convert your embedded diagrams to images in those documents.

The draw.io apps for Google Workspace and the draw.io Chrome app for Google Drive are unaffected - you can continue to store your .drawio diagram files in Google Drive and work with them in our free online editor.

It's easy to import images of diagrams in Google Docs

Use draw.io diagrams in Google Docs, Slides and Sheets

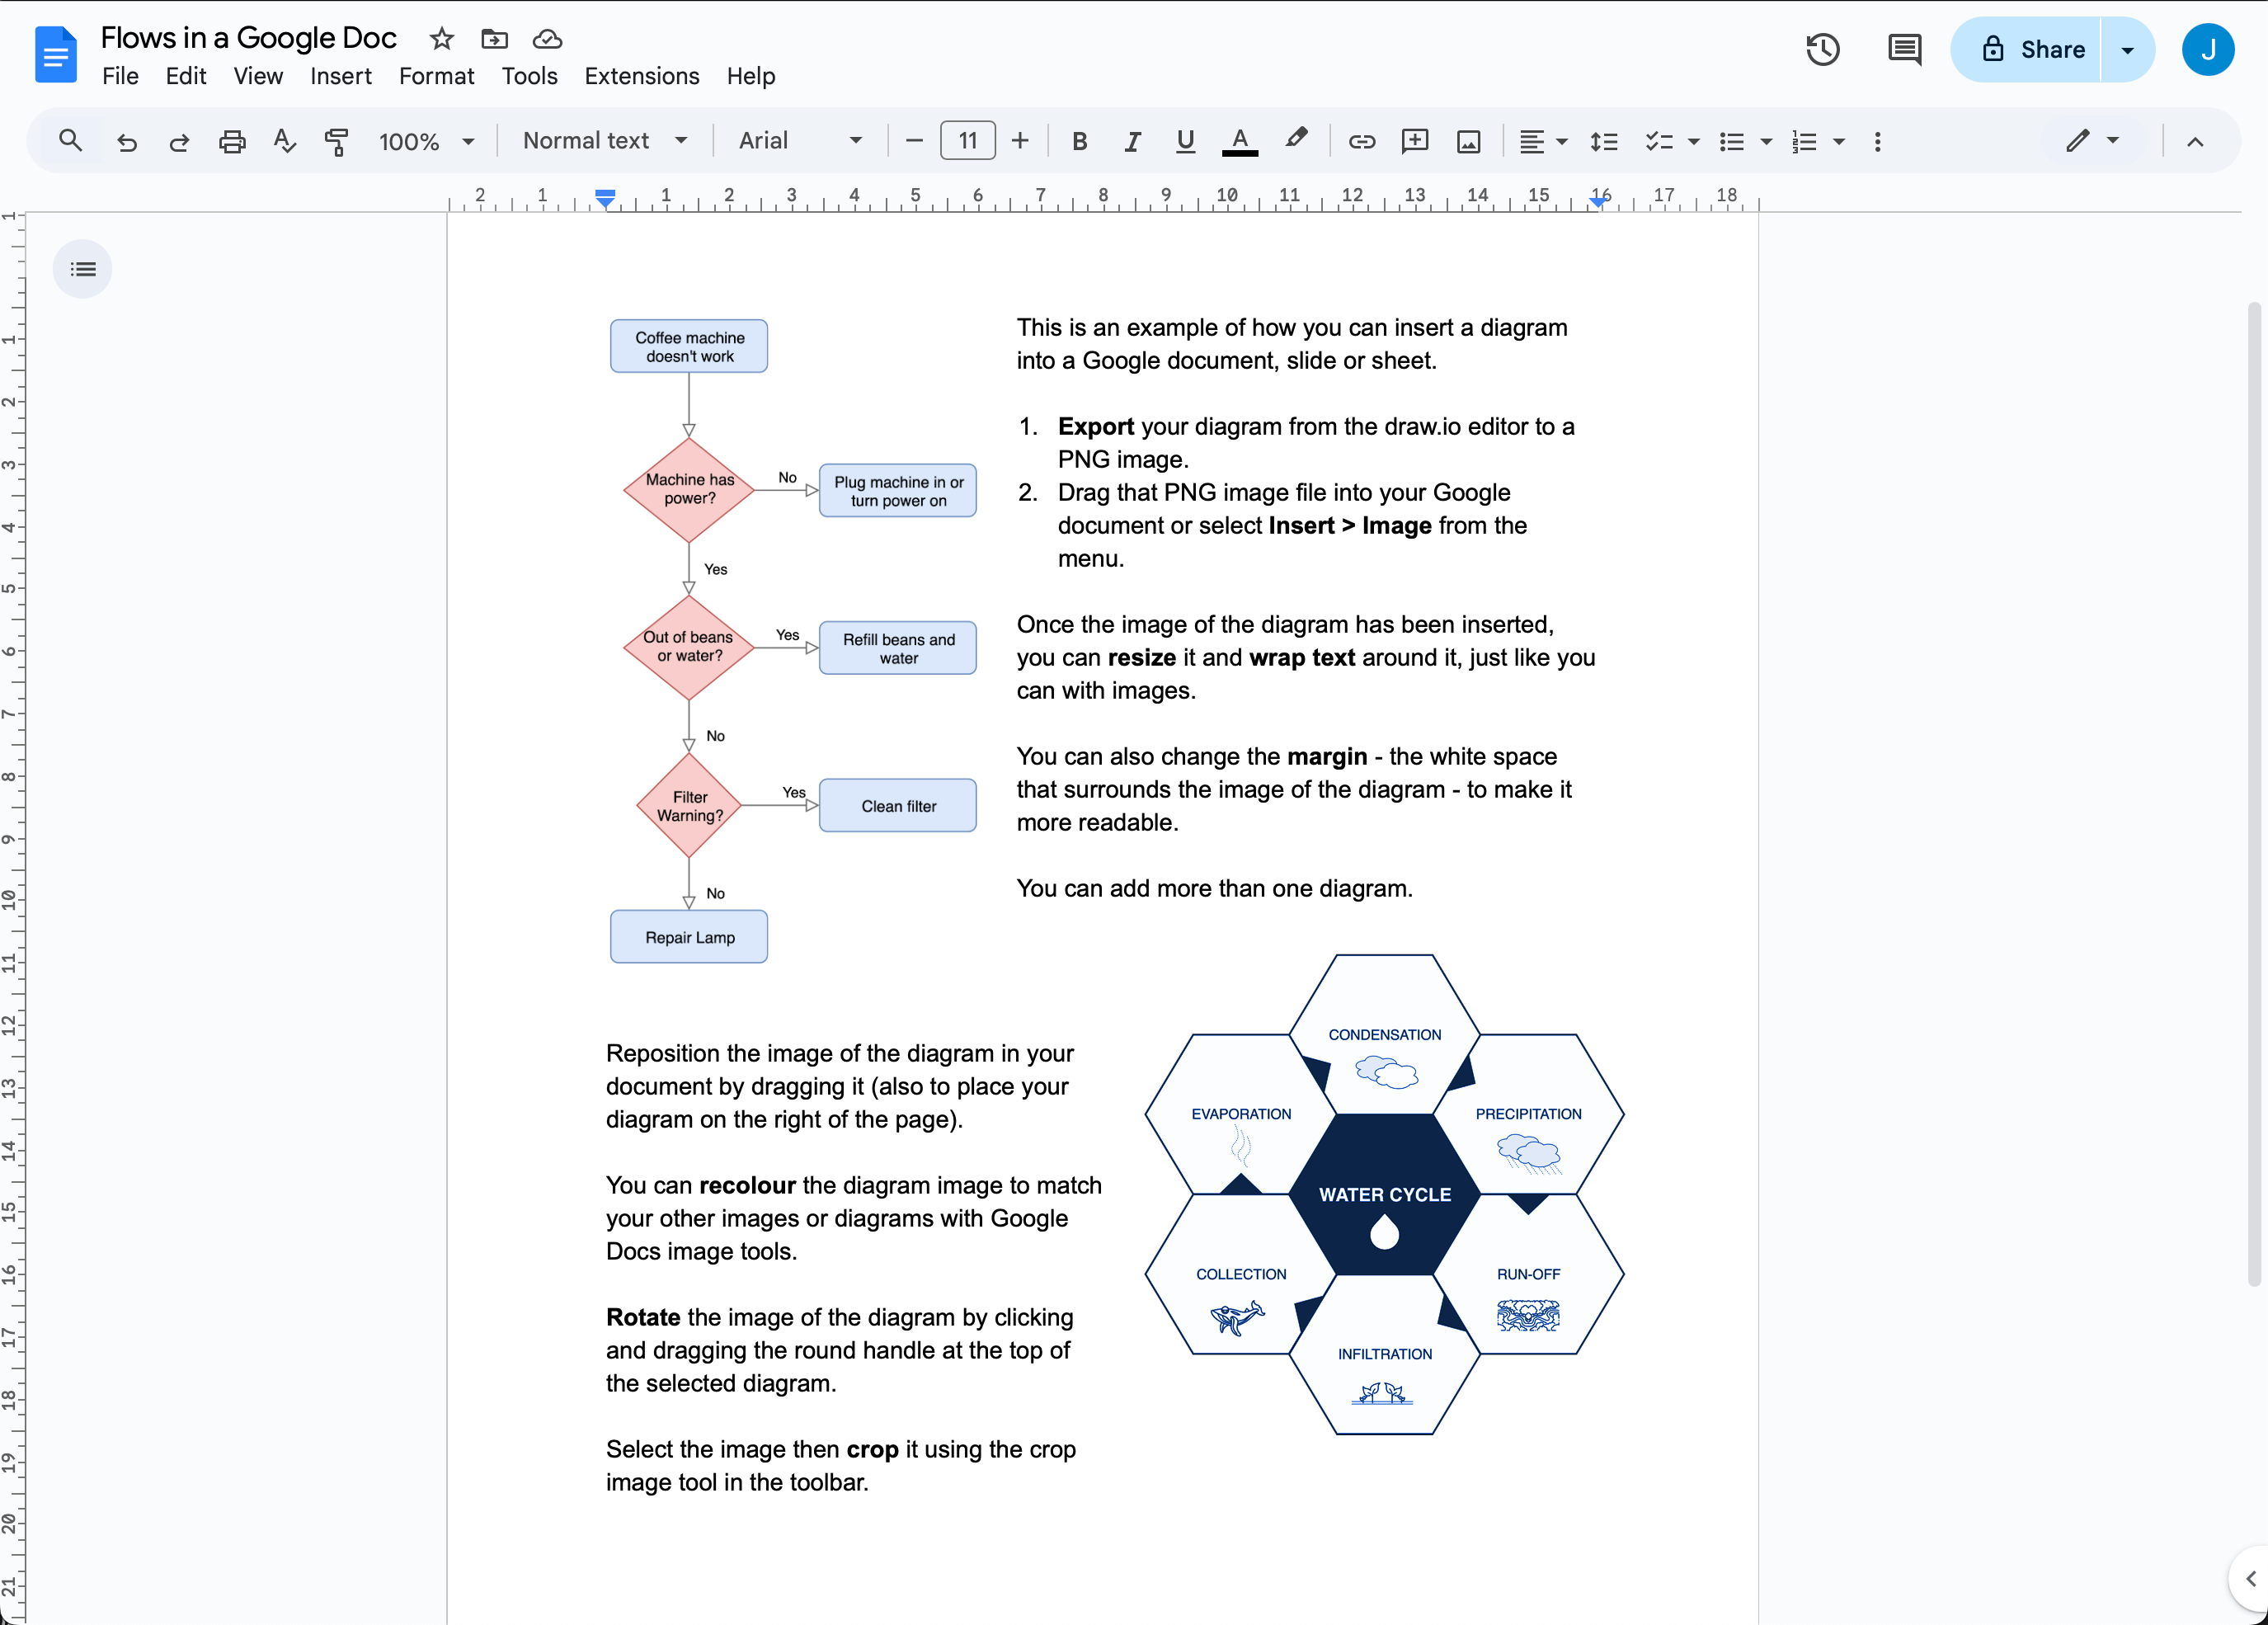
Export your draw.io diagrams to PNG image files and then import them into your Google Docs, Slides and Sheets - drag and drop the image file into your document.
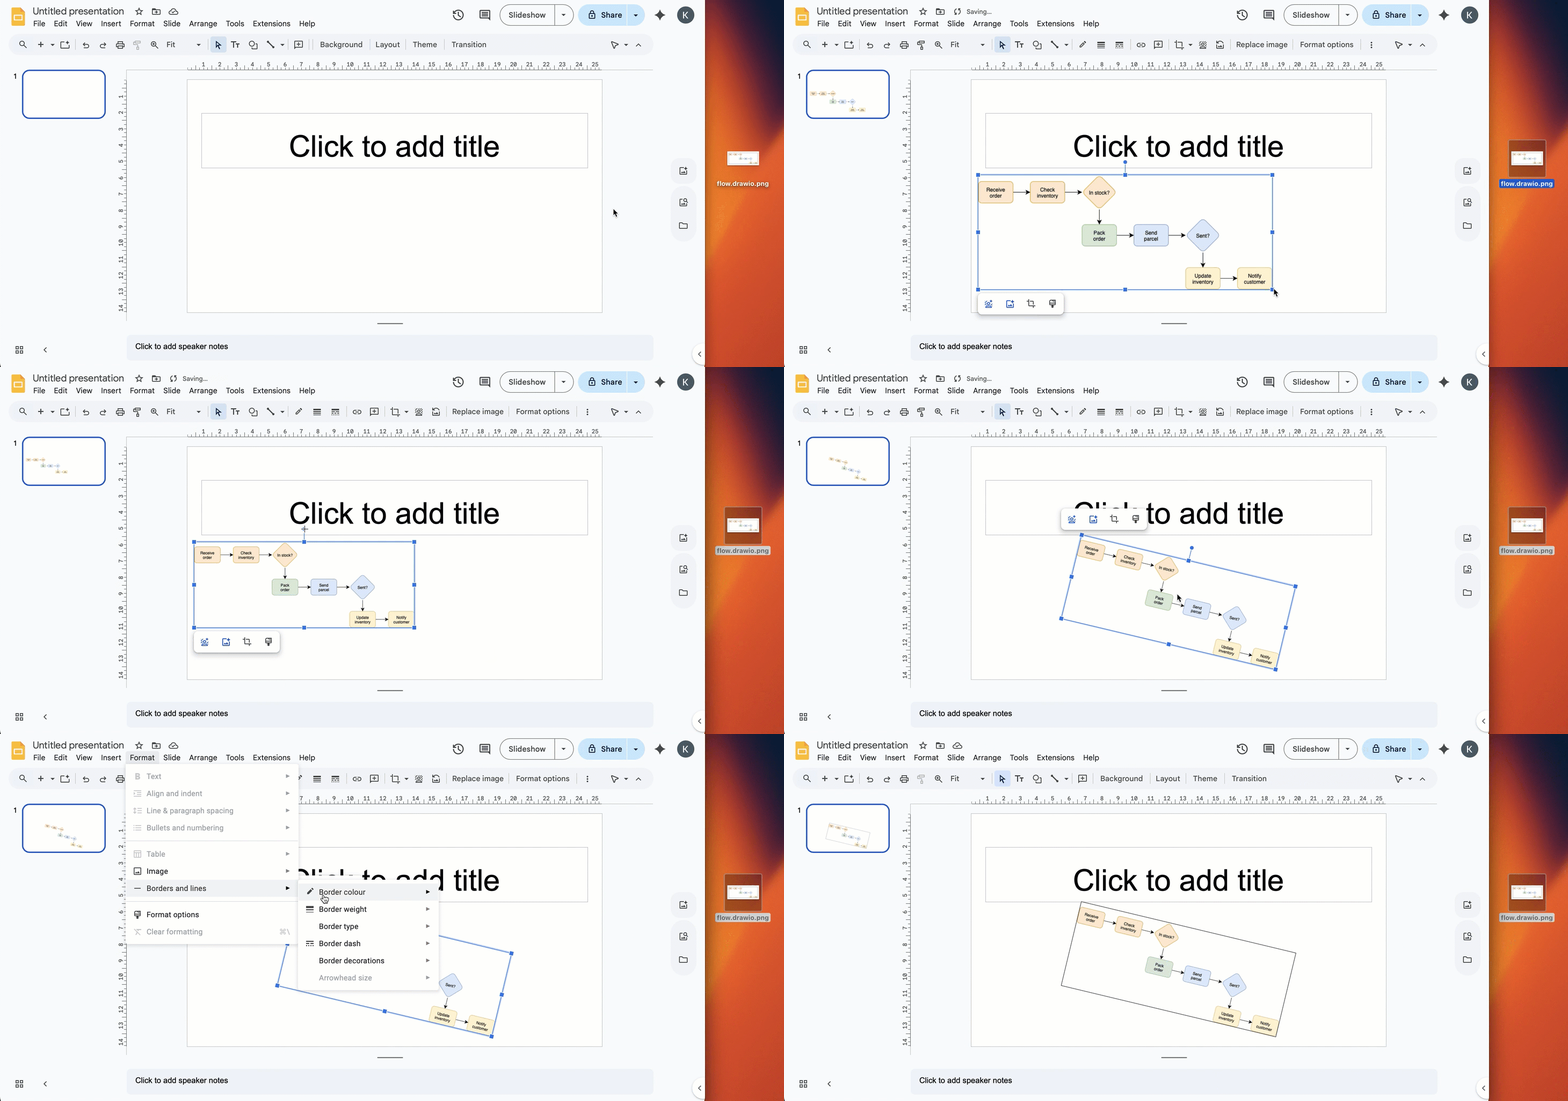
Export a draw.io diagram to a PNG image, then import it into your Google document

  1. Open your .drawio diagram file in the draw.io editor (either our online editor or draw.io Desktop)
  2. In the draw.io menu, select File > Export As > PNG, then click Export to save your diagram as an image.
  3. In your Google Document, Slide, or Sheet select Insert Image from the menu, or drag and drop your image into your document.
Export a draw.io diagram to a PNG image, then import it into your Google presentation slide

You can work with the image of your diagram in your Google document (Docs, Slides or Sheets) as you would any other image - you can move, resize, rotate, and style it as needed.

Reopen your diagram from a draw.io image file

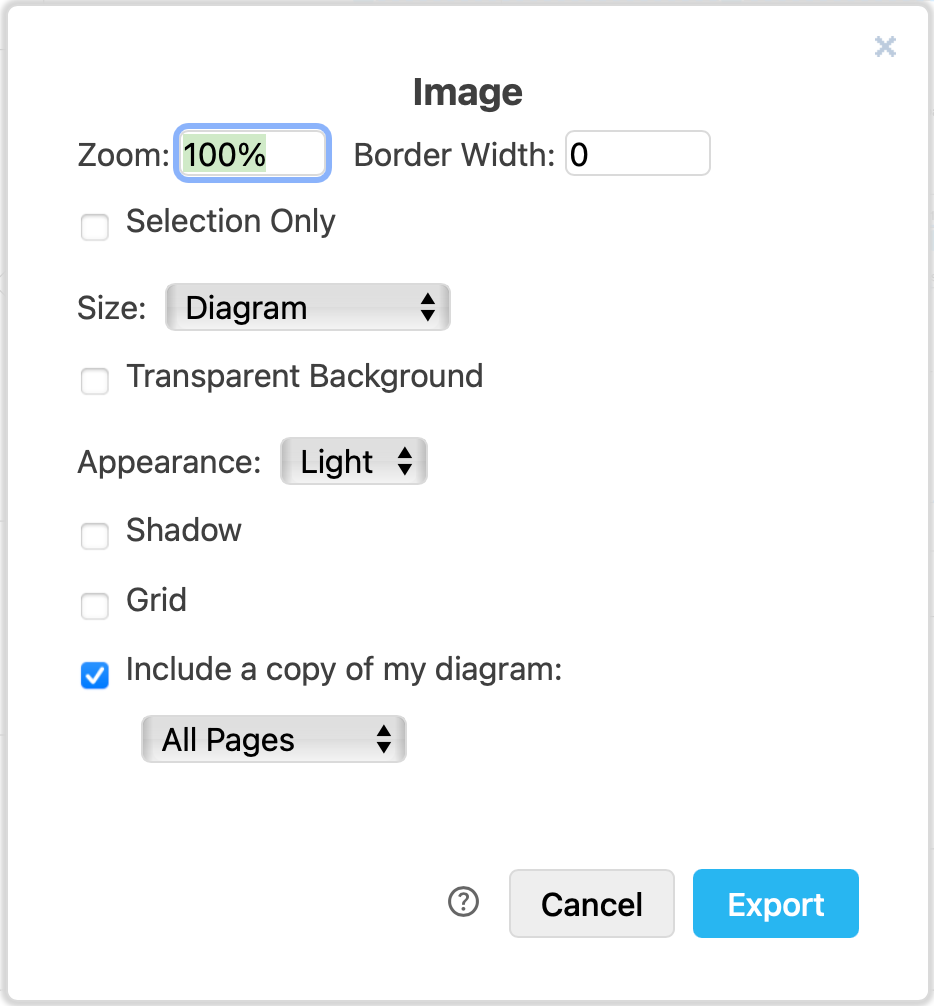
If you export your diagram from draw.io to a PNG image with Include a copy of my diagram enabled, you will be able to drop that image file onto the draw.io editor to load the diagram data embedded in that file and continue diagramming.
Choose the export settings for the PNG image

Note: You cannot reopen images from within Google documents as diagrams as Google strips the embedded diagram data.

Overlay or fill a cell in Google Sheets

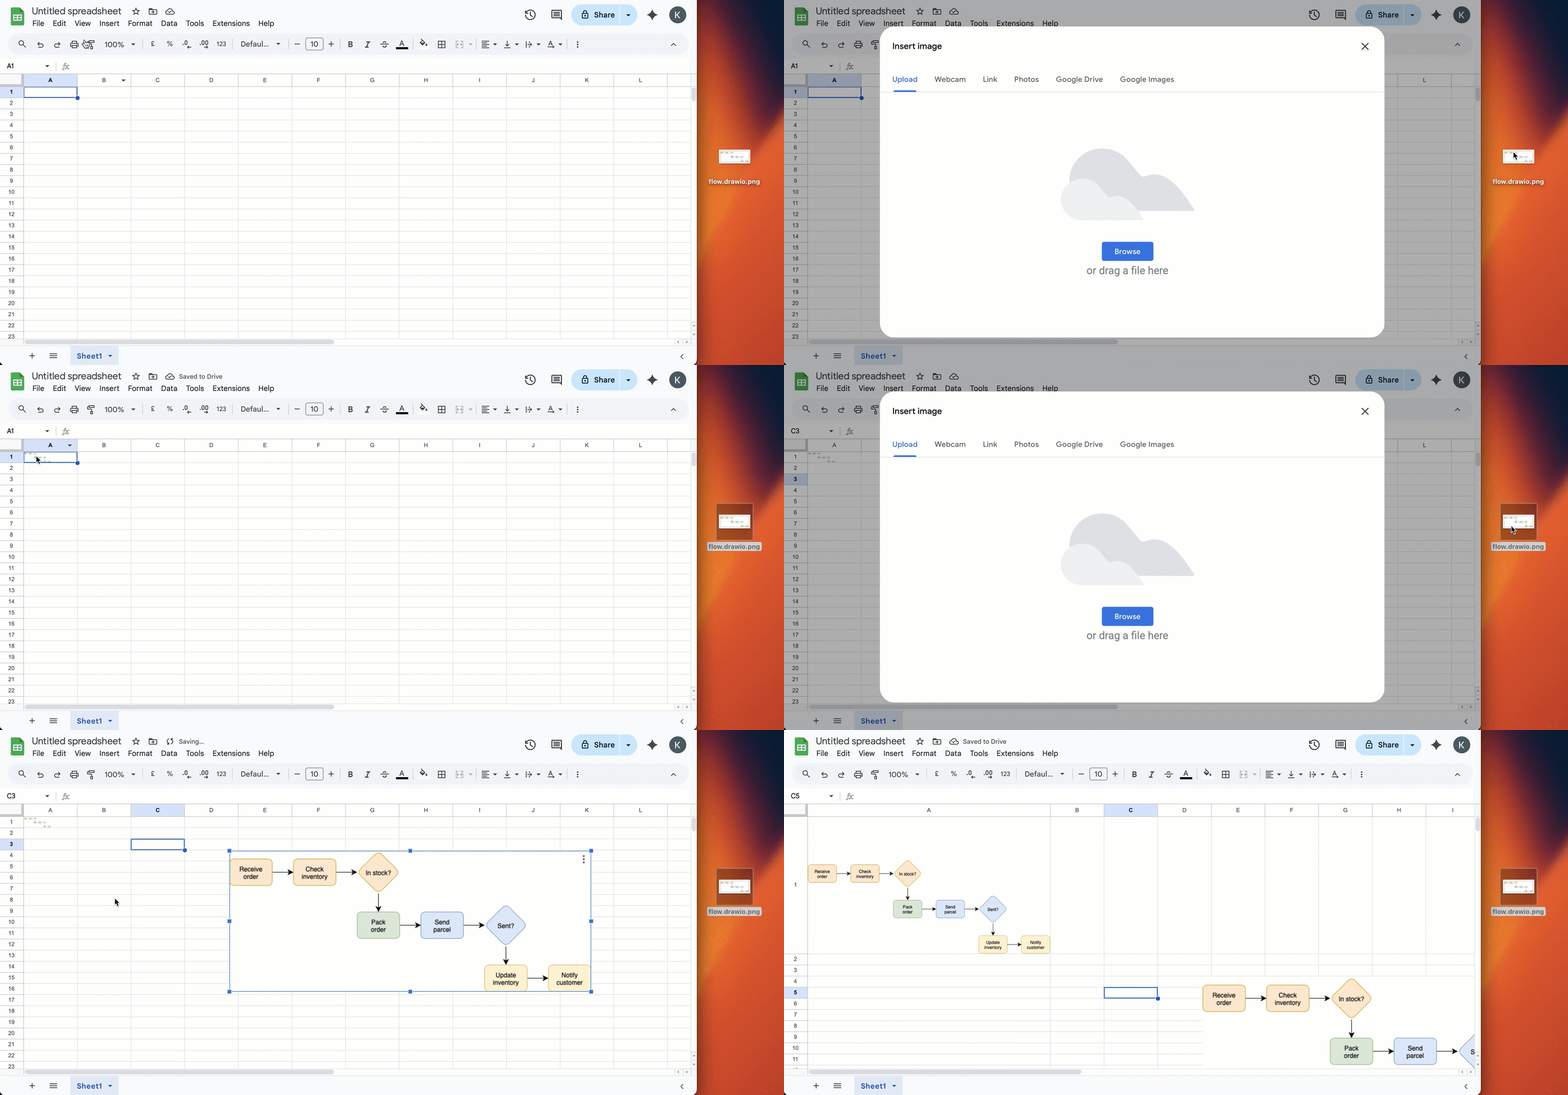
In Google Sheets, you can either import an image of your diagram into a cell or overlay the cells.
Export a draw.io diagram to a PNG image, then import it into your Google spreadsheet

A modern and streamlined interface for draw.io

· 4 min read

The draw.io editor is being freshened up to match the new Google Drive user interface with a modernised and streamlined user interface. All the drawing editor tools are in the same locations around the drawing canvas, so your workflow will not be disrupted.
The draw.io user interface has been modernised and streamlined, but all the editor tools are in their normal places - your workflow will not be disrupted

Edges and buttons have been rounded, fonts updated, colours softened, related menu items grouped together, and every aspect styled uniformly to match the current UI standards for modern web applications.

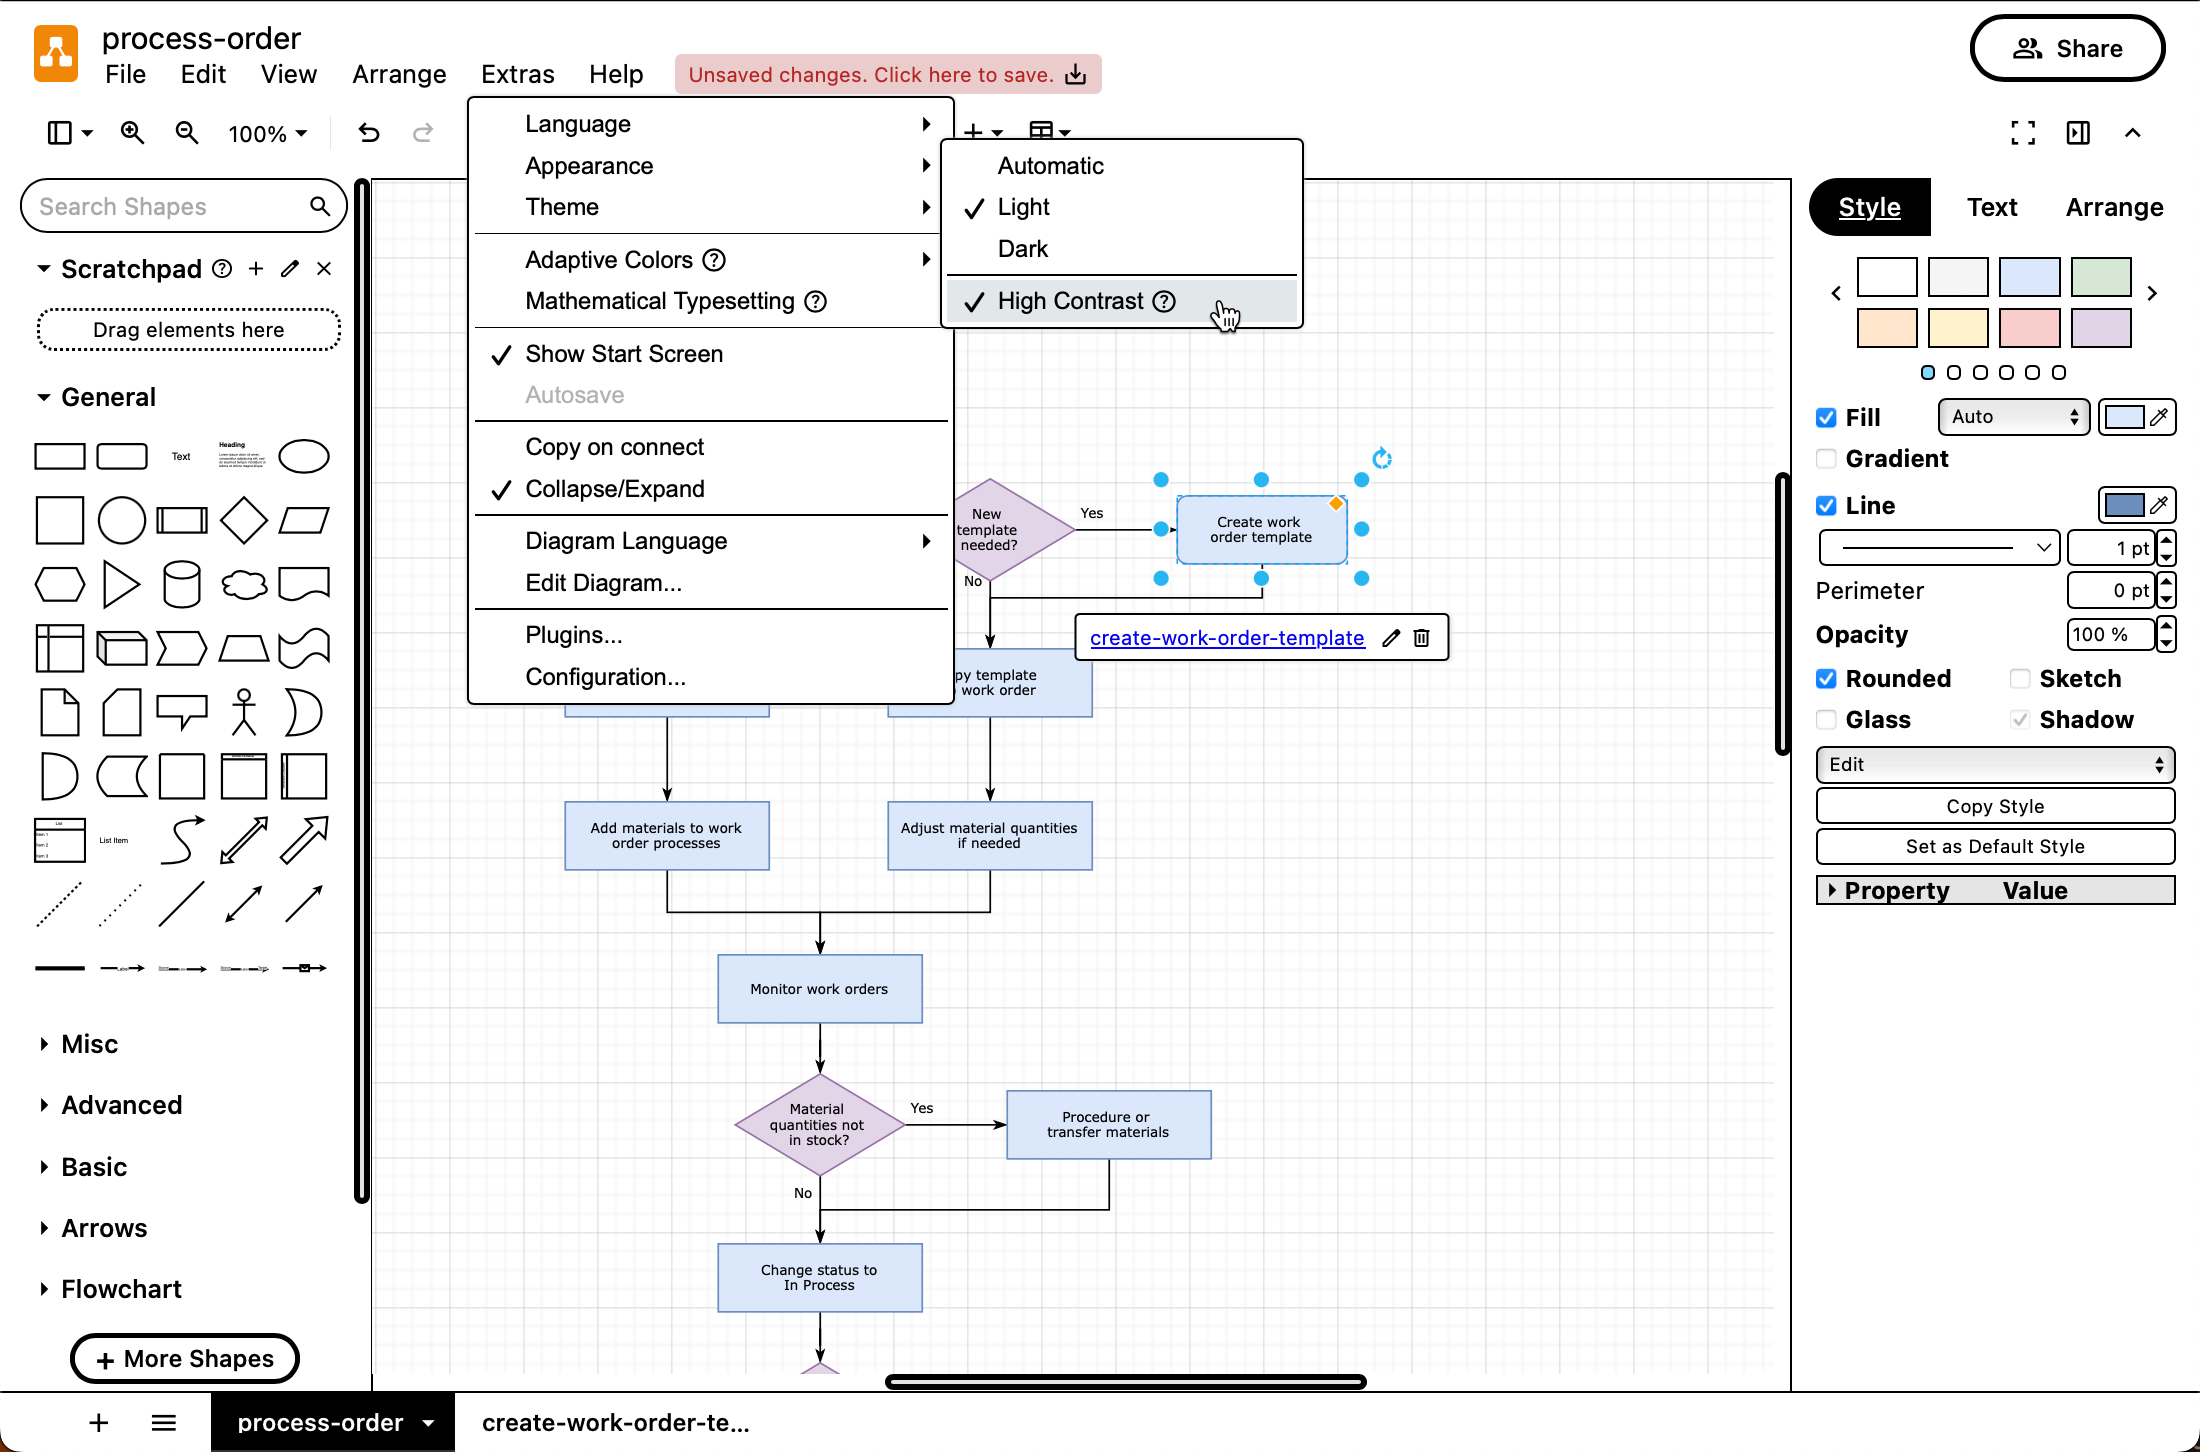
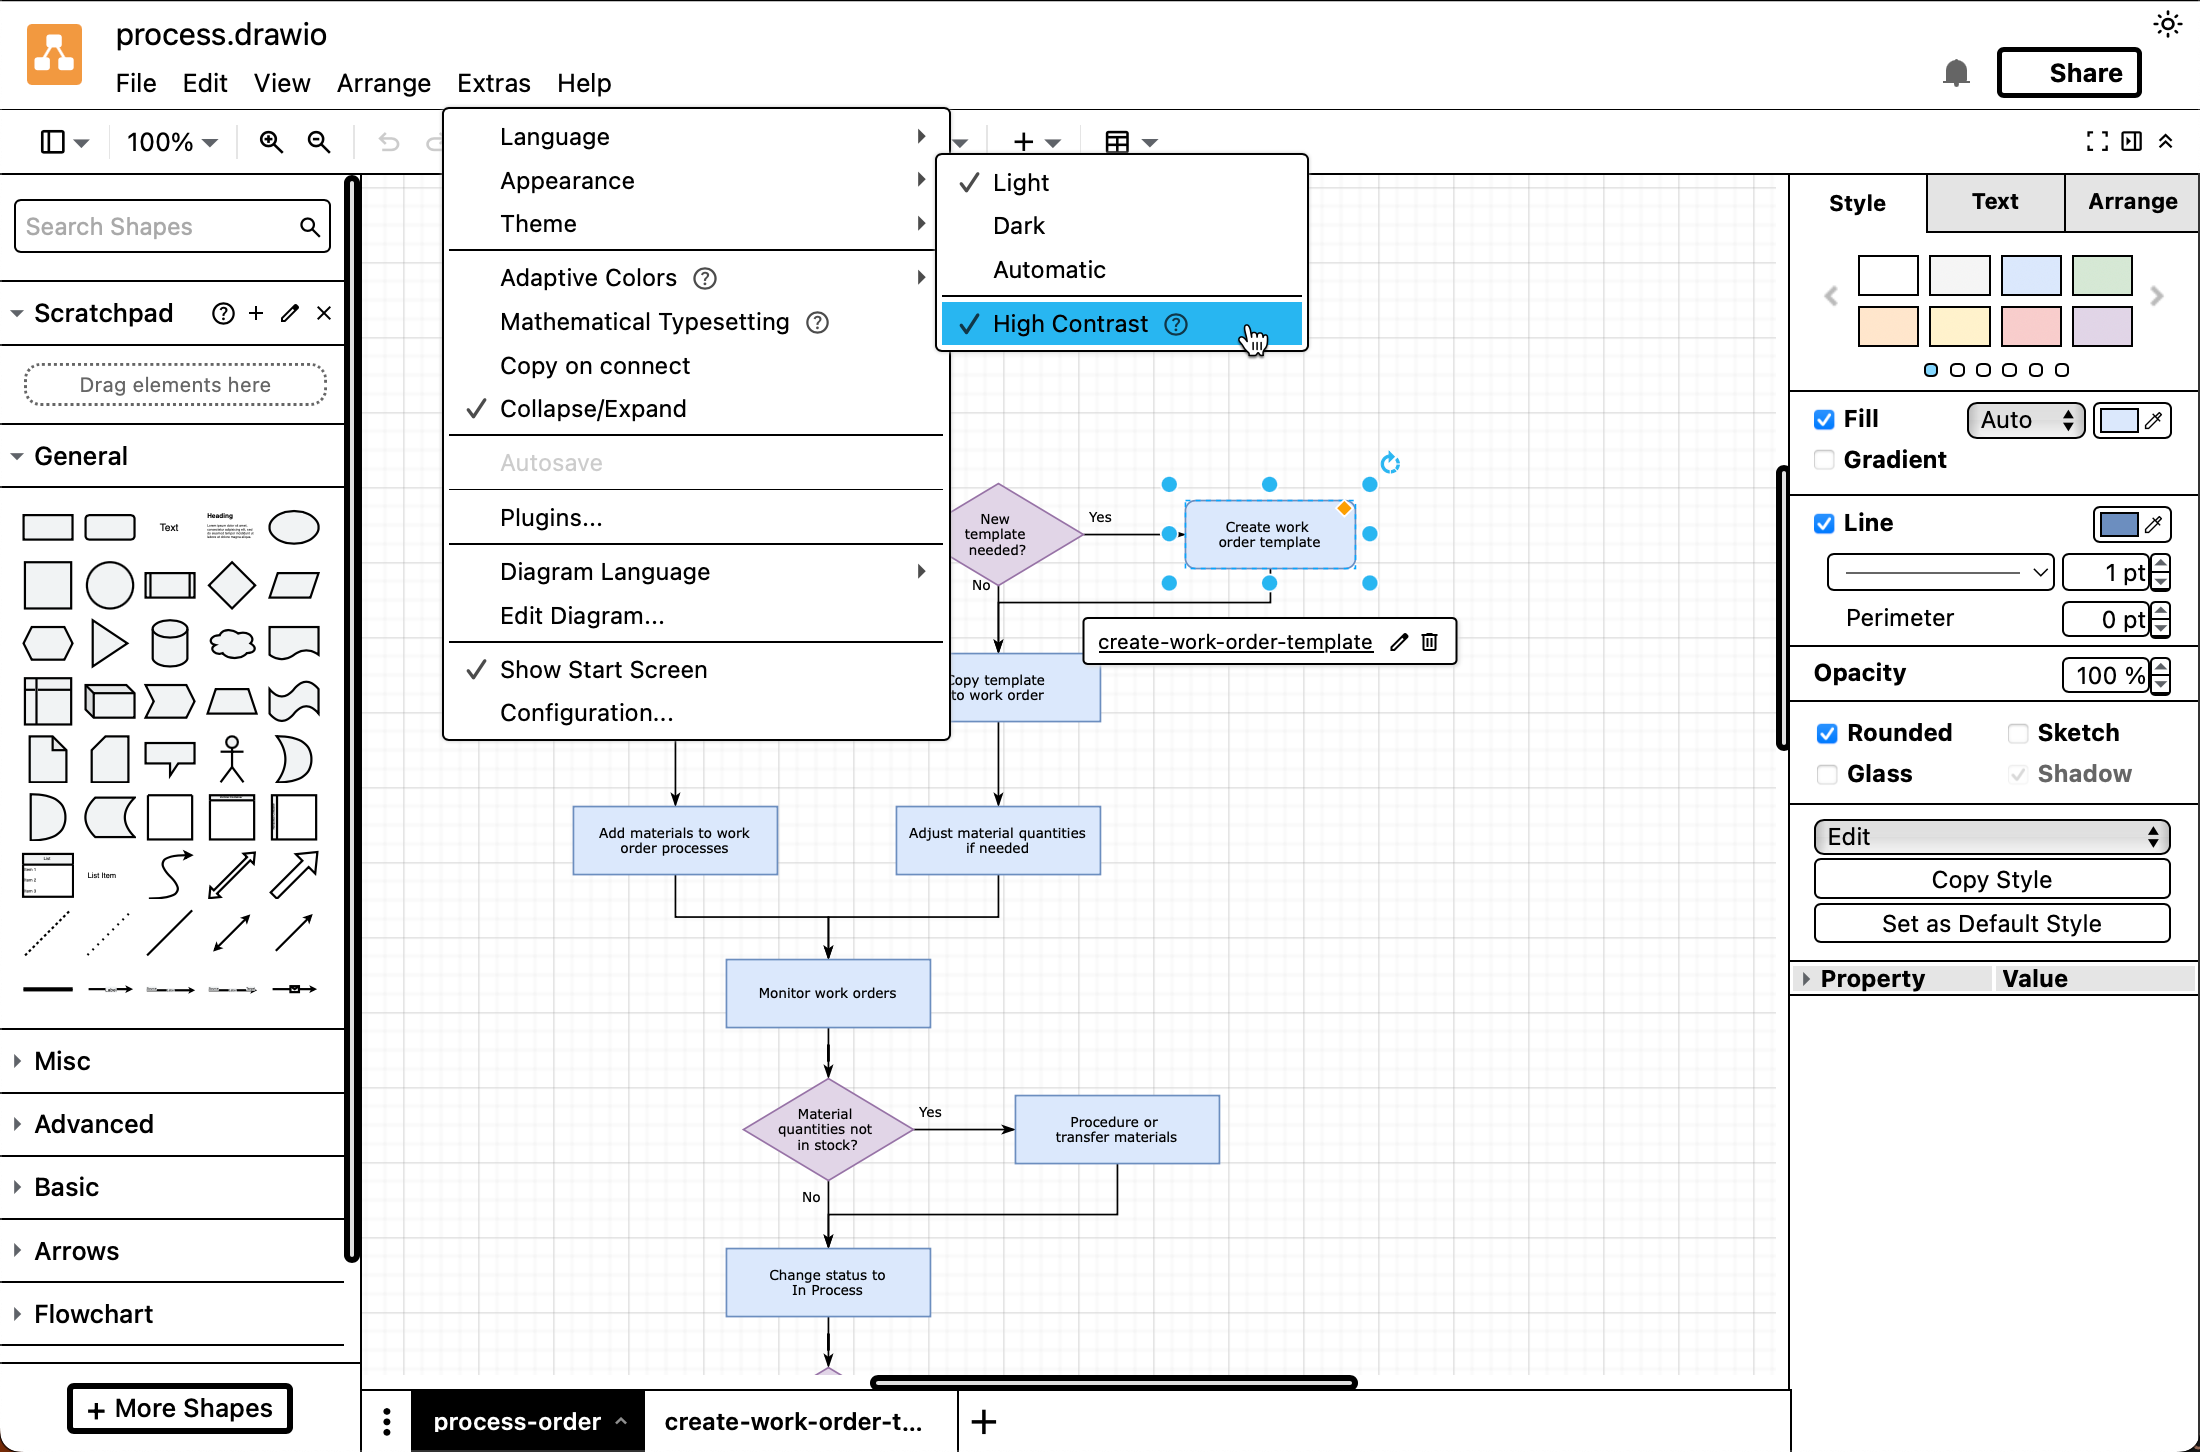
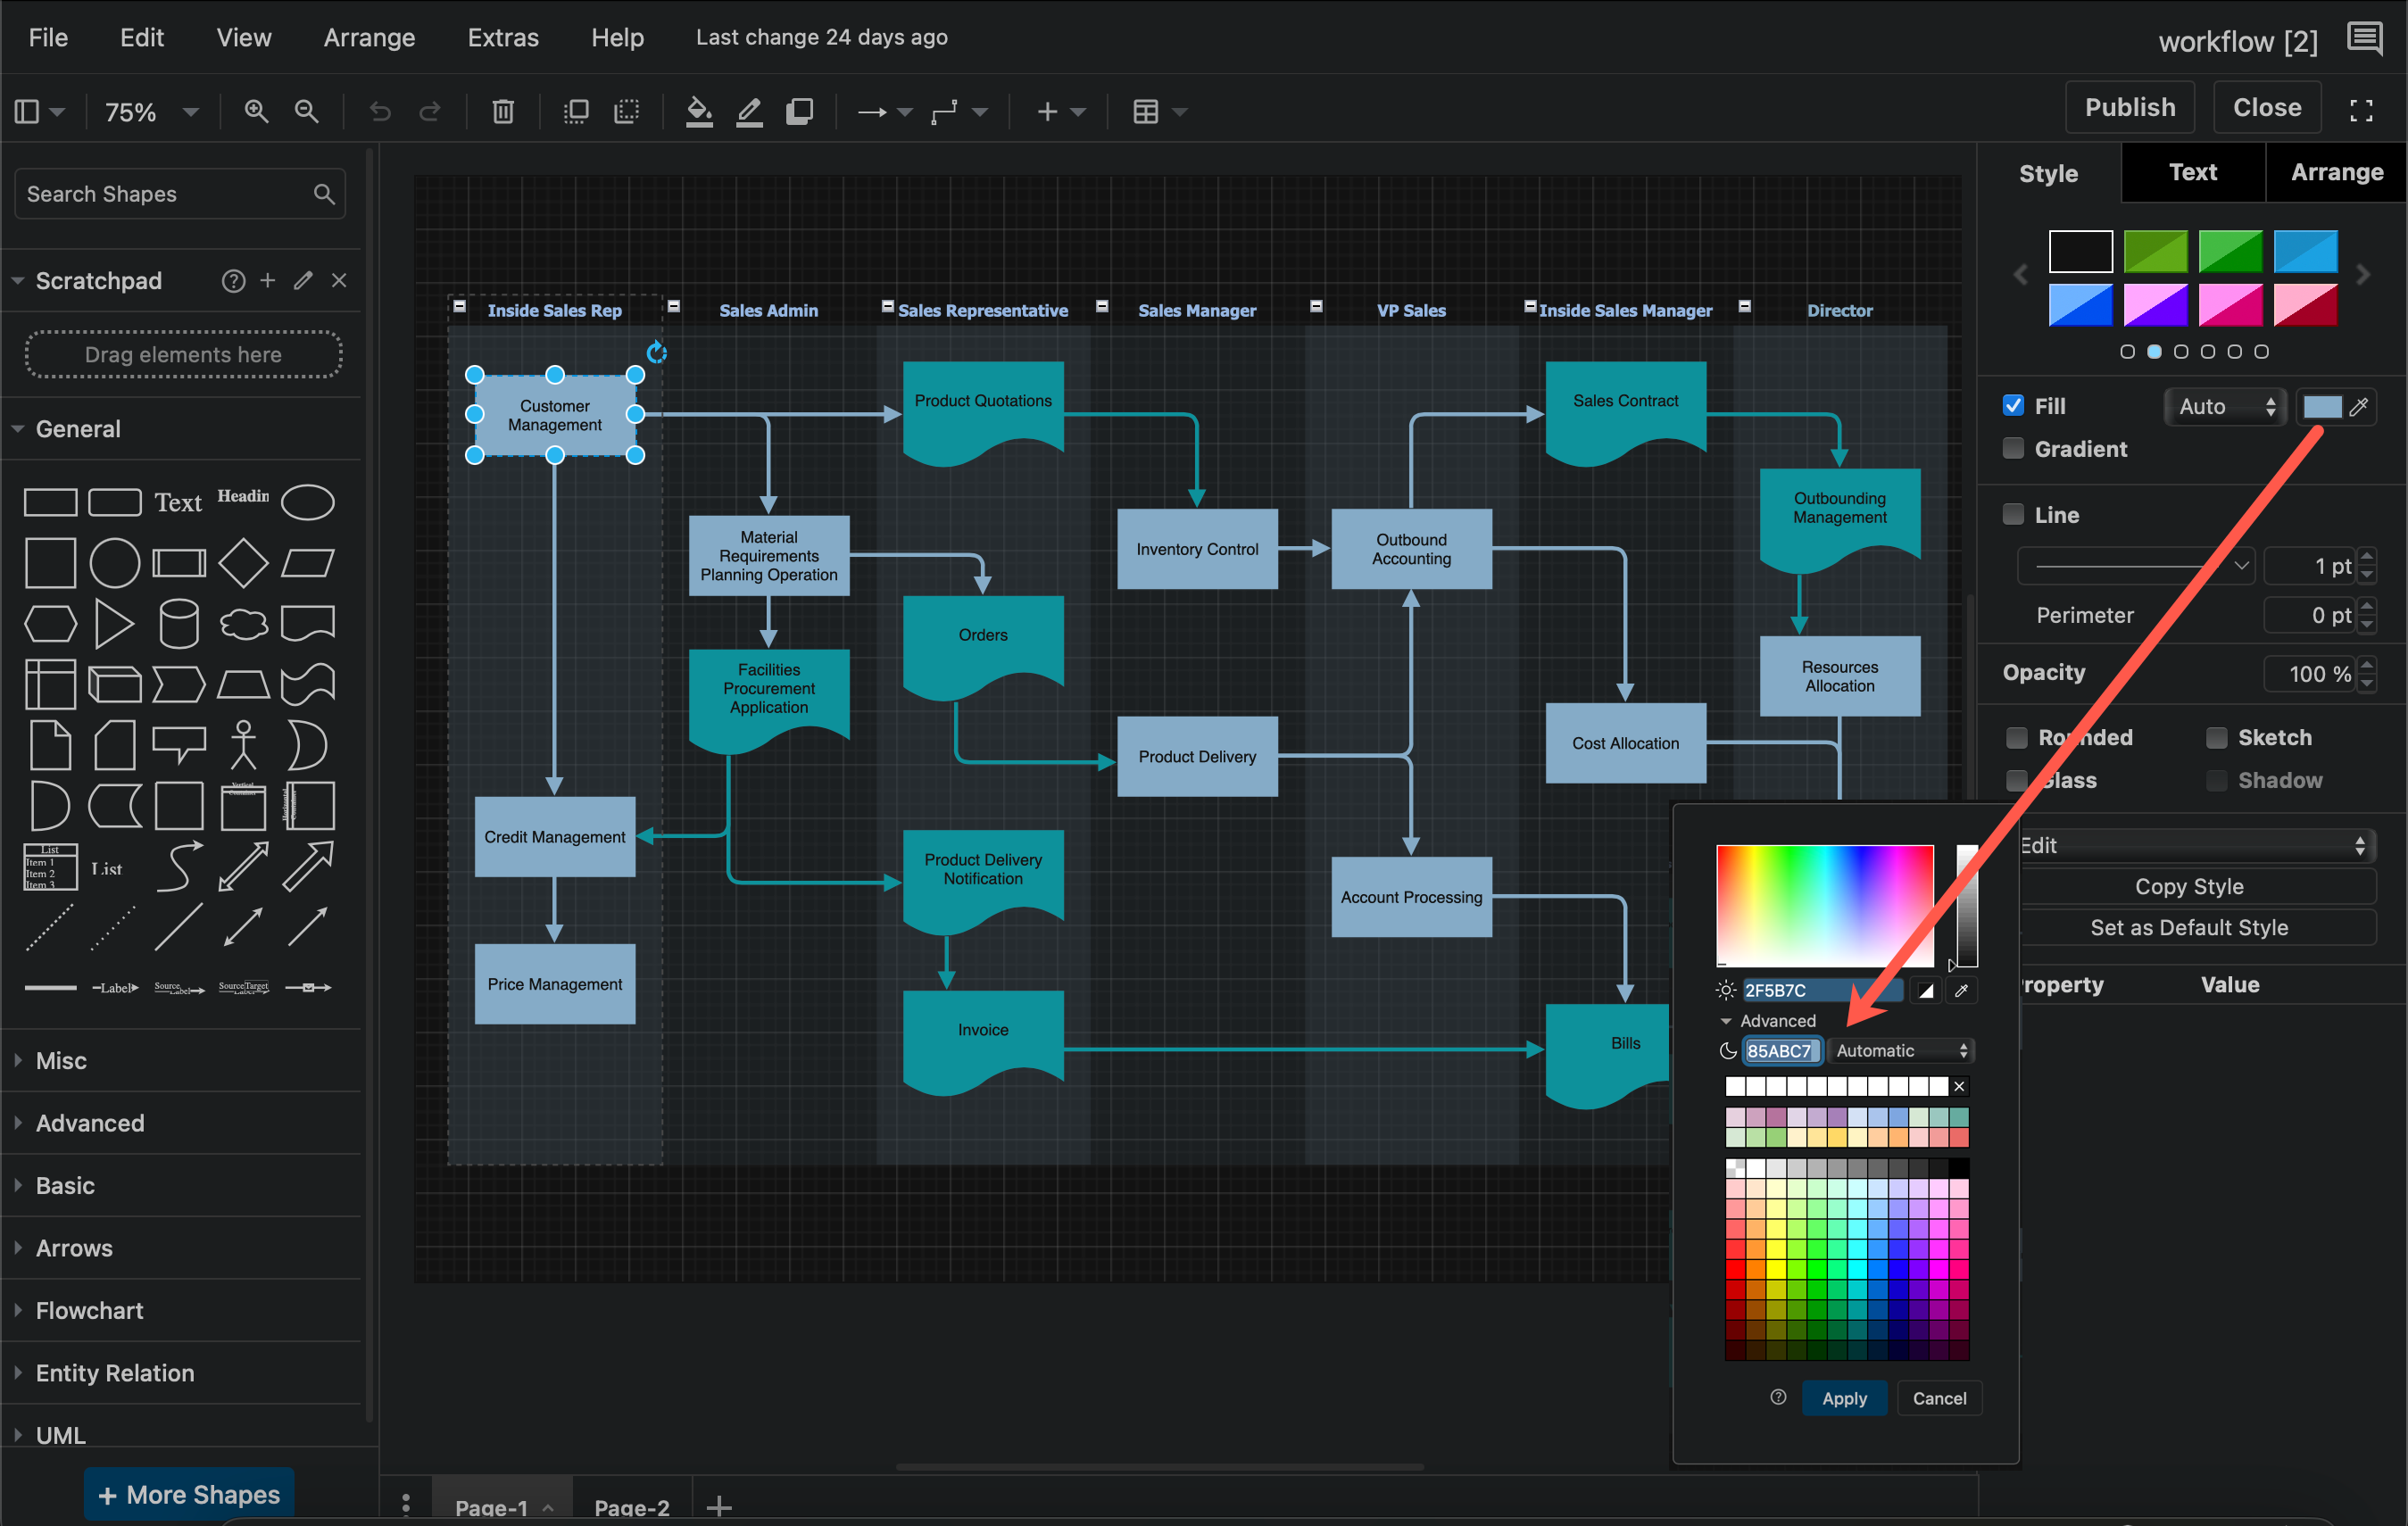
This new streamlined design with fewer obvious separators in the header, panels and tabs, and improved text and shape library contrast ensures the draw.io editor is easier to use in high-contrast mode, whether you prefer to work in dark or light mode.

The draw.io user interface has been modernised and streamlined, but all the editor tools are in their normal places - your workflow will not be disrupted The draw.io user interface has been modernised and streamlined, but all the editor tools are in their normal places - your workflow will not be disrupted
The new user interface in the first image above has fewer distracting separating lines in high contrast mode. The older interface in the second image is more cluttered with superfluous separators.

It's not just a visual refresh - the buttons and controls in the draw.io user interface have been optimised to be more responsive, and the codebase has been reworked to improve the editor's efficiency, especially on mobile devices, and allow for future improvements and feature updates.

Switch between modes and editor themes

Although the refreshed UI is easiest to see in Classic and Simple, the three other draw.io editor themes - Minimal, Sketch and Atlas - have also been updated with contrast improvements and modernised dialog elements.

The mode switch icon (sun/moon) for dark/light modes and the classic/simple editor layout that was previously in the top right of the editor has been moved into the menu for all themes.

  • Appearance submenu: automatic, dark, light and high contrast modes
  • Themes submenu: automatic, Classic, Simple, Minimal, Sketch, and Atlas themes

These submenus are accessed slightly differently in each editor theme.

Simple: Click ... in the toolbar and select Settings.
Click ... and select Settings to access the appearance and themes menu when using the Simple draw.io editor theme

Classic and Atlas: Select the Extras menu.
Click ... and select Settings to access the appearance and themes menu when using the Atlas or Classic draw.io editor themes

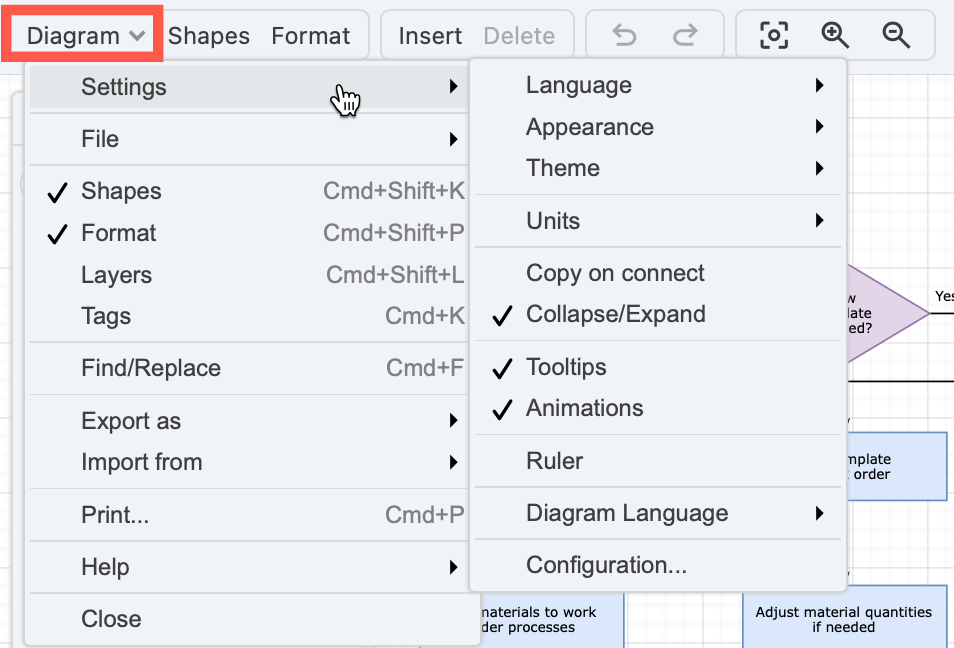
Minimal: Select Diagram > Settings from the toolbar.
Click ... and select Settings to access the appearance and themes menu when using the Minimal draw.io editor theme

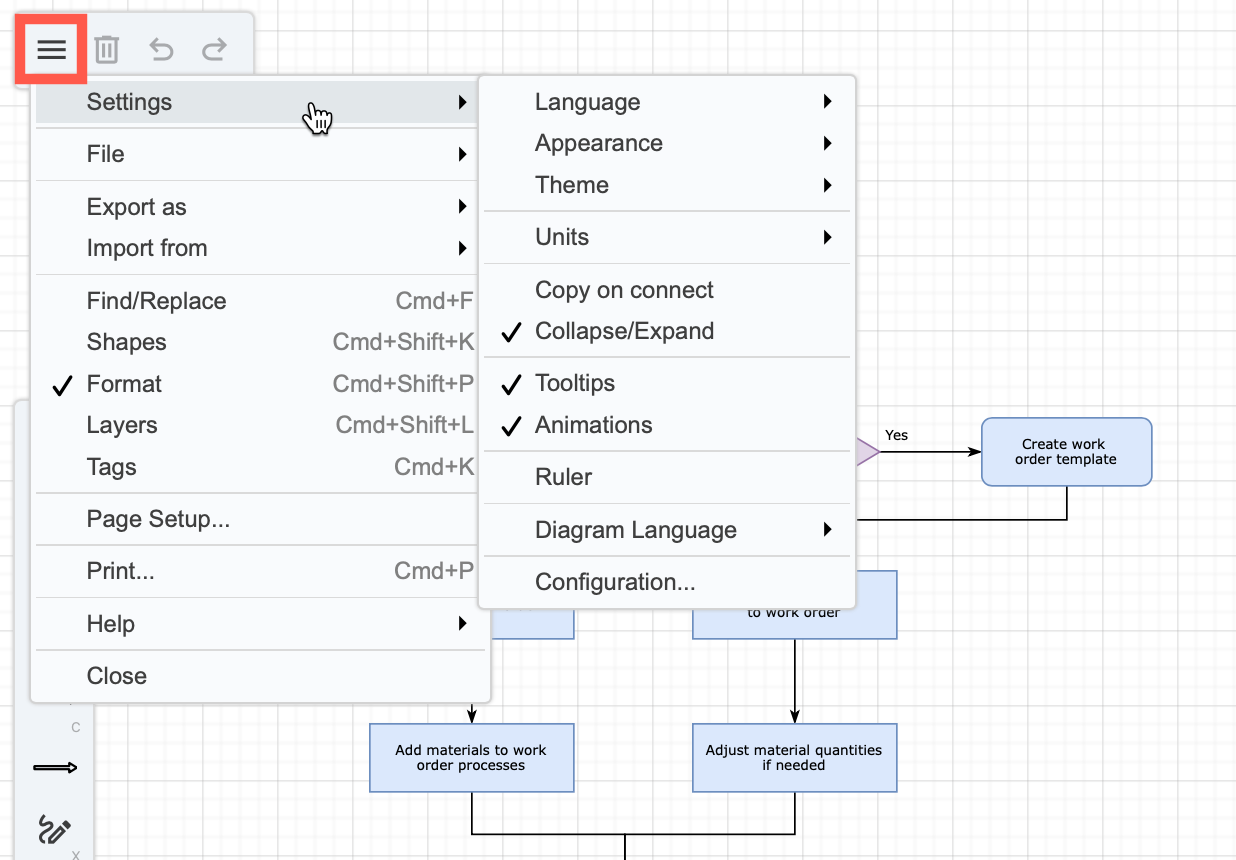
Sketch: Select the triple horizontal bar in the top left, then select Settings.
Click ... and select Settings to access the appearance and themes menu when using the Sketch draw.io editor theme

Work with multi-page diagrams

In Atlas, Classic and Simple themes with the refreshed user interface, the + to add a new diagram page has moved to the bottom left of the editor.
The diagram page tools in the Minimal and Sketch editor themes are unaltered.

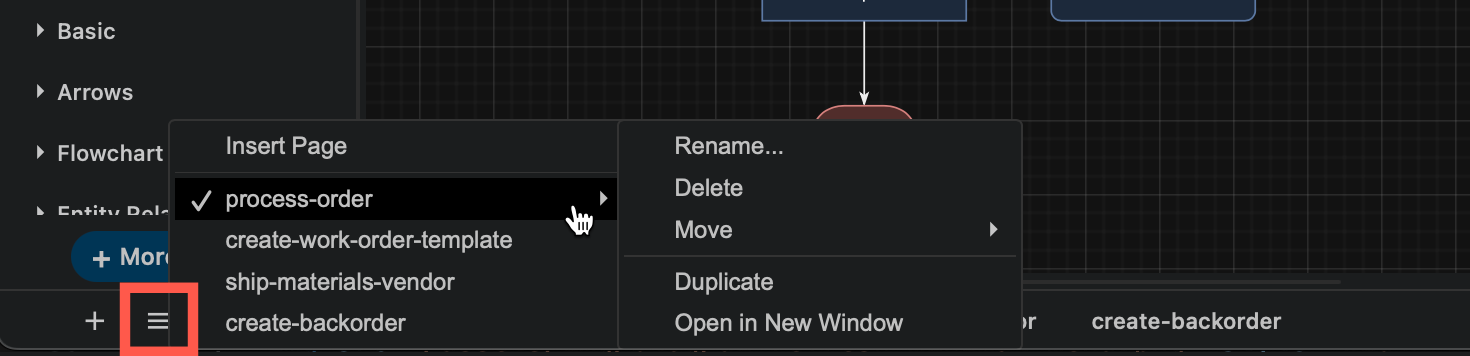
Click on the horizontal lines to see a list of all pages in the diagram (if there are too many to fit) and work with the current page directly, or right click on any page tab at the bottom of the editor to rename, duplicate, move and delete it.
Click on the + in the bottom left to add a new page, and the horizontal lines to see a list of all pages in your diagram

Learn more about working with multi-page diagrams in draw.io

draw.io app Editions for Atlassian Confluence Cloud (early access program)

· 2 min read

App editions for Atlassian Confluence Cloud will soon be available for customers who sign up for Atlassian's early-access program. App editions is a new Atlassian Marketplace feature introduced with Forge, and draw.io will be available in Standard and Advanced editions.

If you are not in the early access program, your draw.io Confluence Cloud app will continue to receive regular updates and support as in your current subscription, and of course, the full features of the draw.io diagram editor, including AI-generated diagrams.

If you sign up for the new early access programme for app Editions in the Atlassian Marketplace, draw.io will be available in the following two editions for Confluence Cloud.

  • The Standard edition includes all the diagramming features of the draw.io editor, including AI-generated diagrams. When you need support, your Confluence Cloud administrators can submit support tickets and receive the standard level of support (9/5 business hours).

  • The Advanced edition of draw.io for Atlassian Cloud products is for large enterprise customers who require advanced support and stricter data security. Along with the fully featured draw.io app from the Standard edition, you will receive the following additional support:

    • Extended support hours and shorter initial response times.
    • A dedicated account manager as your single point of contact for enquiries.
    • Custom security reviews for compliance submissions.
    • Access to development feature previews.
    • In-depth and targeted training materials.
    • A zero-egress switch that can disable all data egress except for Atlassian API calls in the draw.io Forge app version.

See how to use draw.io in Confluence with diagram files stored in Google Drive.

Administrators can configure the draw.io app in Confluence Cloud in the Advanced edition to enable the lockdown option.

You can diagram offline with the draw.io desktop app if you need to work in a highly secure environment.

We are fully committed to data security and privacy - learn more about data protection while diagramming and using draw.io.

More updated networking and cloud shape libraries

· 4 min read

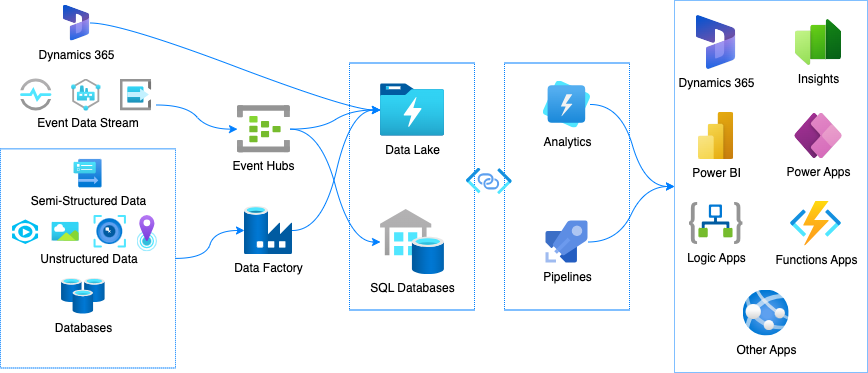
In addition to updating the main AWS and Azure shape libraries in draw.io, several new networking and cloud shape libraries have been added, including shapes for Alibaba Cloud, Dynamics365 and OpenStack.
Several new cloud infrastructure libraries have been added, and the Azure and AWS shape libraries have been updated in draw.io

Open cloud infrastructure shape libraries

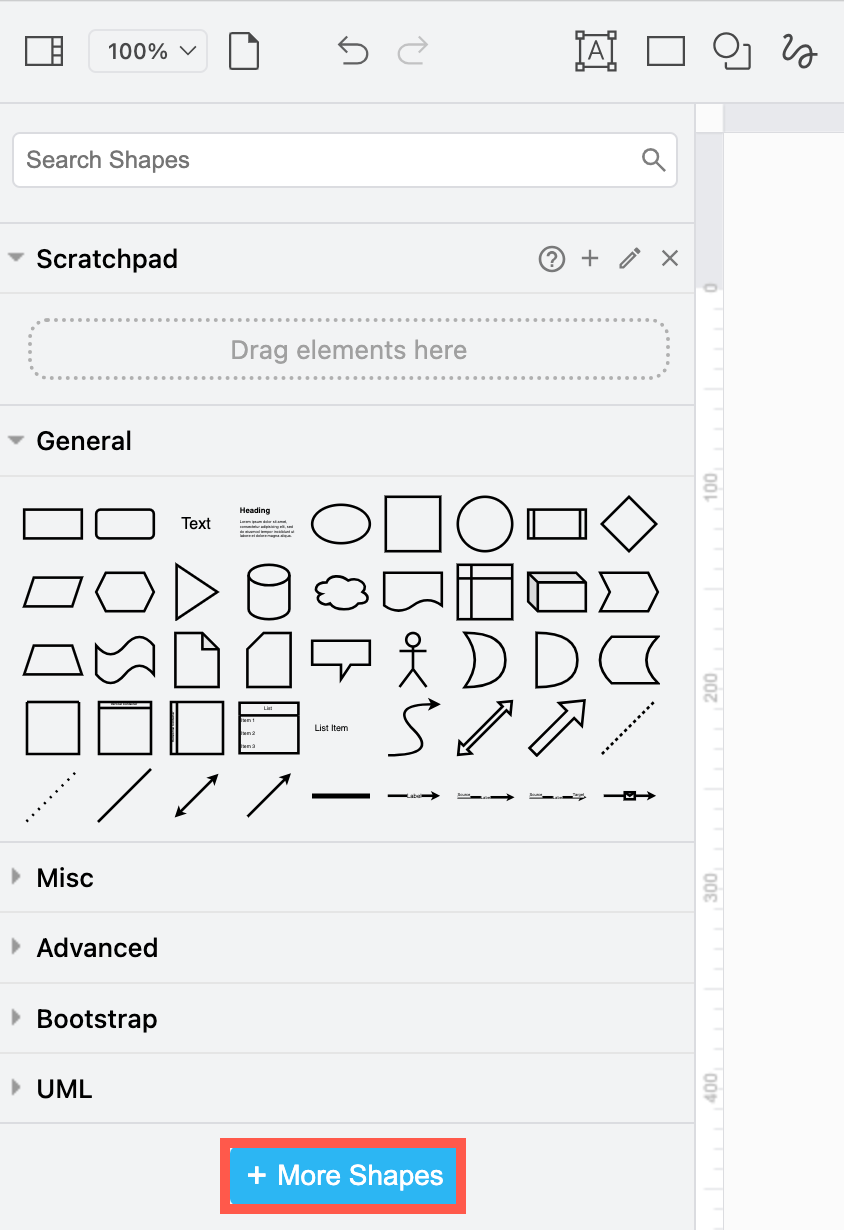
  1. Click on More Shapes at the bottom of the shapes panel on the left.
    Click on More Shapes in the shapes panel to open the shape library collection in draw.io
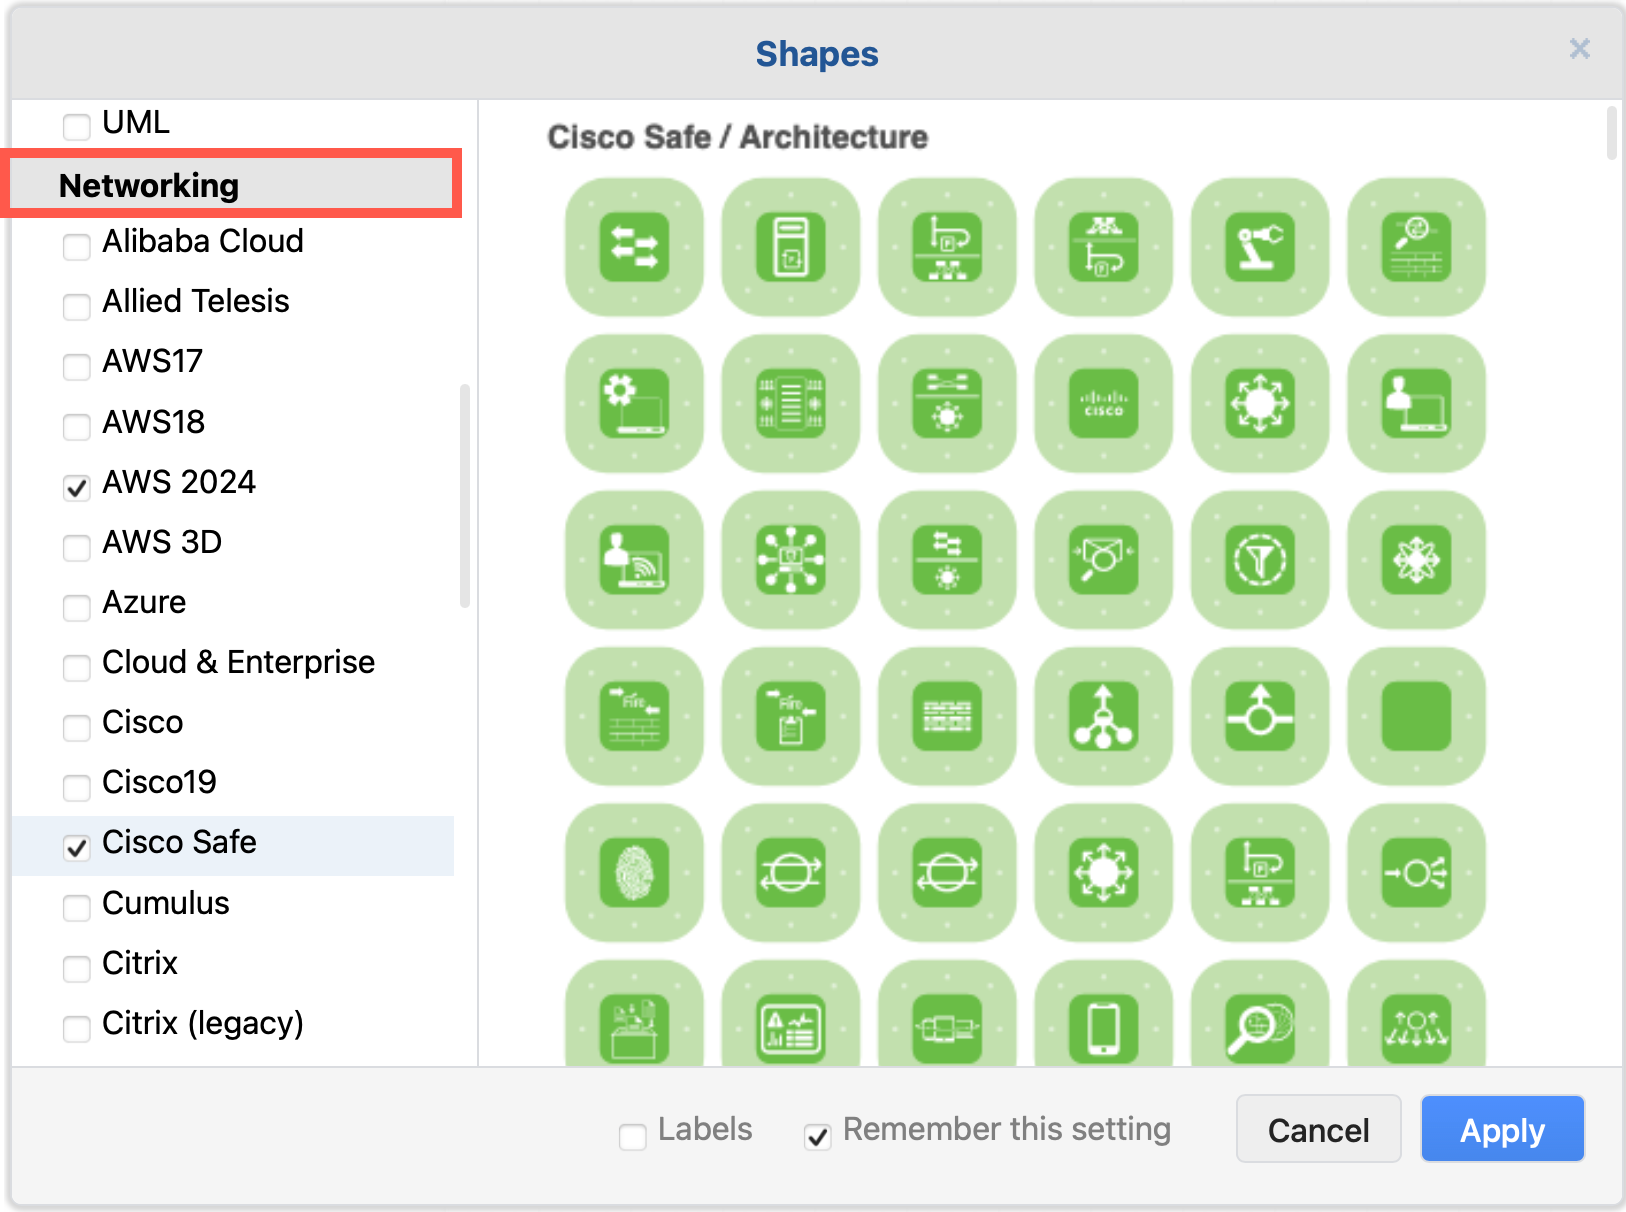
  2. Scroll down to the Networking section and enable the shape libraries you want to use.
    Enable the cloud infrastructure libraries you want to use in draw.io
  3. Click Apply to open them in the shapes panel next to the drawing canvas.

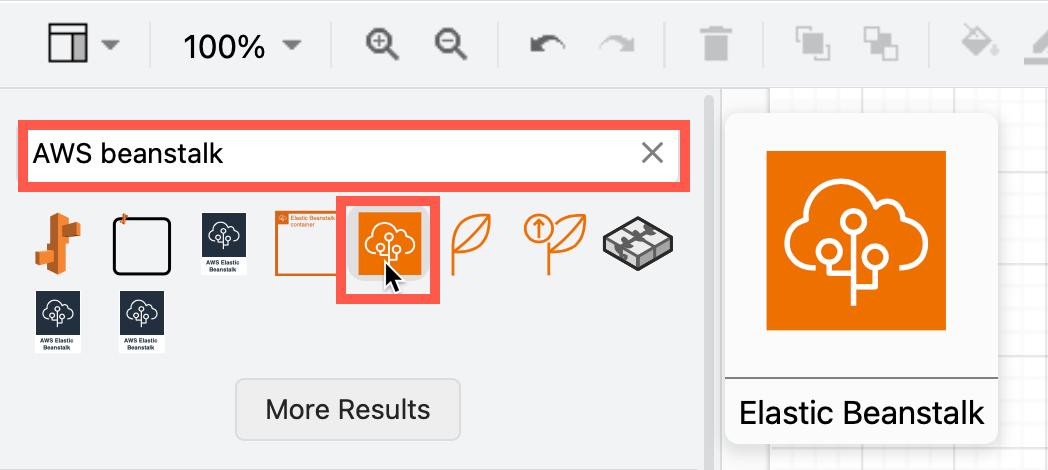
Tip: Alternatively, you can always search for a shape if you know its name. For example, searching for "AWS beanstalk" will show all the shapes from the various AWS libraries that have both "AWS" and "beanstalk" in their shape names, even if you don't have the AWS shape libraries open. Hover over any of the shapes to see a larger preview.
Search for any cloud infrastructure shape by its name to see all related shapes, even if you don't have the shape libraries open in draw.io

Azure Power Platform and Dynamics 365

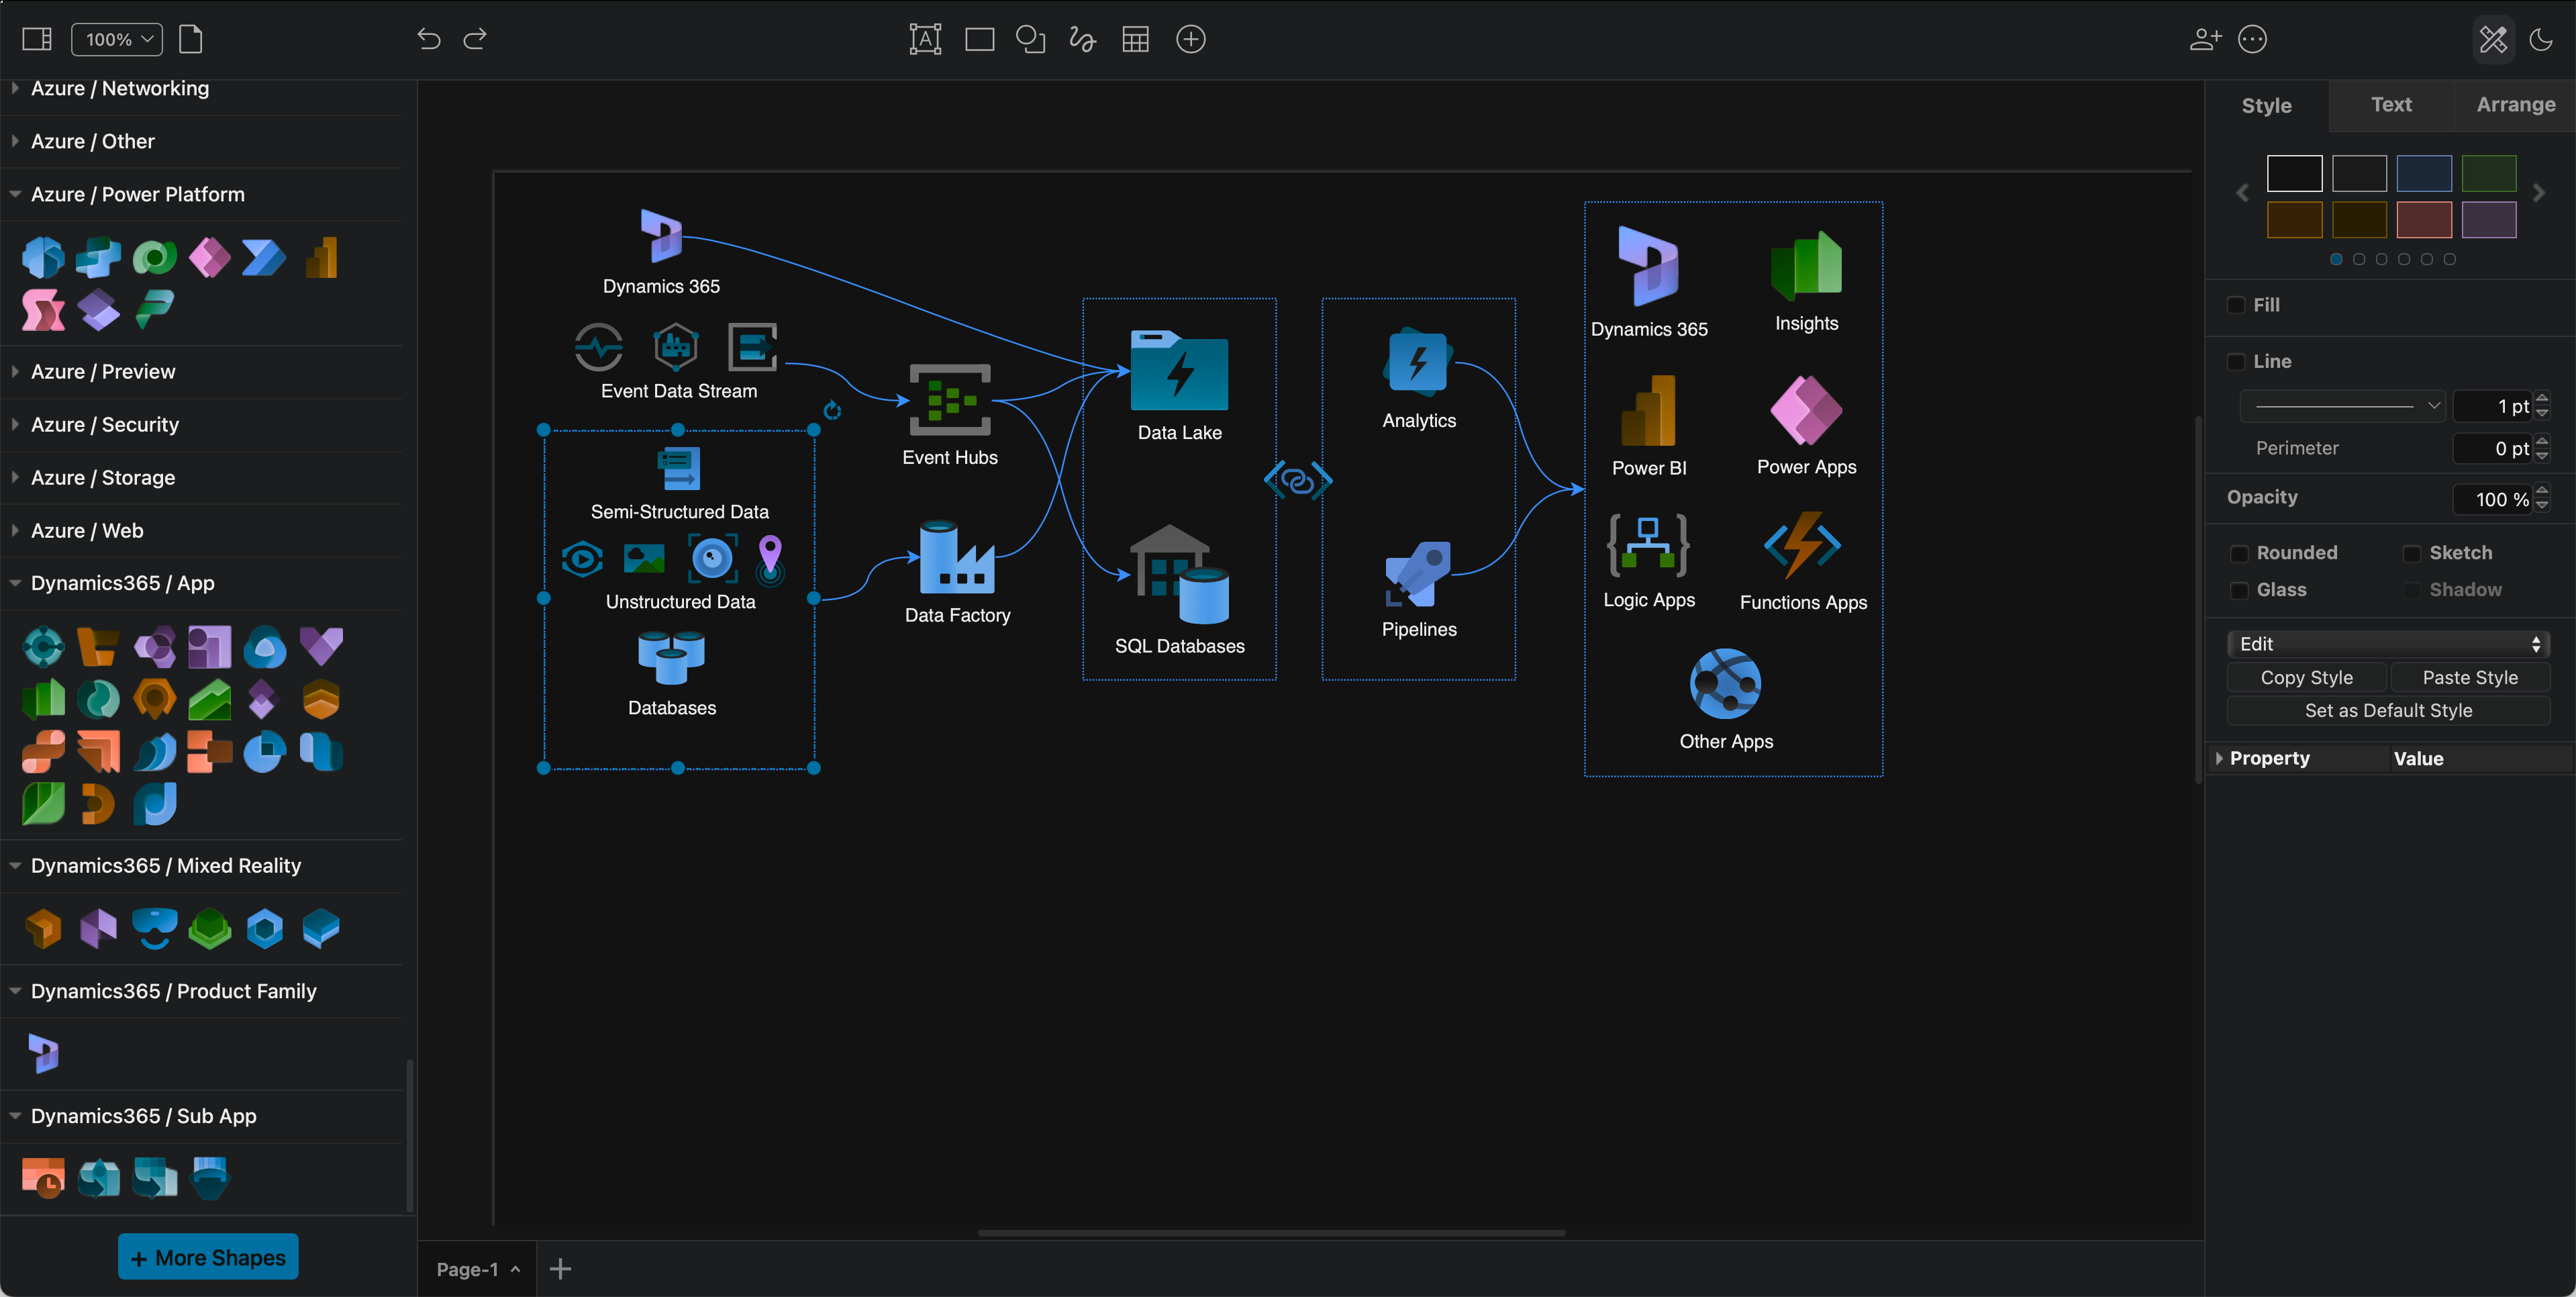
The Power Platform shapes have been added to the Azure shape library. These components are often combined with Dynamics365 services and applications in cloud infrastructures.
Tip:* If you prefer to diagram in dark mode, the Azure and Dynamics365 shapes and their labels will automatically change colours to remain readable when you switch between dark and light modes.
Several new cloud infrastructure libraries have been added, and the Azure and AWS shape libraries have been updated in draw.io

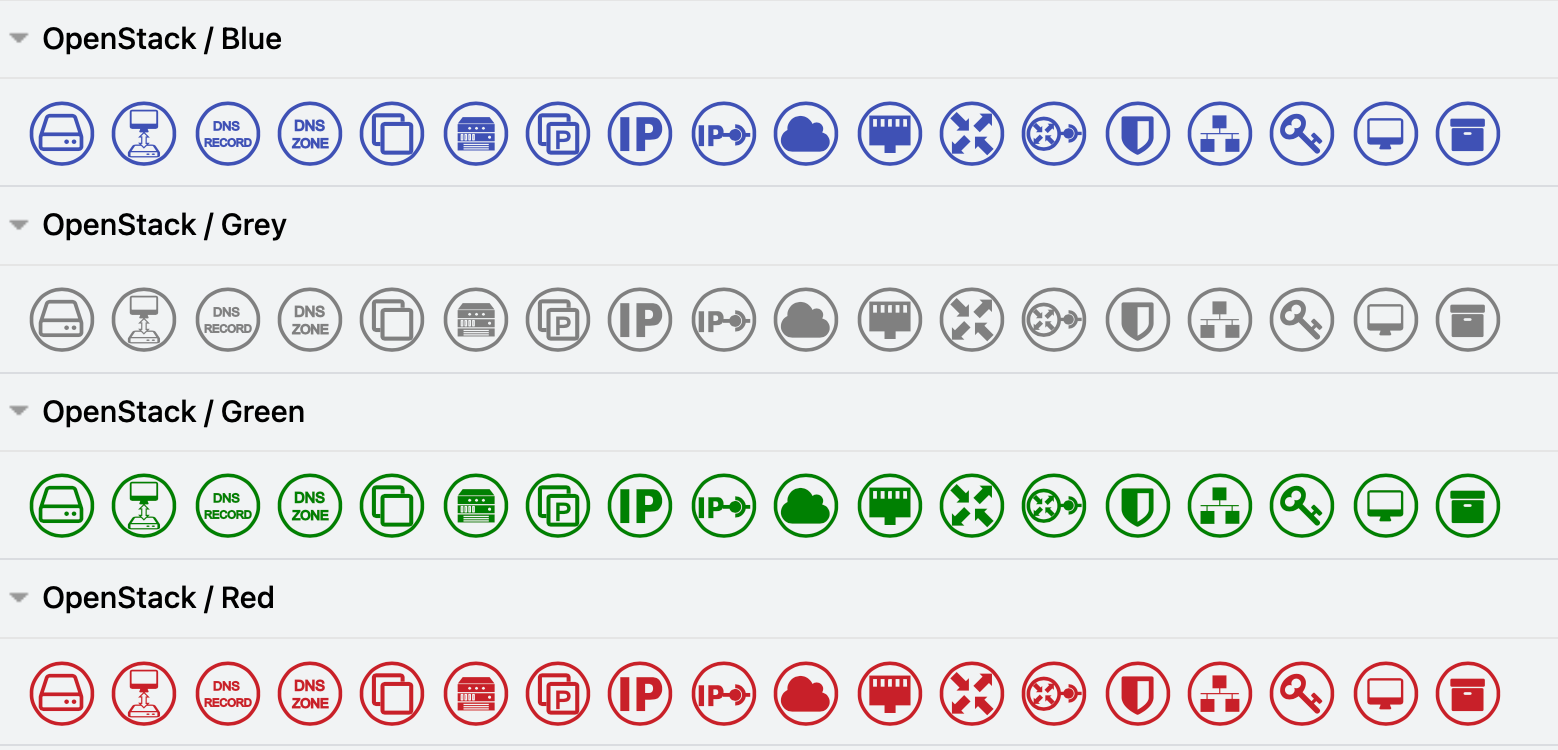
OpenStack shapes= library

OpenStack services and apps are common components of Citrix, GCP, IBM and other large hybrid cloud infrastructures. To clearly indicate which components are provided by OpenStack in your infrastructure diagrams, enable the OpenStack shape library.
Use the OpenStack shapes in your hybrid multi-cloud infrastructure diagrams

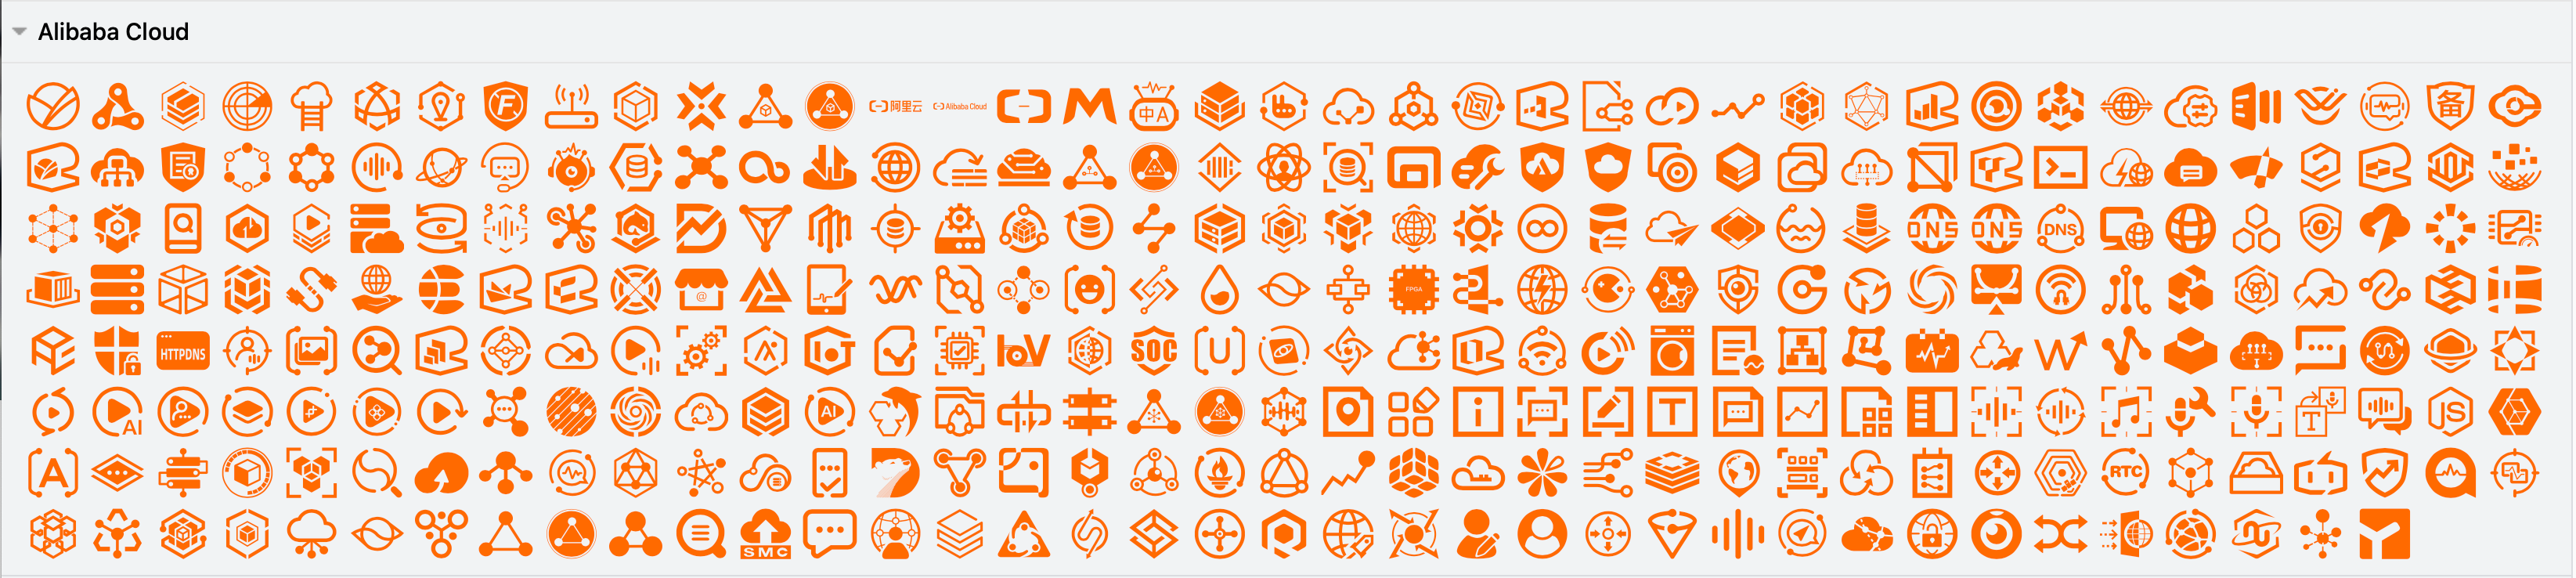
Alibaba Cloud shape library

Enable the Alibaba Cloud shape library to document your infrastructure in Alibaba Cloud platform. These shapes cover a wide range of apps and services.
Use the Alibaba shapes to document your Alibaba Cloud infrastructure

Most of the infrastructure shapes don't have labels by default, as designers tend to rely on logo-recognition for their infrastructure components.
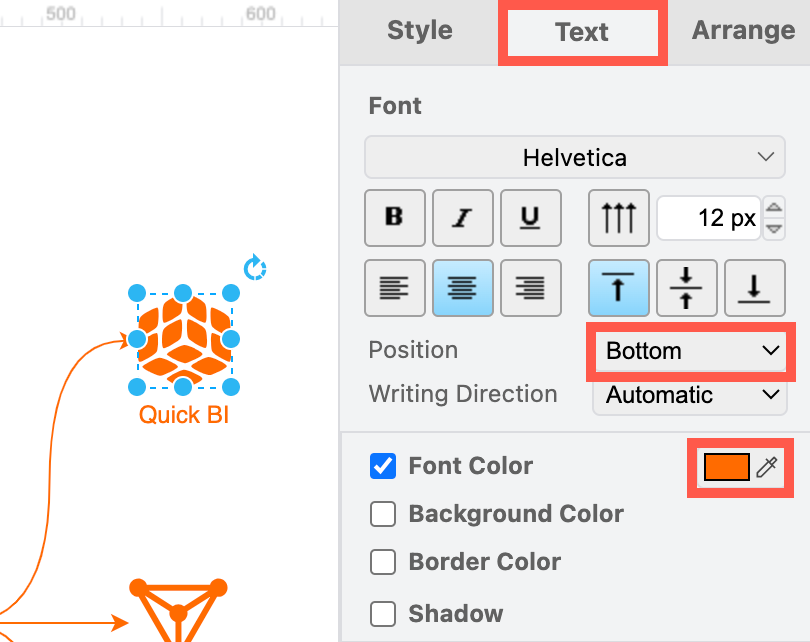
Add and style shape labels so your Alibaba Cloud infrastructure diagram is readable and consistent

To make your diagram more accessible, select a shape and start typing to add a label. In the Text tab of the format panel, select the Bottom position, and update the Font Colour to match the colour of the Alibaba shape so it is consistent.
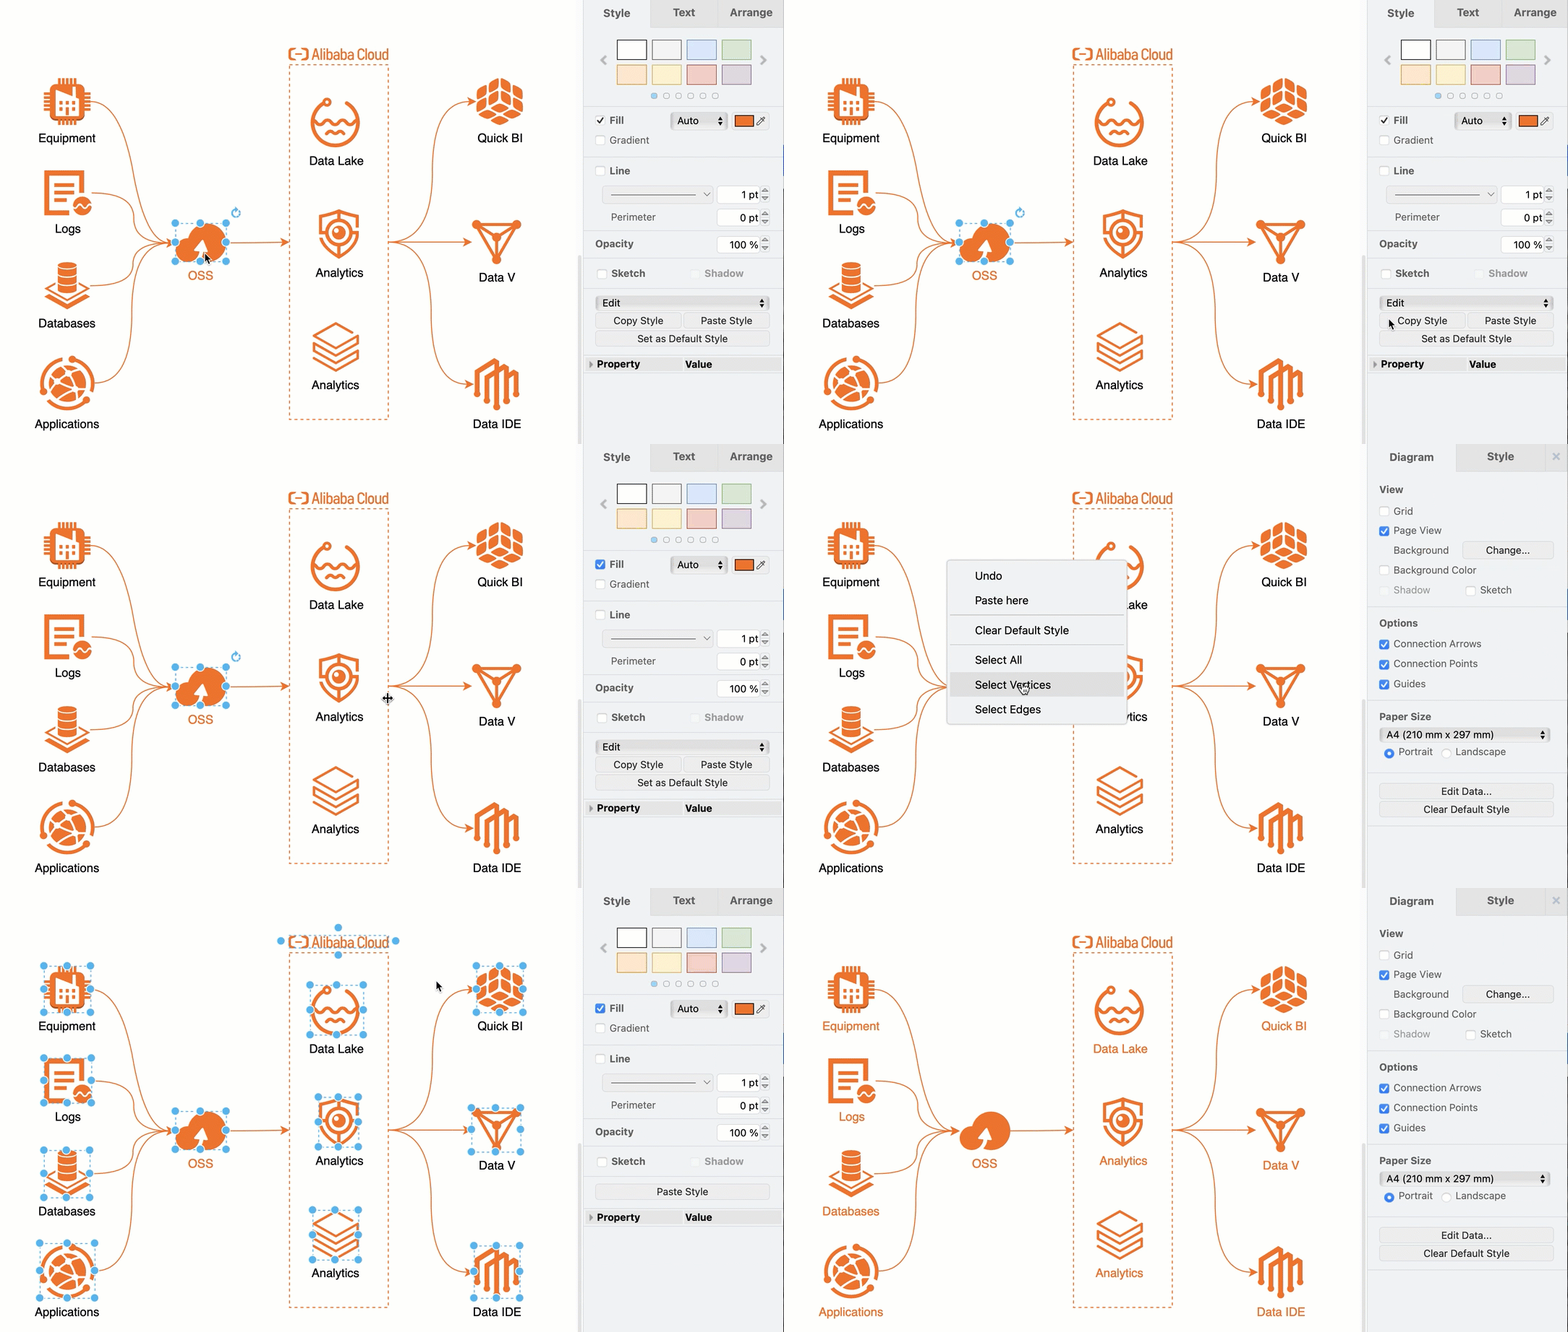
Tip: Format one shape and click on Copy Style in the Style tab of the format panel. Then, right-click on the canvas and choose Select Vertices, deselect any regions you may have added, and then click on Paste Style in the Style tab to copy the style onto all of the selected shapes.
Copy and paste shape styles to make your diagram labels and colours consistent

Learn more about drawing various types of network and infrastructure diagrams.

Other cloud platform shape libraries in draw.io include Salesforce, Citrix, Google GCP, Amazon AWS, IBM, and more.

Export AWS diagrams generated from your actual deployed infrastructure to the .drawio format from Cloudockit and Cloudcraft.

New IBM Cloud shape library for technical diagrams

· 6 min read

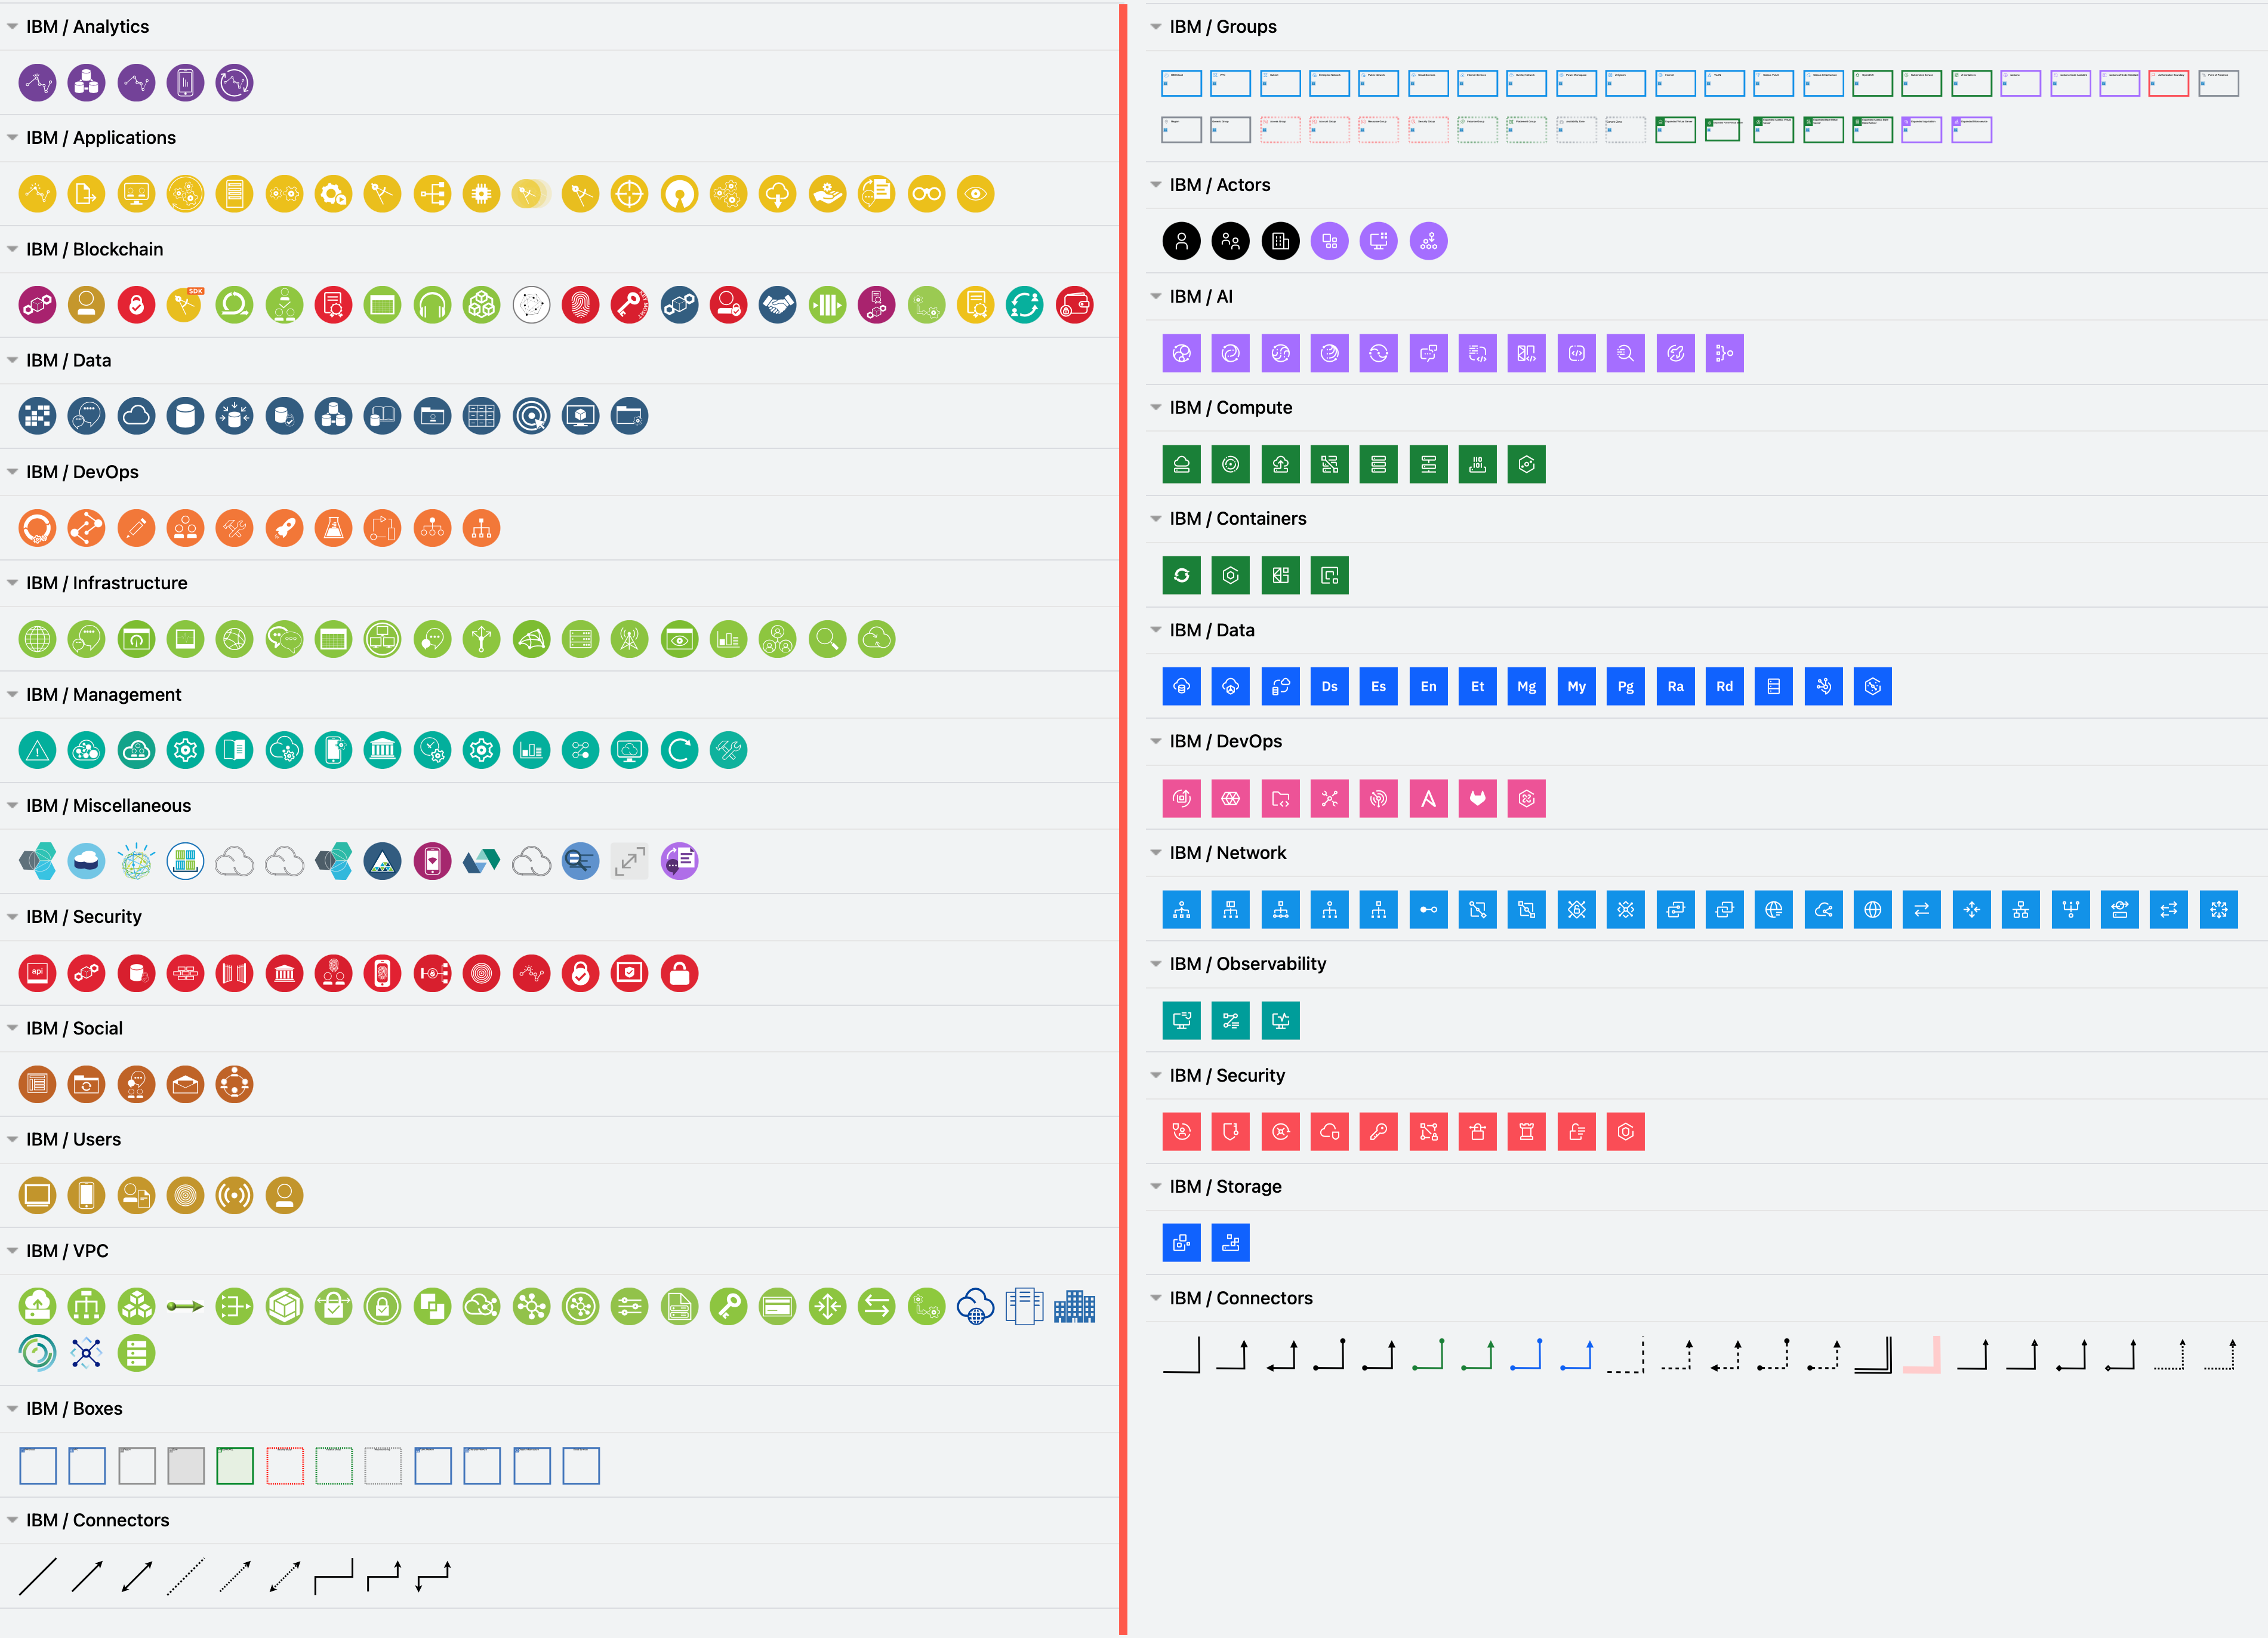
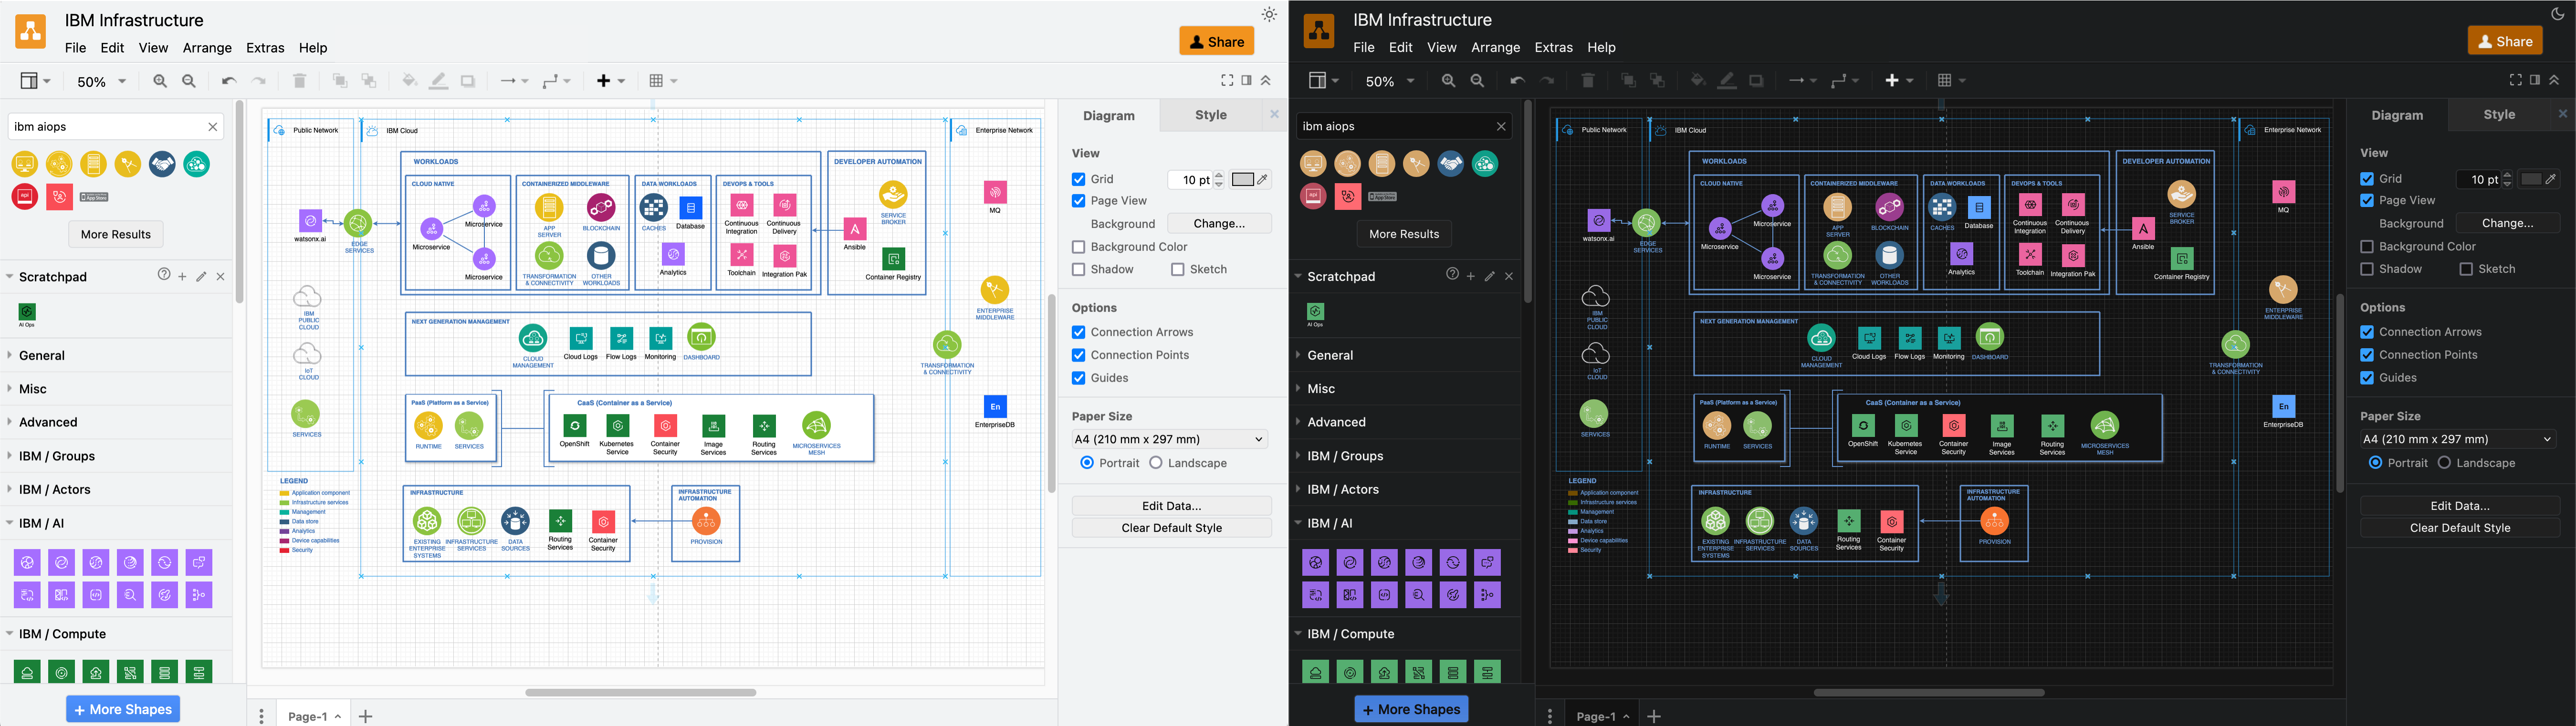
The new IBM Cloud shape library in draw.io (right) reflects IBM's updated design language, and extends the existing IBM shape library (left) with a wide range of additional groups, connectors and infrastructure components.
Enable the new IBM and IBM shape libraries to draw IBM infrastructure diagrams

IBM has provided their updated shapes for the new IBM Cloud shape library in draw.io. Please refer to their documentation for their design language style guide, where they explain how shapes and icons should be used in a wide variety of technical diagrams.

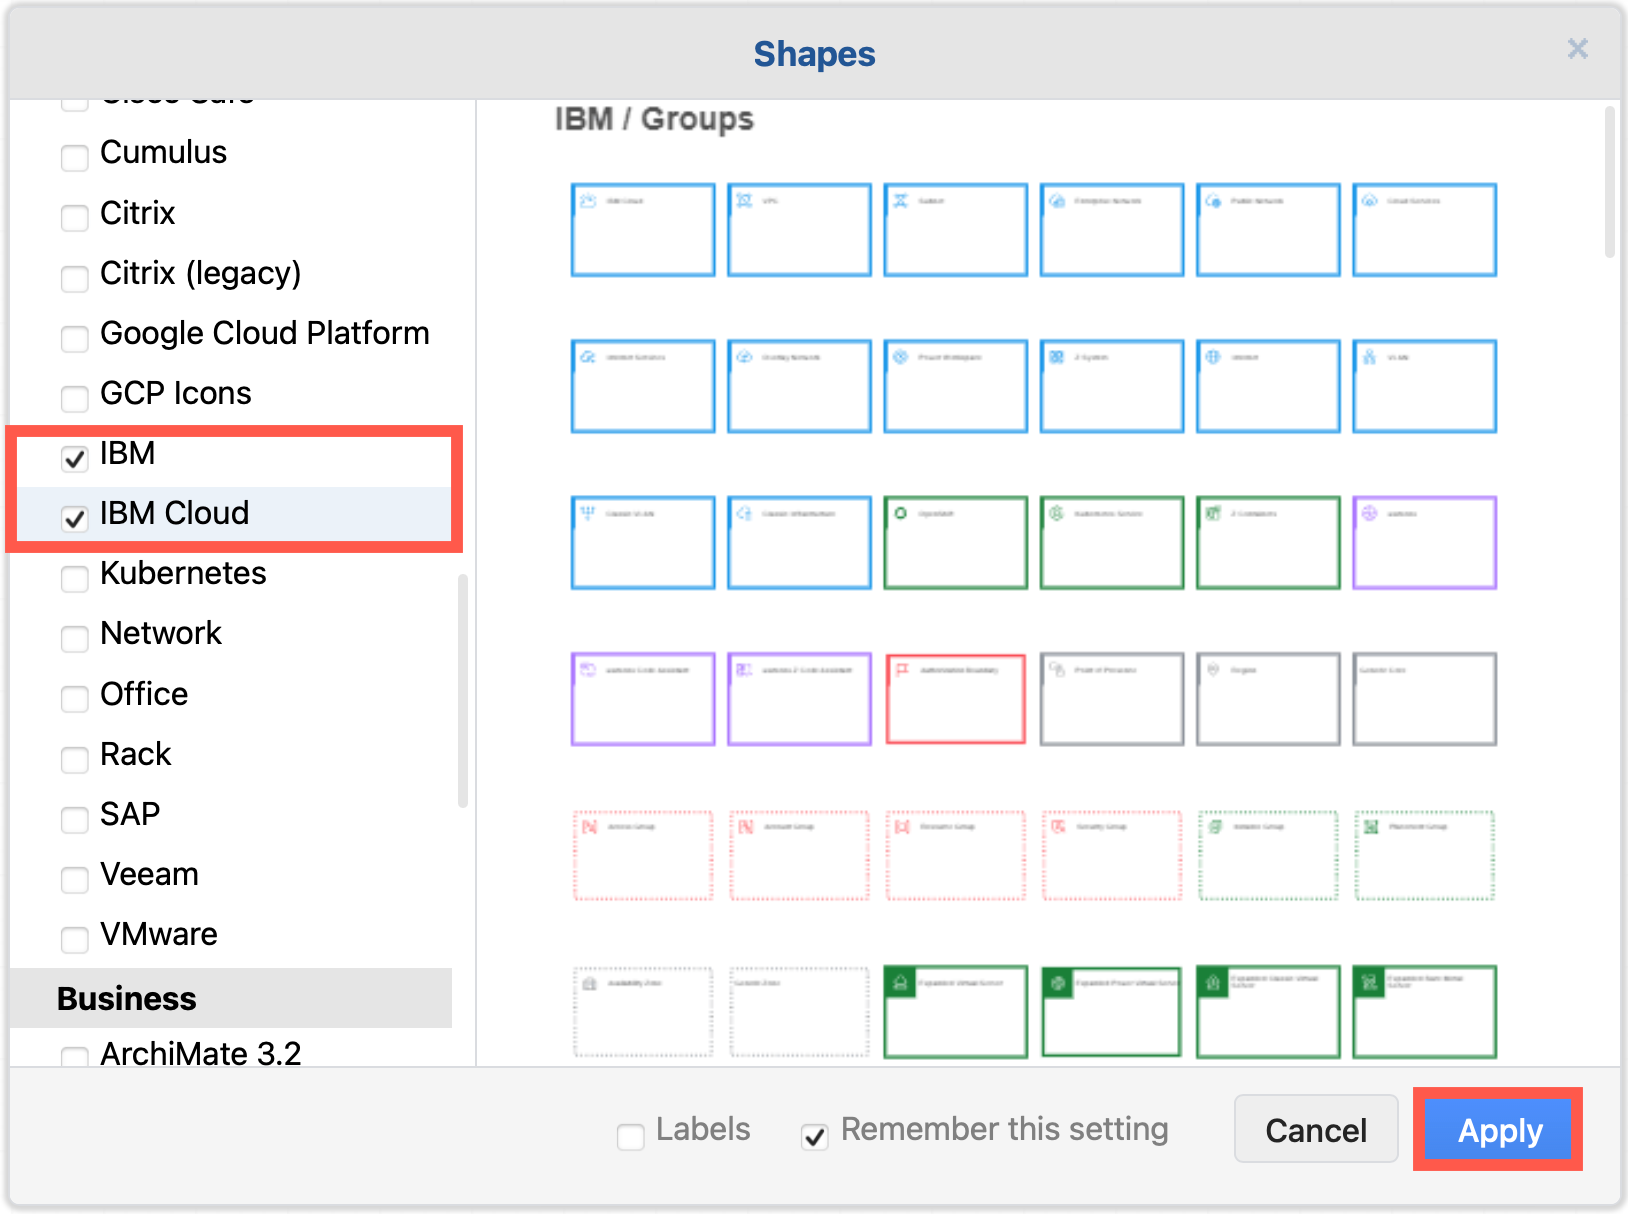
Enable the IBM shape libraries in draw.io

  1. Click on More Shapes at the bottom of the shapes panel in draw.io.
  2. Enable the checkbox next to the SAP shape library in the Networking section and click Apply.
    Enable the IBM shape libraries to draw IBM infrastructure diagrams

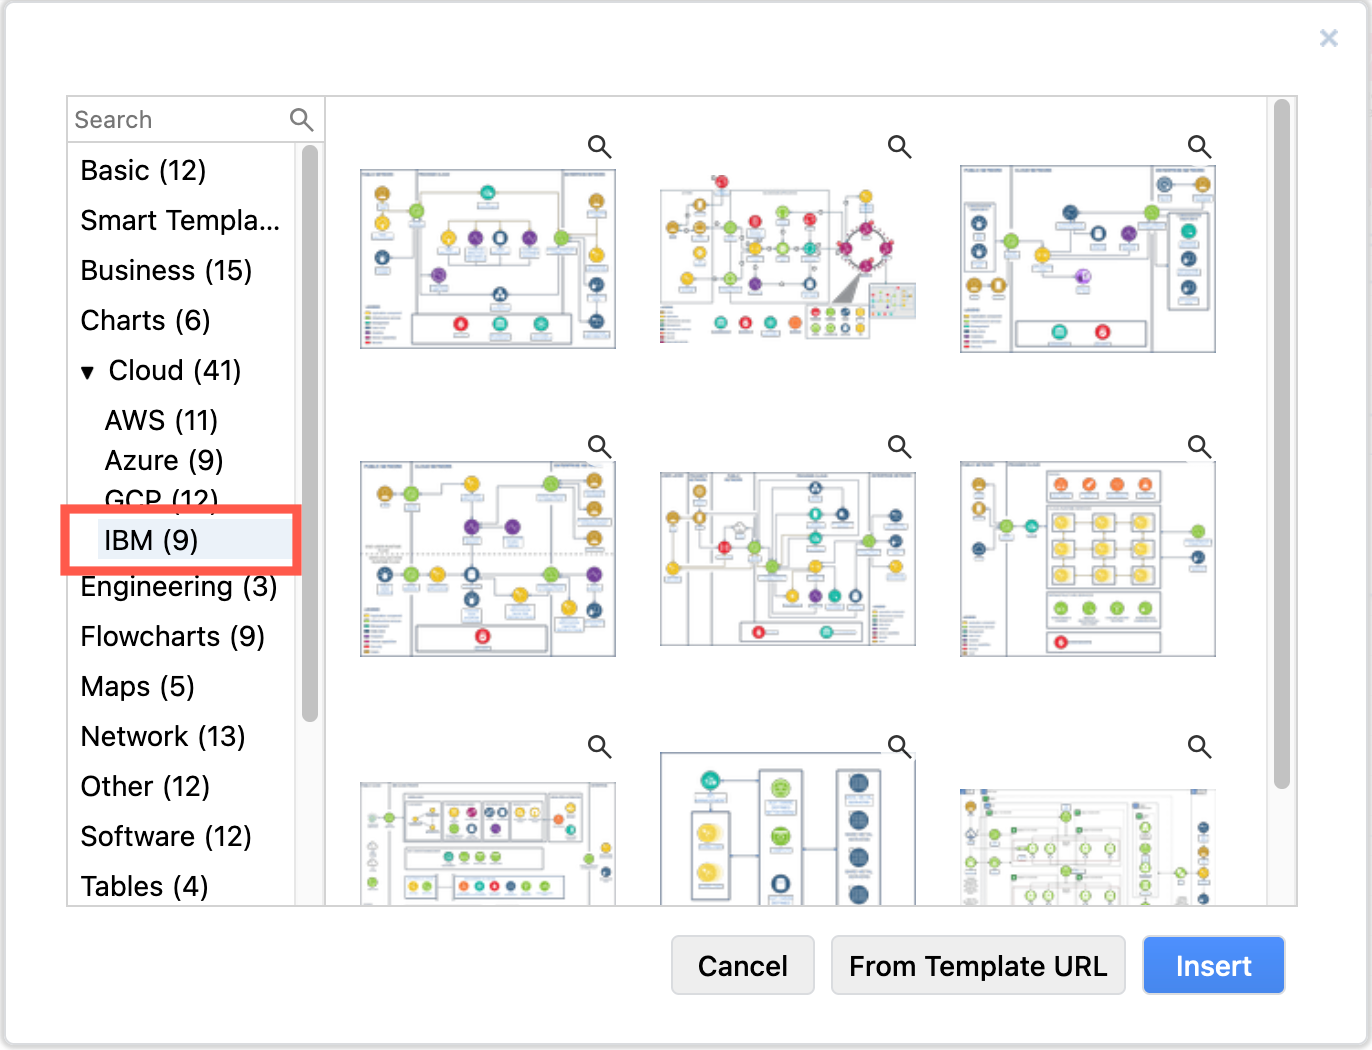
Tip: There are also several IBM infrastructures in the template library. Select Arrange > Insert > Template from the menu or + > Template in the toolbar, and look in the Cloud > IBM category.
draw.io has several example IBM infrastructures in the template library

Using old and new IBM shapes in one diagram

The new IBM Cloud shapes are compound shapes - a coloured background shape and an icon on top in the centre. This gives you more flexibility in styling your diagram as you can change the two shapes' fill colours independently.

The older shapes are round with a white icon and blue text label, while the new IBM Cloud shapes are square with a white icon and text (in light mode) or black icon and text (in dark mode).

There is also a larger and more varied set of groups (region shapes) in the new IBM Cloud shape library.
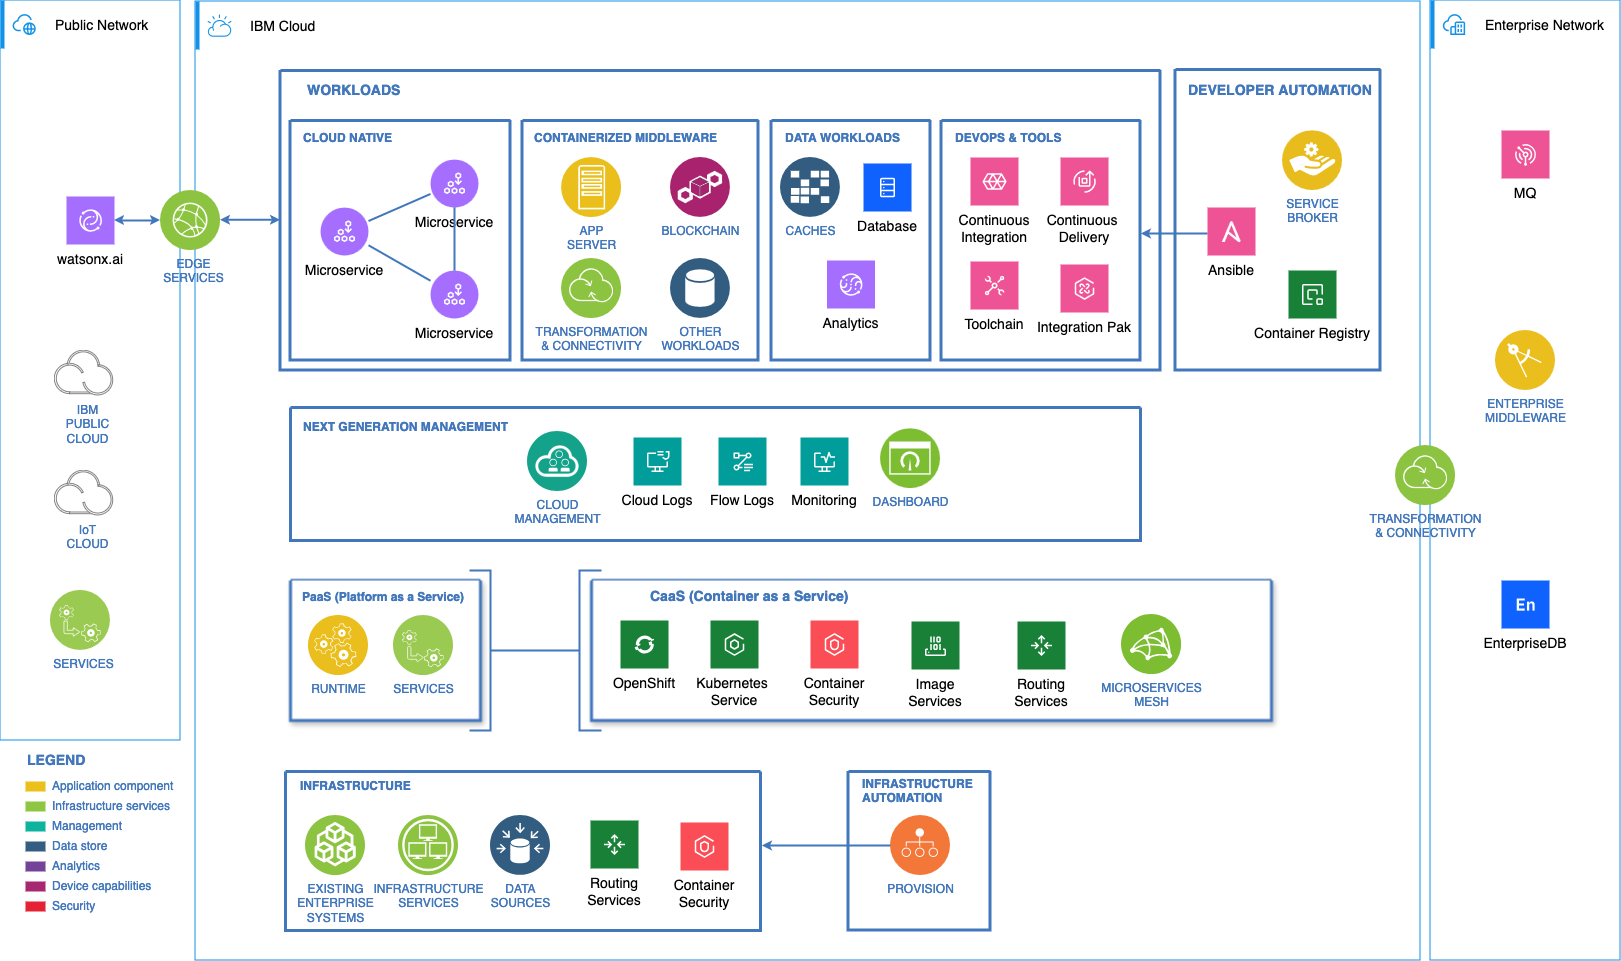
The new IBM Cloud shapes work well with the older IBM shape library in draw.io
The example above is one of the IBM templates available in draw.io with the new IBM Cloud shapes replacing some older components.

Both sets of shapes work well when diagramming in dark mode - the new shapes will switch icon and label colours automatically to remain readable.
The new IBM Cloud shapes automatically swap colours to remain readable in dark and light mode in draw.io

Tip: To make the labels look the same on all of your IBM and IBM Cloud shapes, you'll need to edit the text labels to ensure their case matches and the Font Color in the Text tab of the format panel.

However, mixing shapes from the two shape libraries and using their default label styles shows which components of your infrastructure are more recent at a glance, such as for IBM's newer cloud and Watson AI services.

Make your own IBM shapes

The shapes in both the IBM and IBM Cloud shape libraries represent only part of the constantly expanding IBM Design Language.

You can easily make your own IBM shapes in draw.io using the black IBM .svg icons.

  1. Add one of the IBM Cloud shapes that matches the colour you want to use to the drawing canvas to serve as a template for your new shape.
  2. Add a simple rectangle from the General shape library.
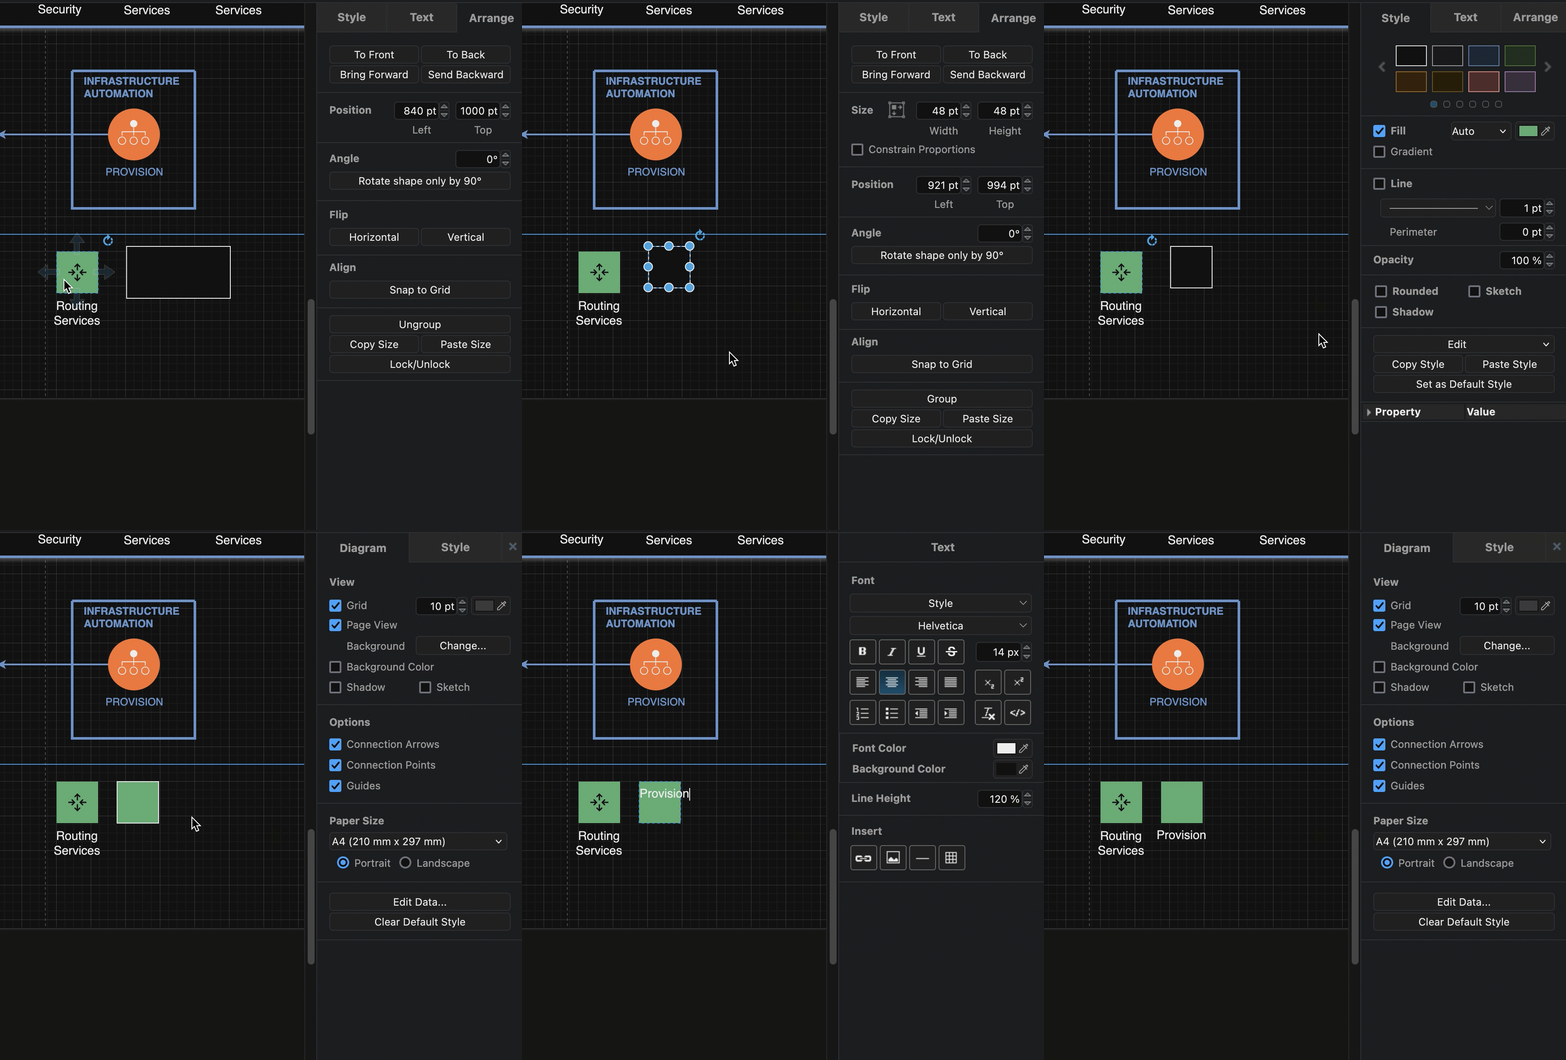
  3. Select the IBM Cloud shape on the drawing canvas and select then select Copy Size in the Arrange tab of the format panel. Select the rectangle and click on Paste Size.
  4. Select the IBM Cloud shape again, then select Copy Style in the Style tab of the format panel. Select the rectangle again and click on Paste Style.
    Make your own IBM shape using an existing IBM Cloud shape as a template for style and size
  5. You may need to deselect the Line checkbox in the Style tab, but your shape background should now look correct.
  6. Add a label, and move its Position to the Bottom via the Text tab of the format panel.
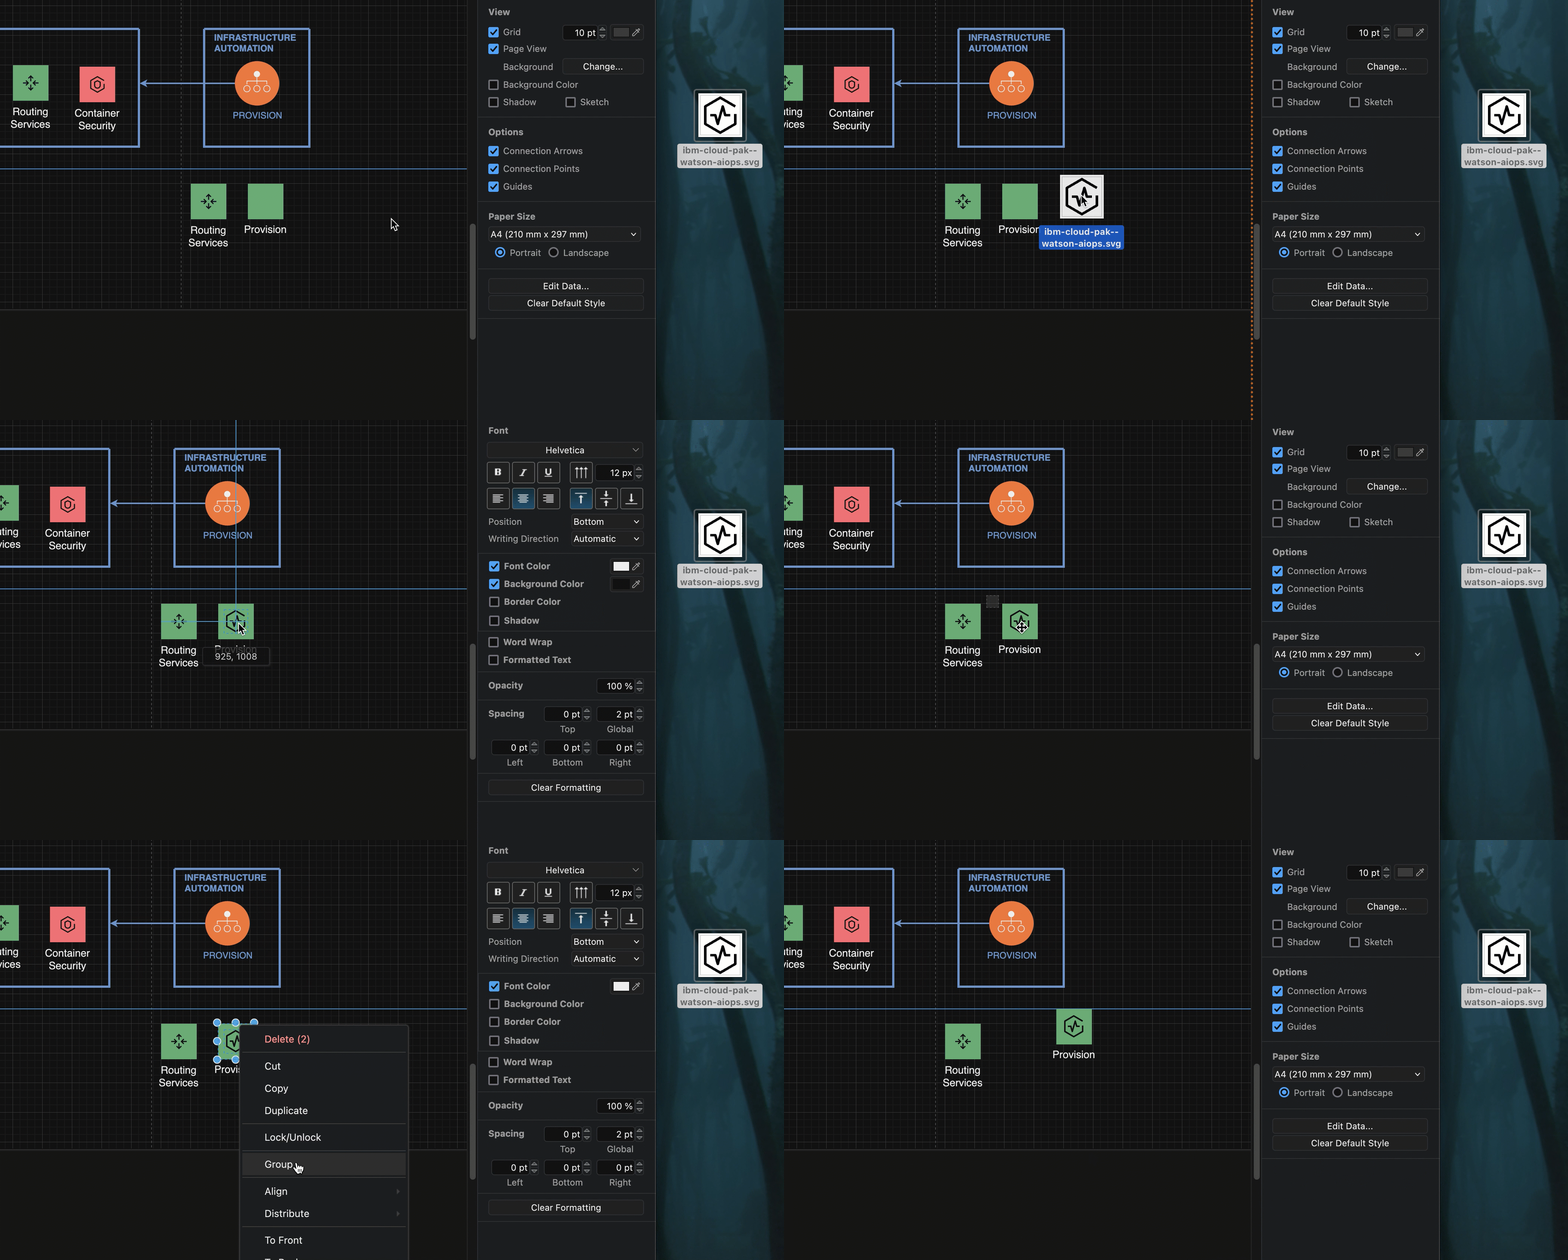
  7. Now, make the compound icon. Drag the .svg file of the UI icon from the UI Icons list in the IBM Design Language - either from the webpage directly, or from your device - onto the drawing canvas to import it. Then drag it over the centre of the background square.
  8. Finally, drag a selection box around the new compound shape, right click and select Group from the context menu.
    Make your own IBM shape using an existing IBM Cloud shape as a template for style and size

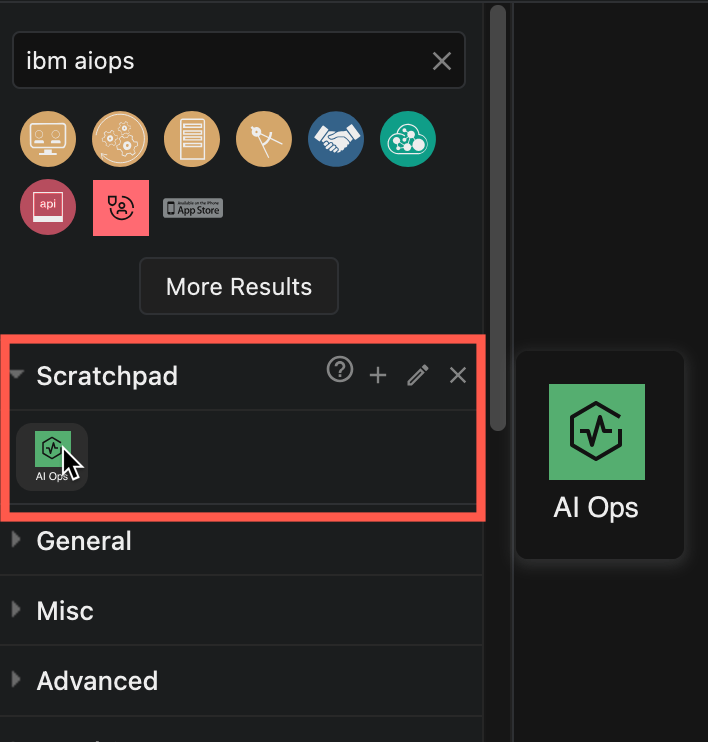
Tip: To use this new shape in multiple diagrams, drag the group onto the Scratchpad in the shapes panel.
Make your own IBM shape and save it in the draw.io scratchpad

You can also save the Scratchpad with your custom shapes to share them with your colleagues.

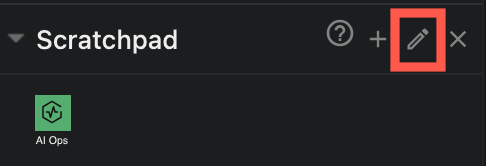
  1. Click on the pencil to the right of the Scratchpad library.
    Edit the draw.io scratchpad and export the shapes in it to a custom shape library
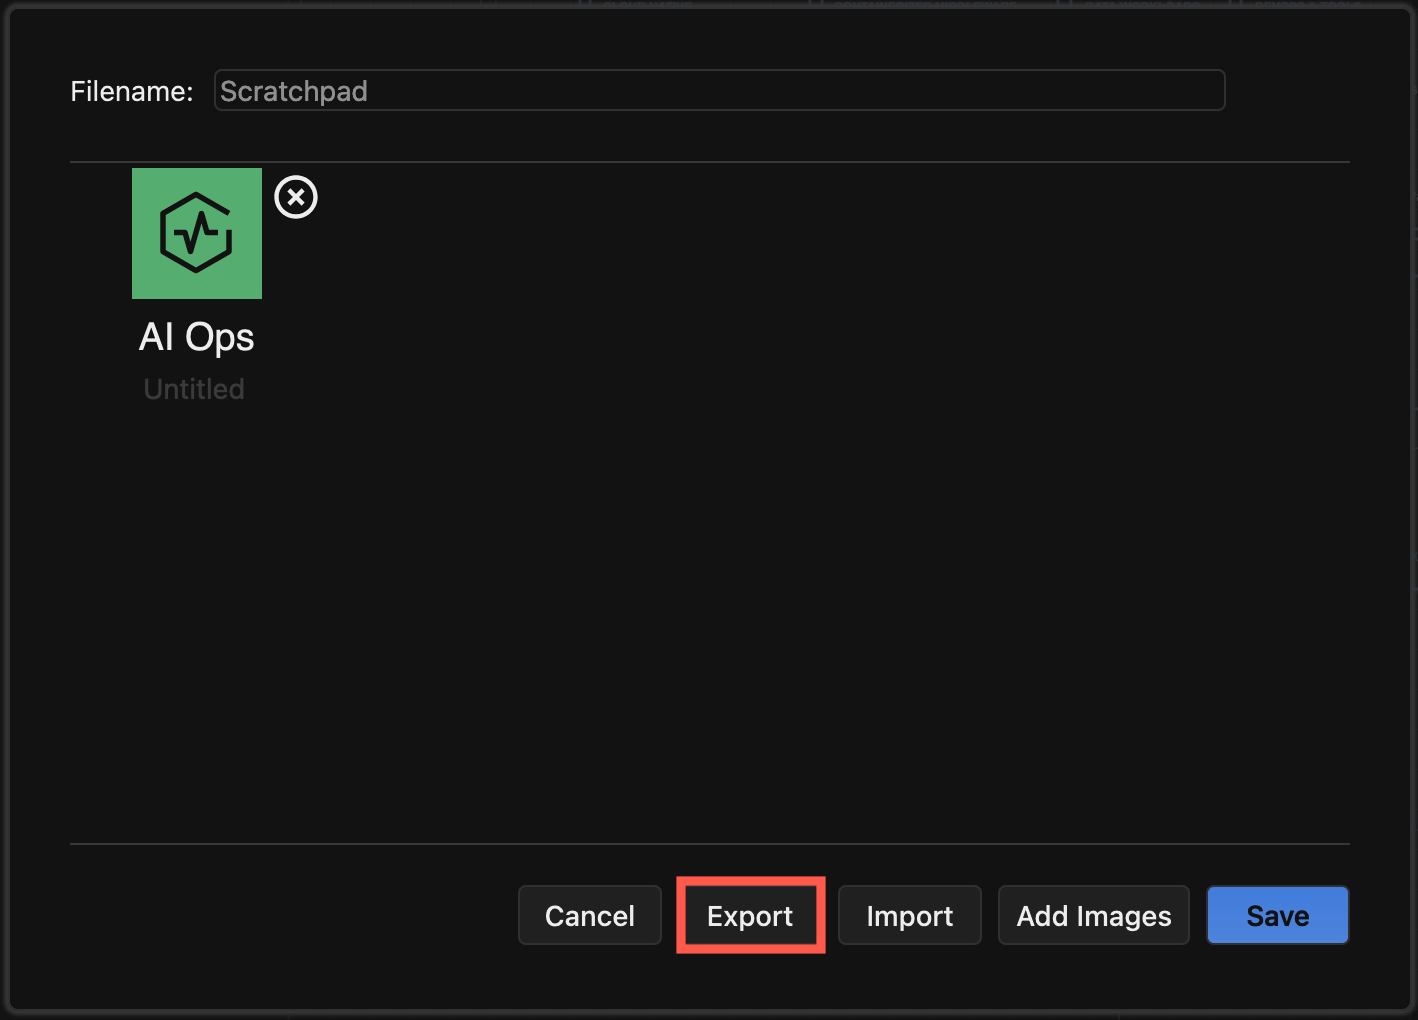
  2. Select Export to save all the shapes in the Scratchpad to a custom shape library.
    Edit the draw.io scratchpad and export the shapes in it to a custom shape library
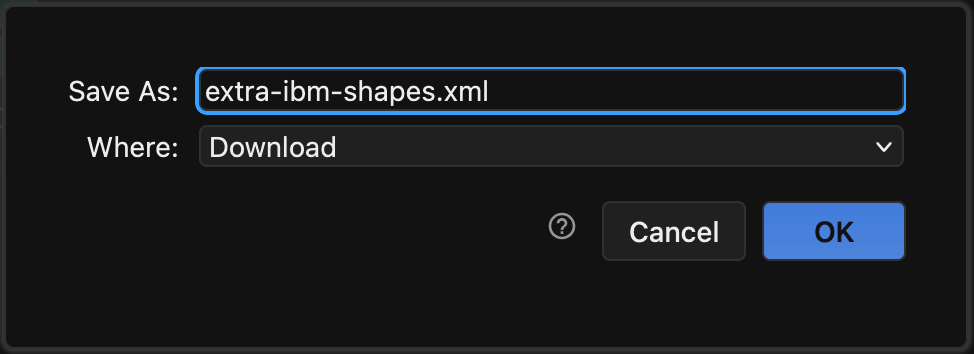
  3. Enter a filename, select where to save the custom shape library file and click OK.
    Edit the draw.io scratchpad and export the shapes in it to a custom shape library

Learn more about custom shape libraries

Align connectors easily with a waypoint shape

· 4 min read

In any diagram with branches - trees and org charts, Ishikawa diagrams, wiring diagrams, and even some flow charts - you will have multiple overlapping connectors attached to the parent shape. Using a waypoint shape between connectors will prevent manual alignment frustration when you move the parent or child shapes.
A waypoint shape will make your tree connectors neater

The waypoint shape

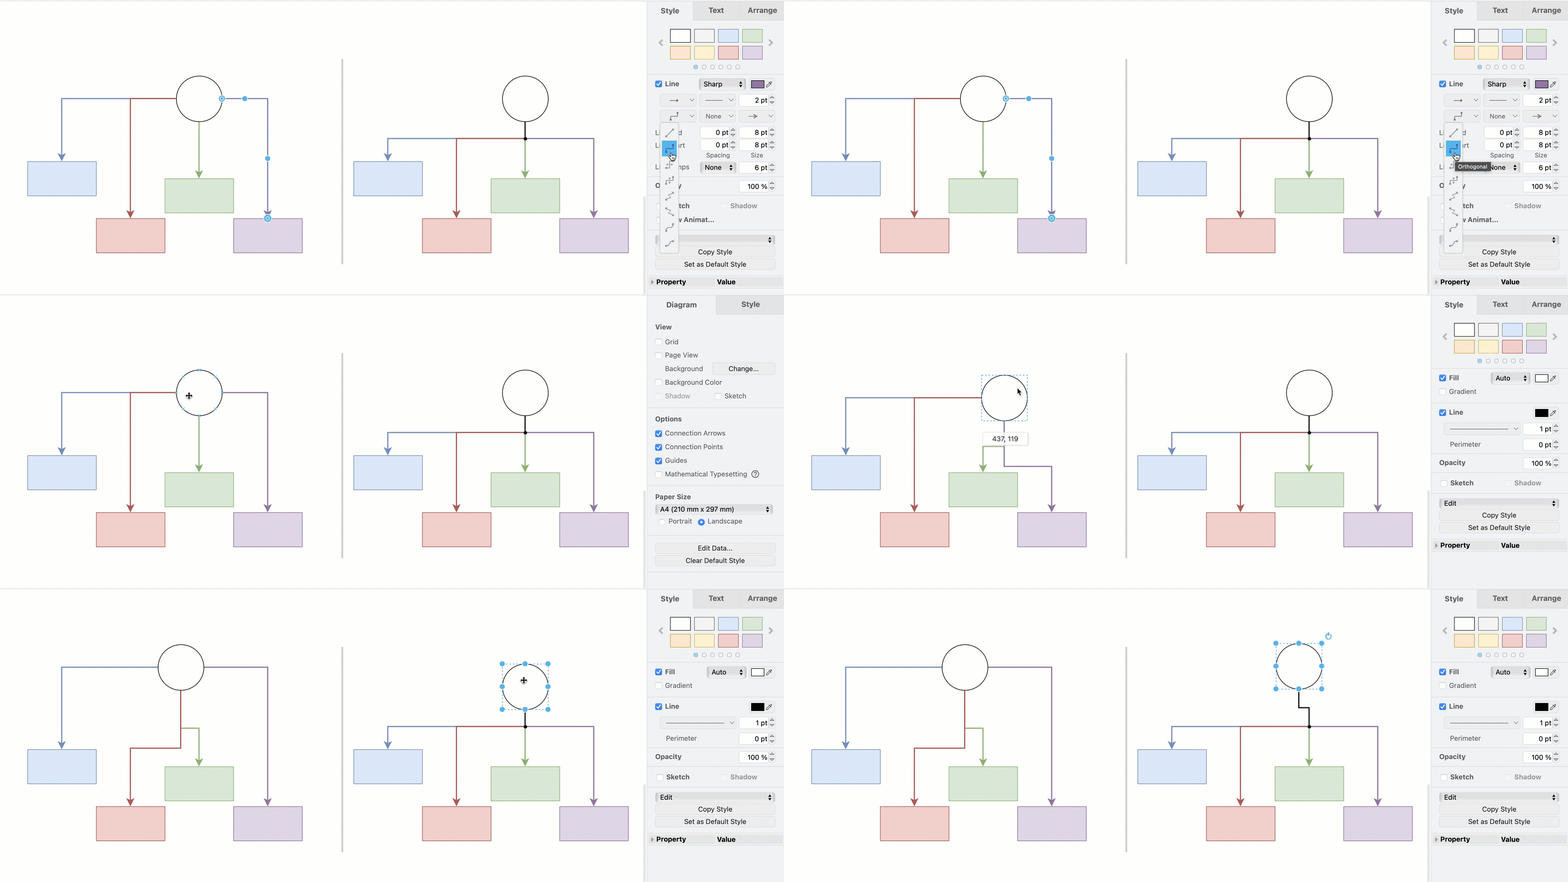
The Waypoint shape is in the Misc shape library, which is a subcategory in the General shape library.
The waypoint shape is available in the shape library

If you are going to use the waypoint shape or any other shape often, add it to the scratchpad so you can find it easily.

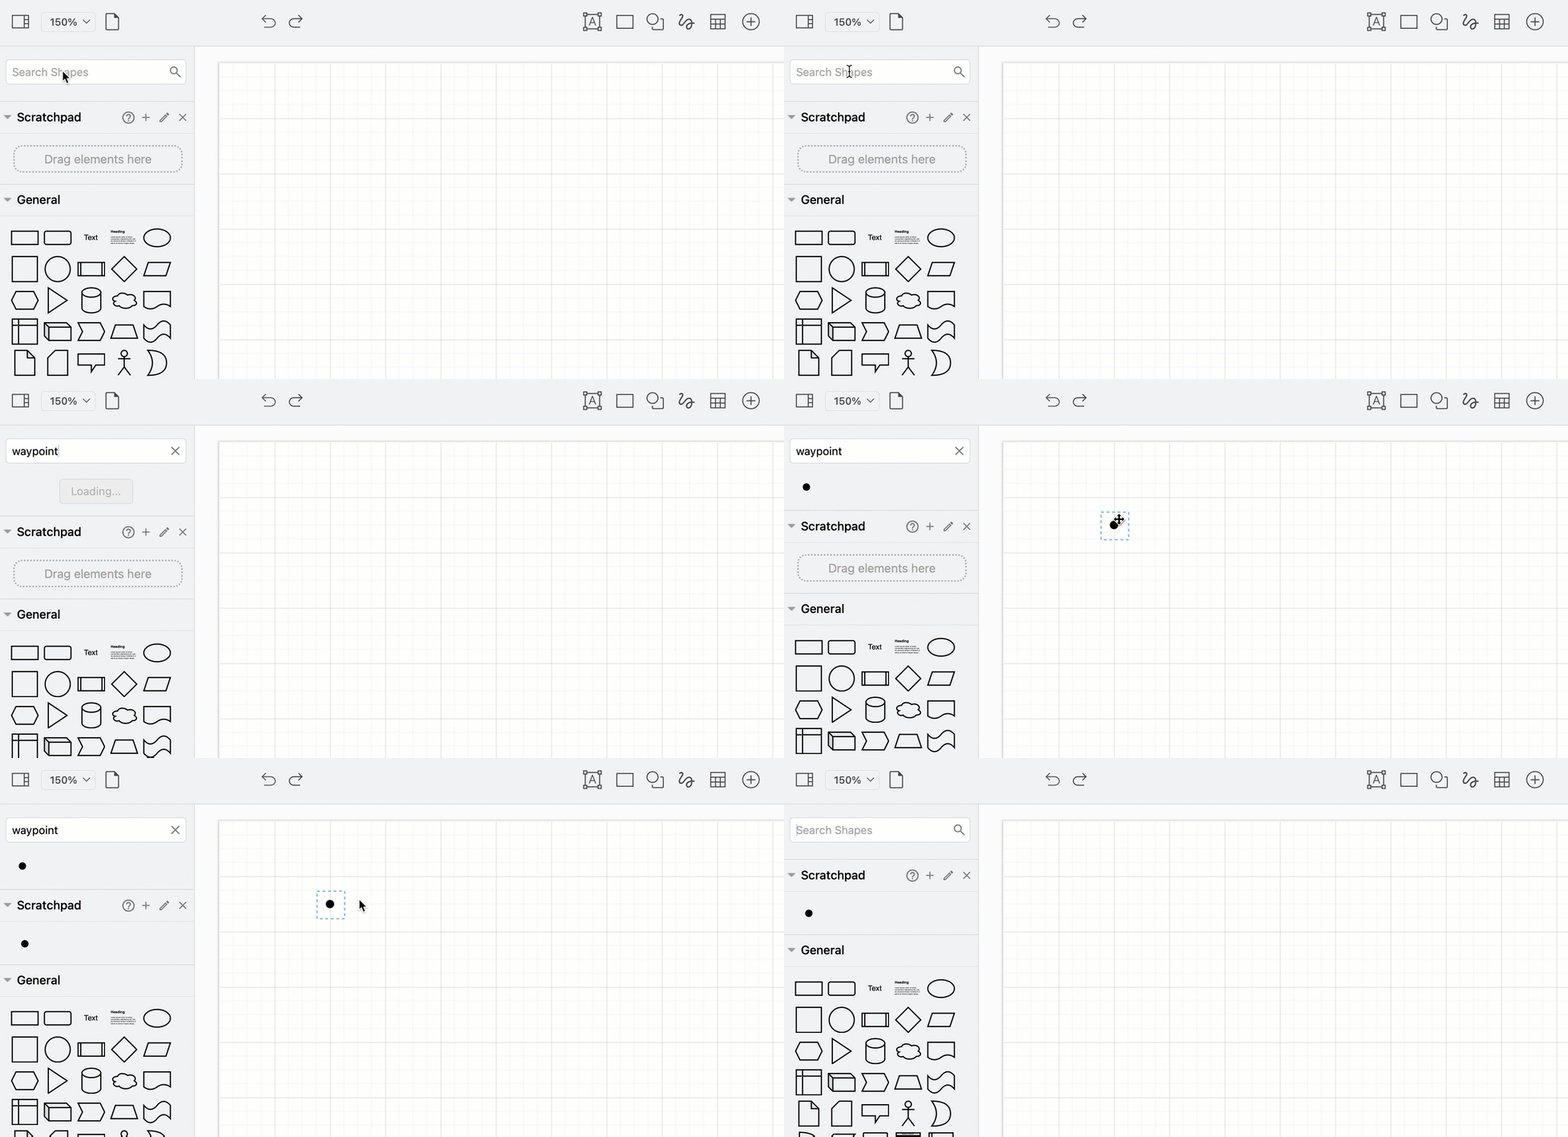
  1. Search for waypoint in the shape panel.
  2. Add this Waypoint shape to the canvas.
  3. Drag it back onto the Scratchpad in the shape panel - by putting in the Scratchpad, you won't have to go search for it.
    If you are going to use a shape often, like this waypoint shape, drag one from the drawing canvas to the scratchpad for easy access

Faster and neater diagrams

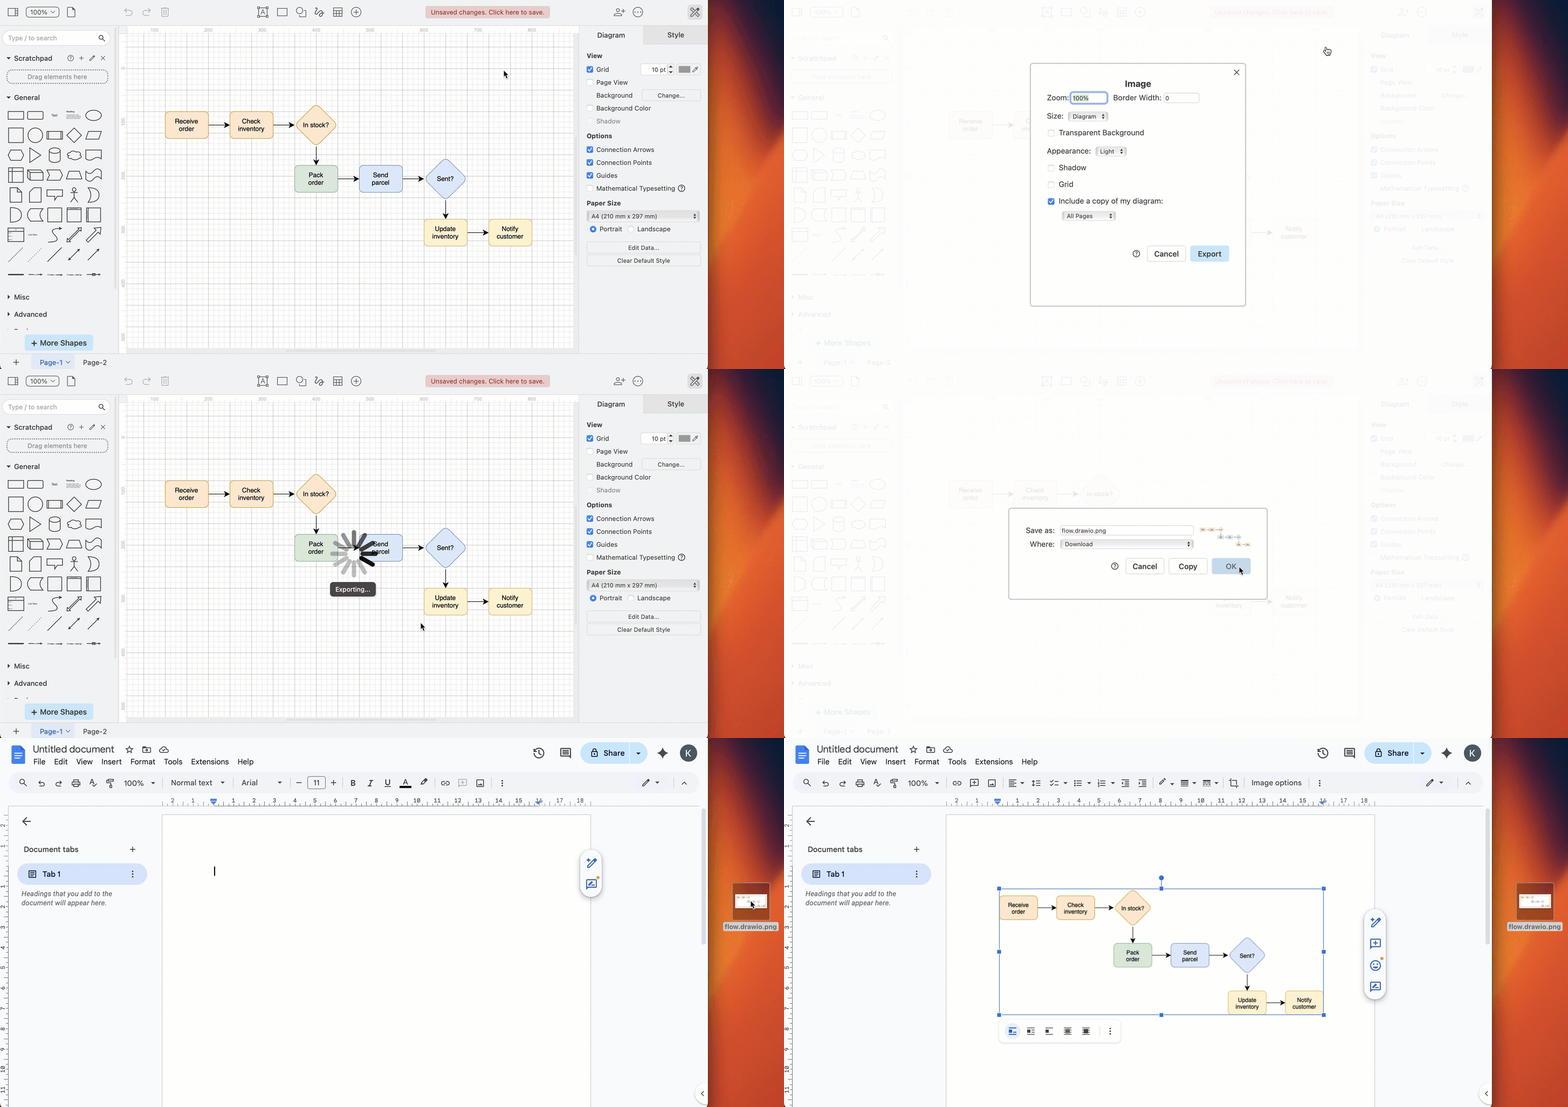
Tree diagrams, org charts and flowcharts look great with neat orthogonal connectors - lines with aligned vertical and horizontal bends. These connections look best when 'tied together' where multiple connectors attach to a single parent shape, instead of overlapping.

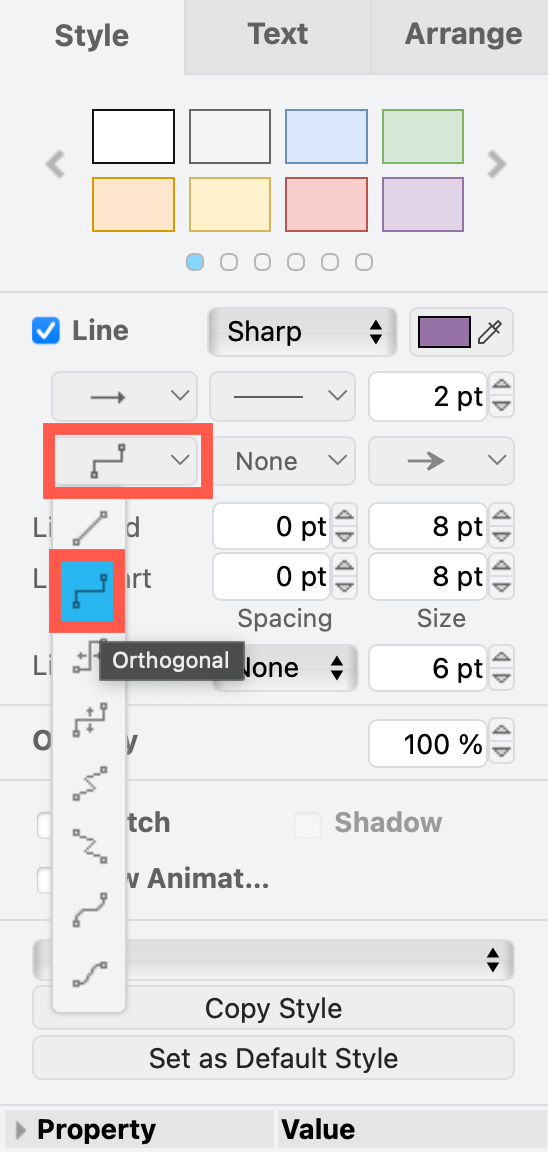
Select one or more connectors and choose Orthogonal (or Vertical or Horizontal) from the Waypoints drop down list in the Style tab of the format panel.
Orthogonal connectors are ideal for neat trees, graphs and flowcharts

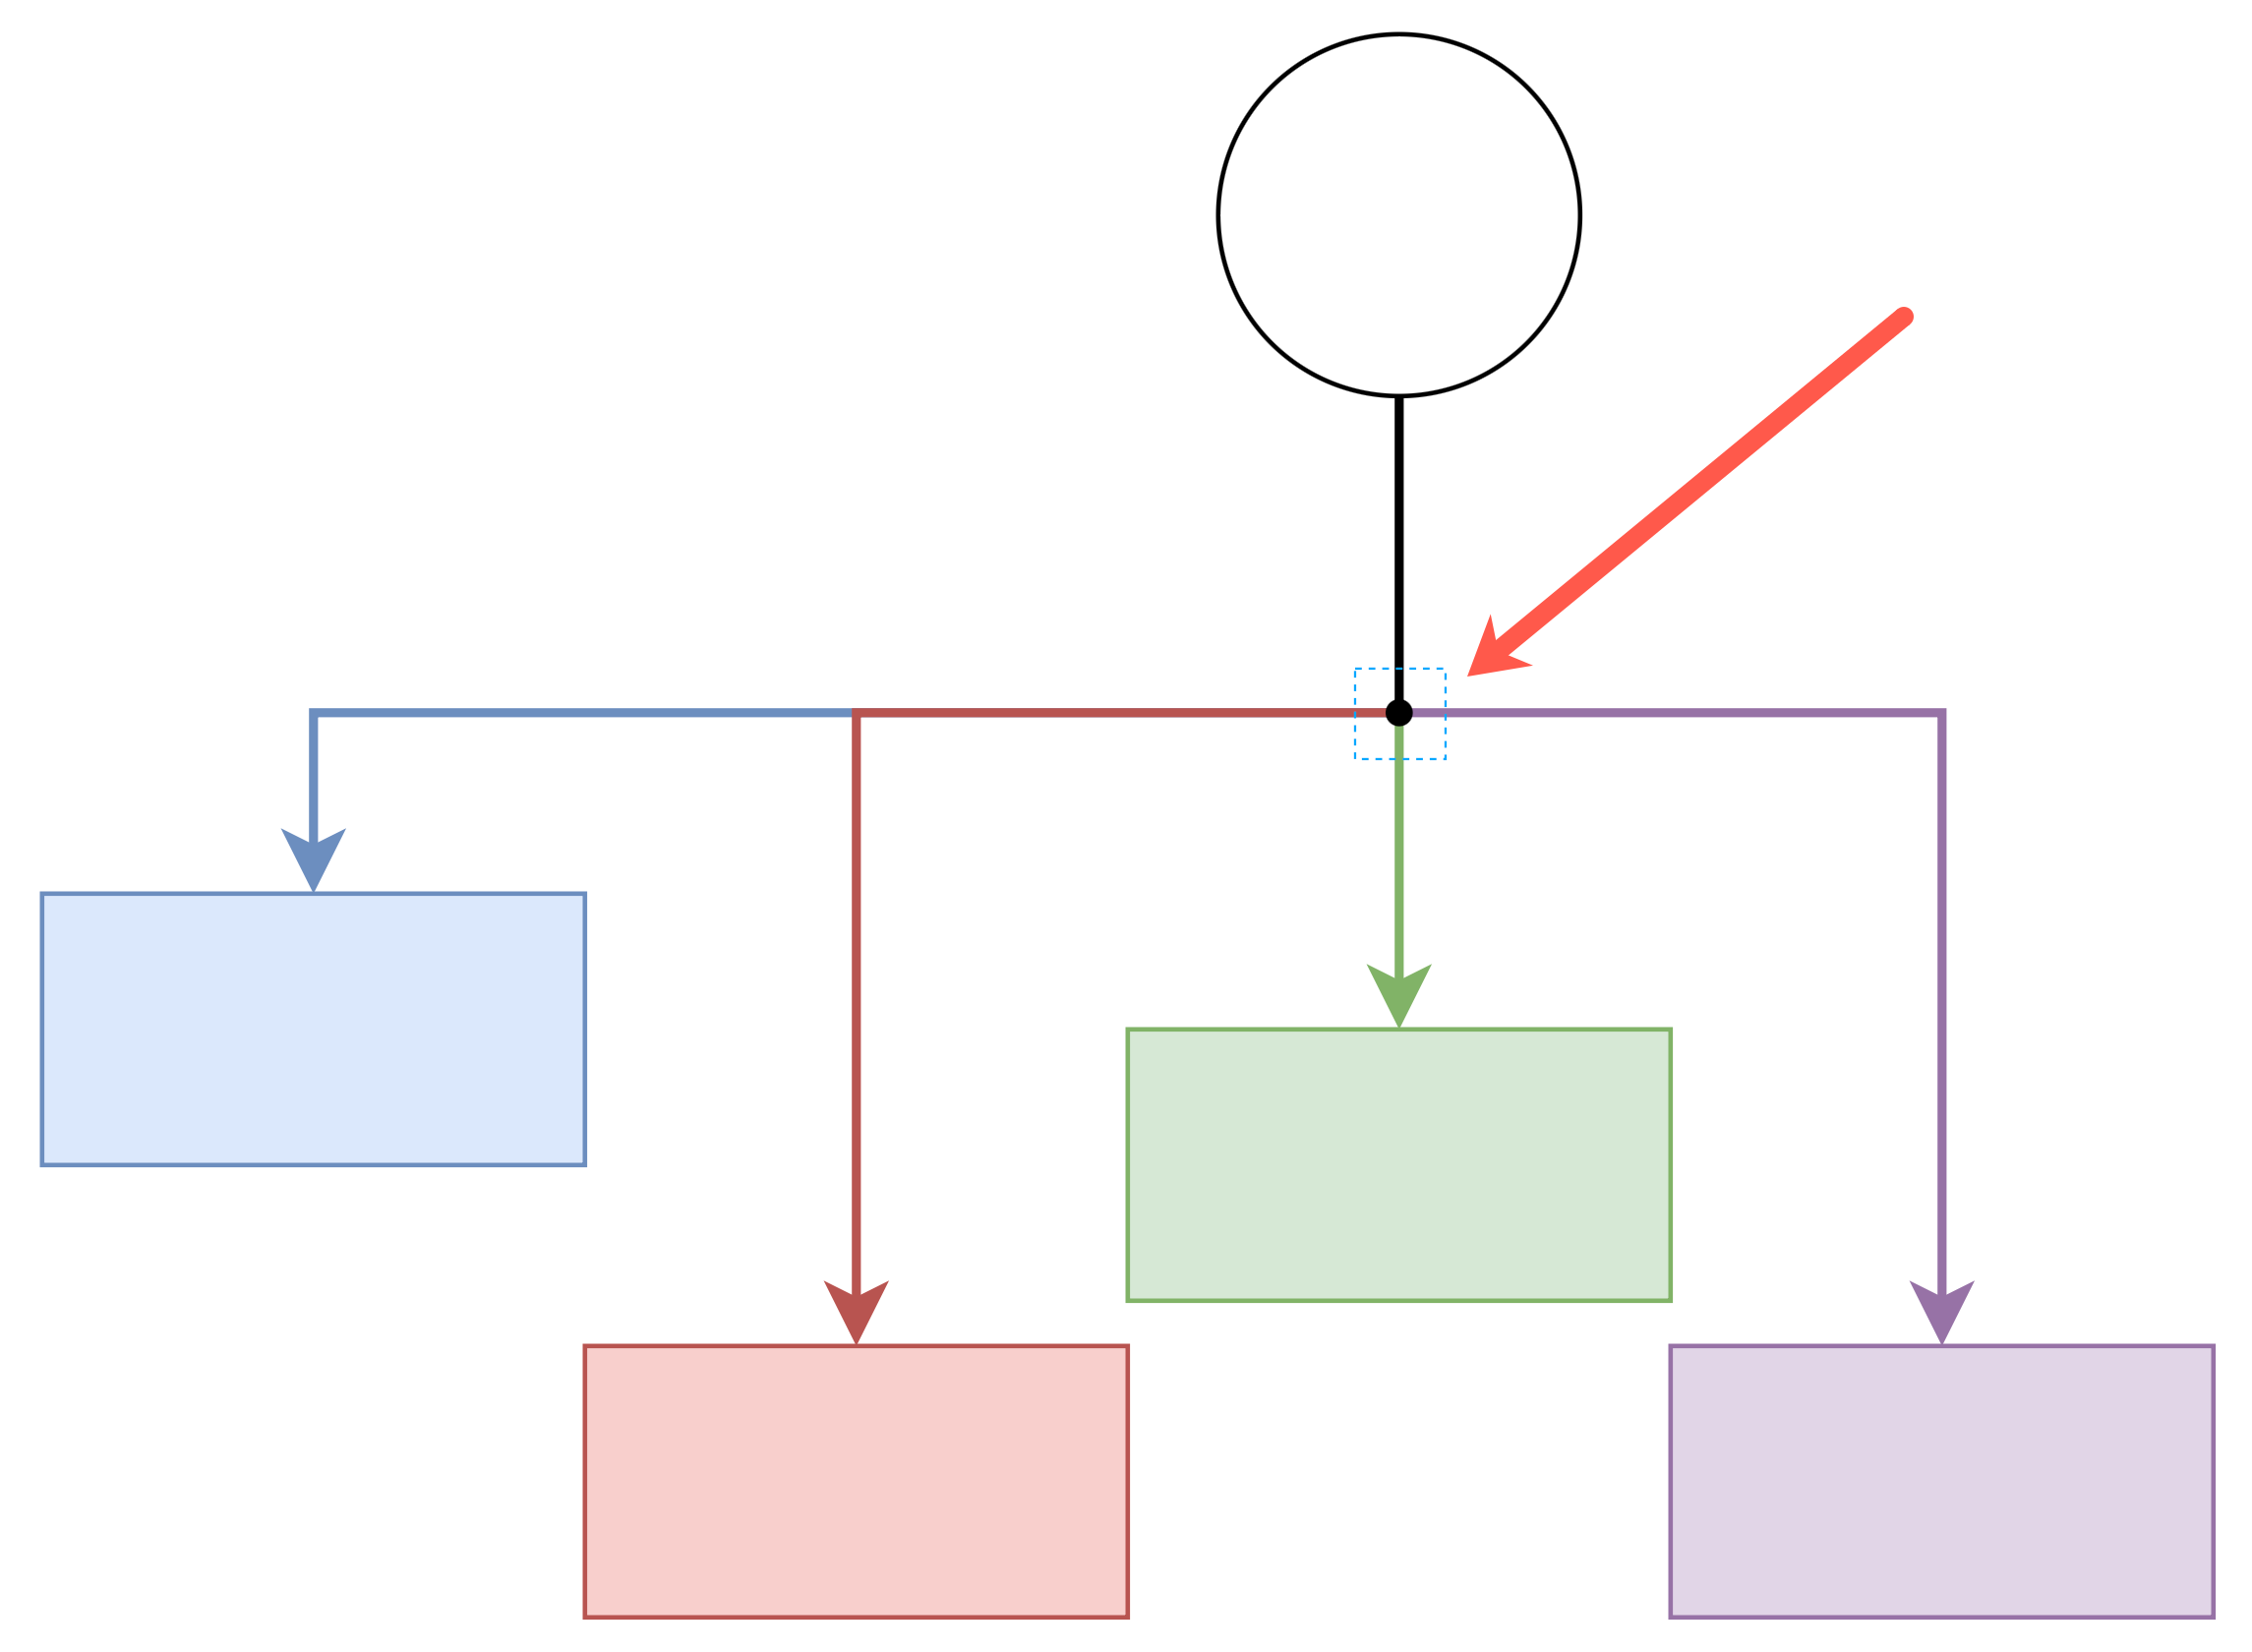
Place a waypoint shape in between the parent shape and the child shapes at the spot where the connectors would neatly separate. Then drag a connector from the parent shape to the waypoint shape. And drag connectors from the waypoint shape to each of the child shapes.
Place the waypoint shape between the parent and child shapes at the spot where the connectors neatly separate

draw.io automatically repositions connectors as you move shapes around the drawing canvas, especially if you use floating connectors. Waypoint shapes help you keep your connector alignment neat.
A waypoint shape will make your tree connectors neater

Hide the waypoint shape

While it is useful to see the waypoint shape in some diagrams, such as electrical wiring diagrams, you may want to hide it in tree diagrams and org charts.

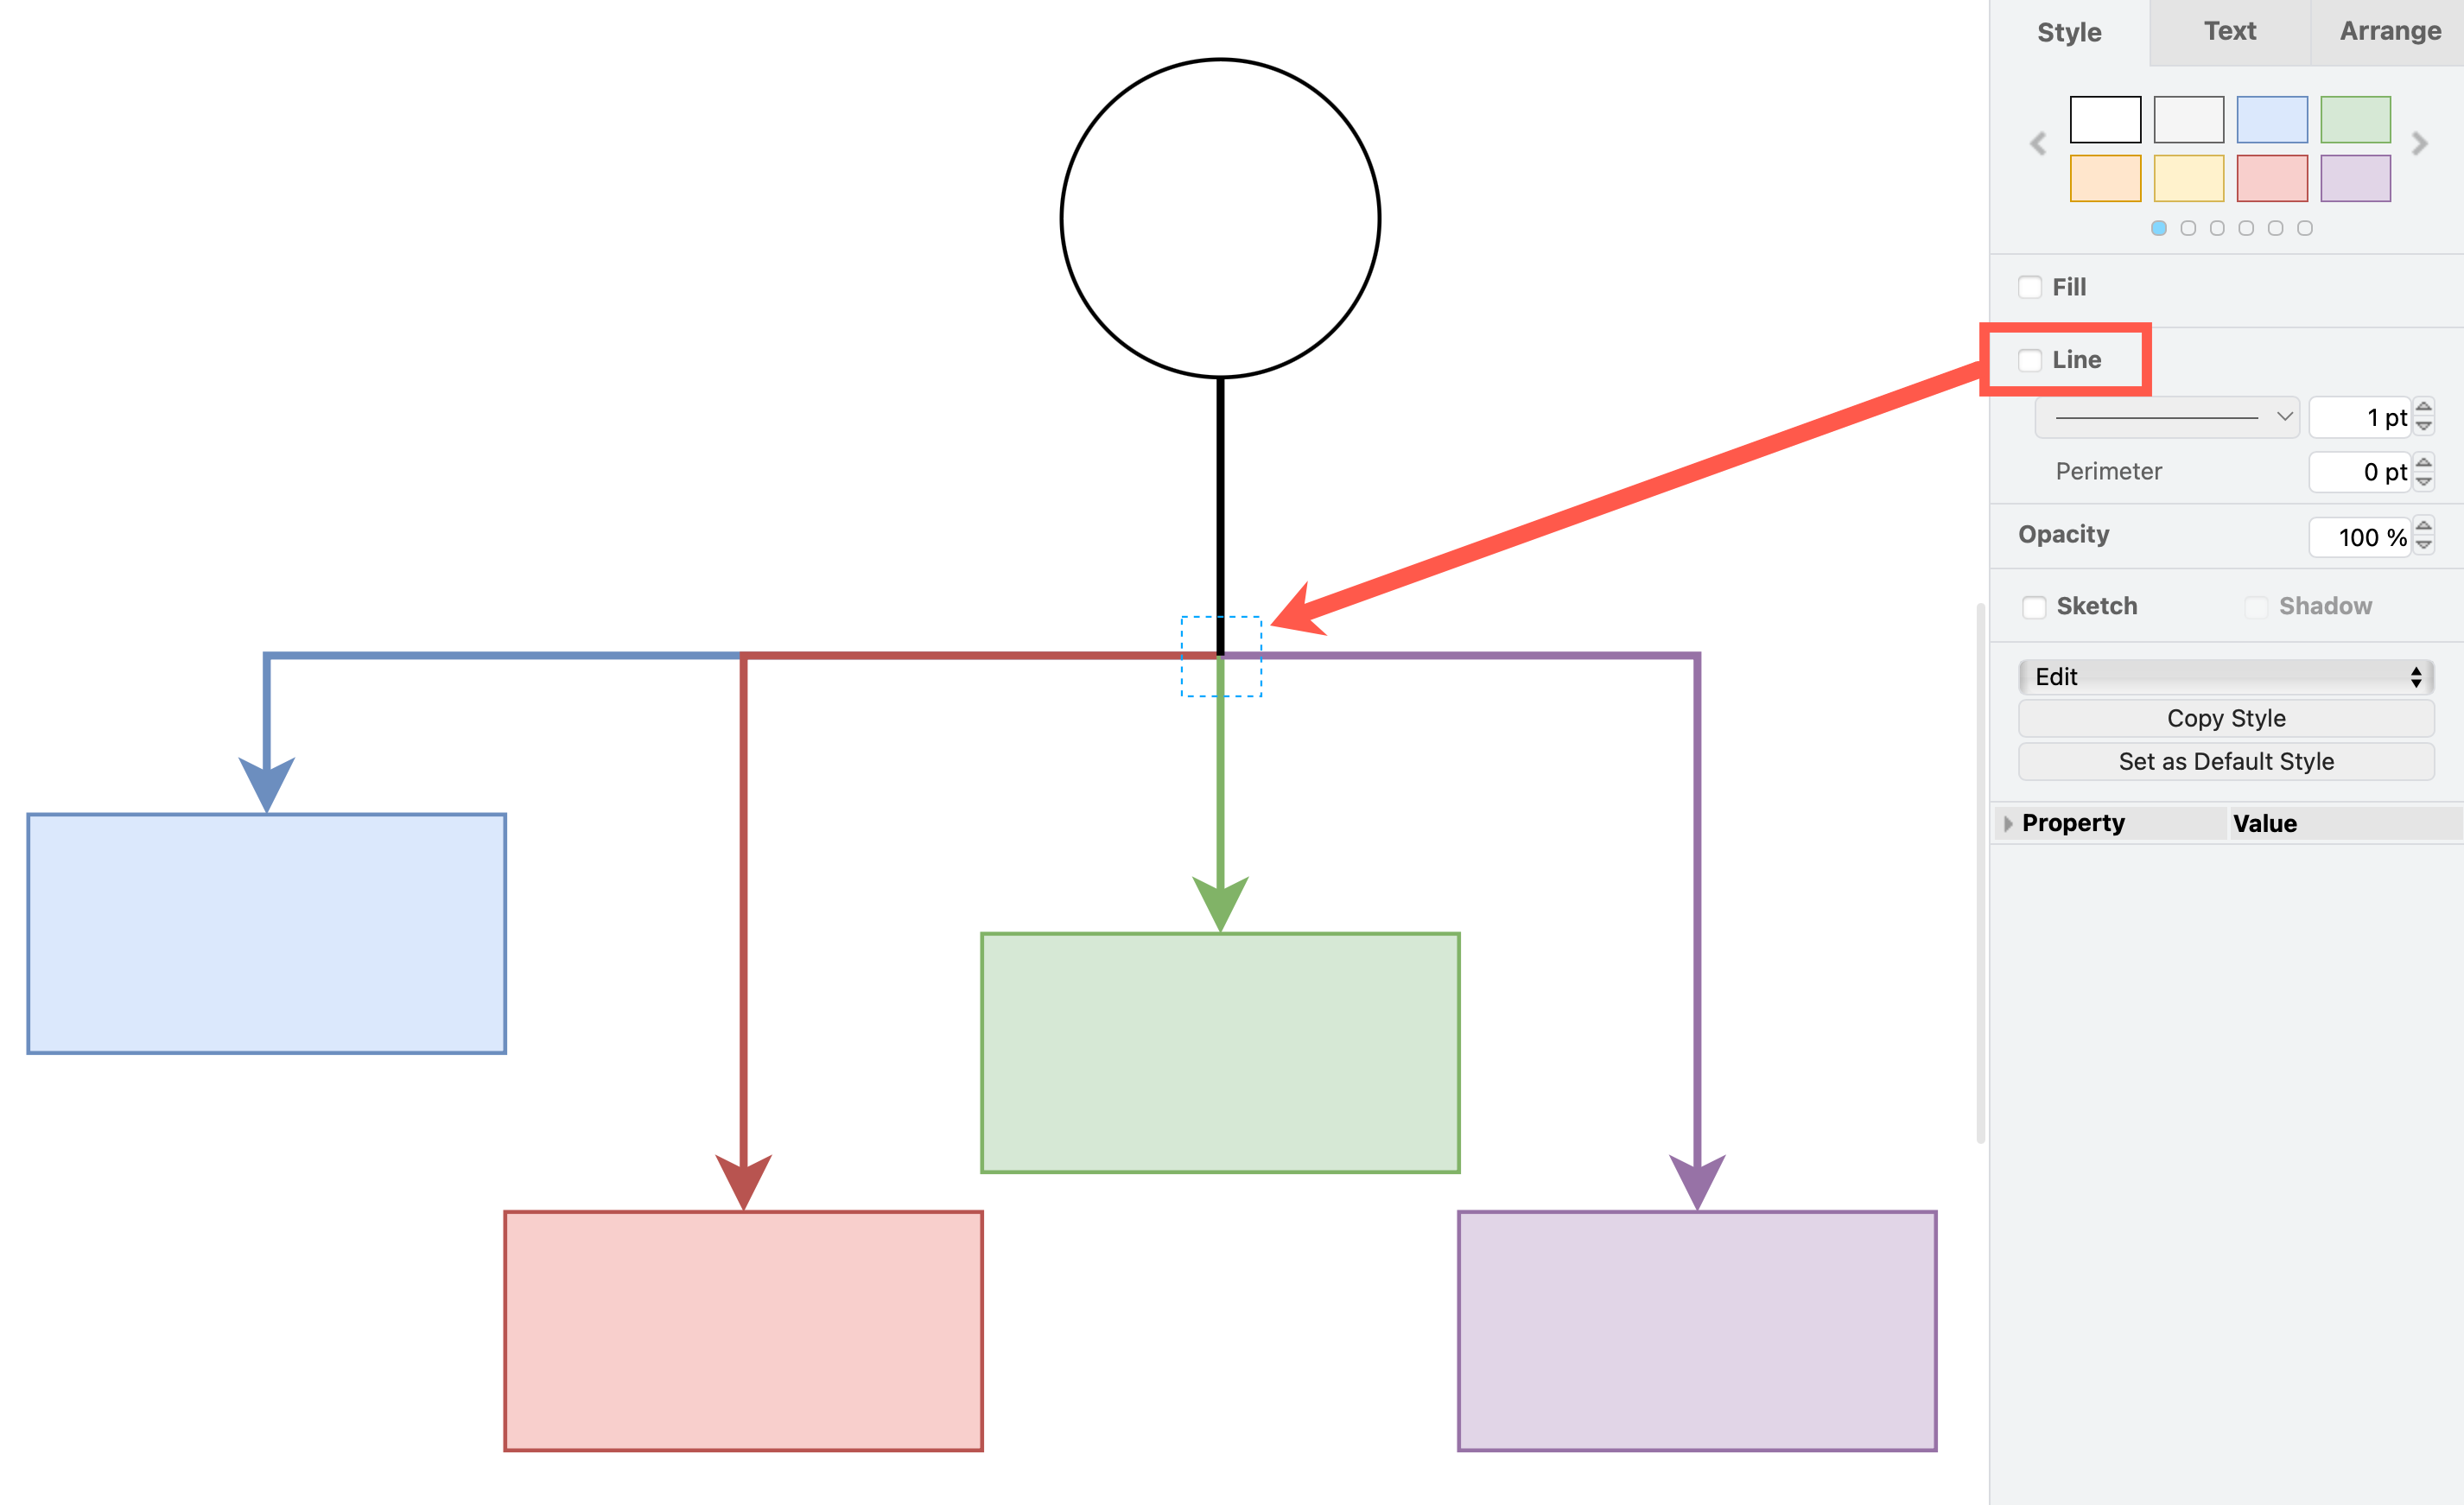
  1. Select the waypoint shape.
  2. In the Style tab of the format panel, deselect the Line checkbox.
    Deselect the Line style checkbox to turn a waypoint shape invisible

The waypoint shape will become invisible but still exist. The connectors will neatly line up and go through that point. Click on that spot to select the invisible waypoint shape if you need to move it.

draw.io updated for Atlassian Jira Software 10.0

· 3 min read

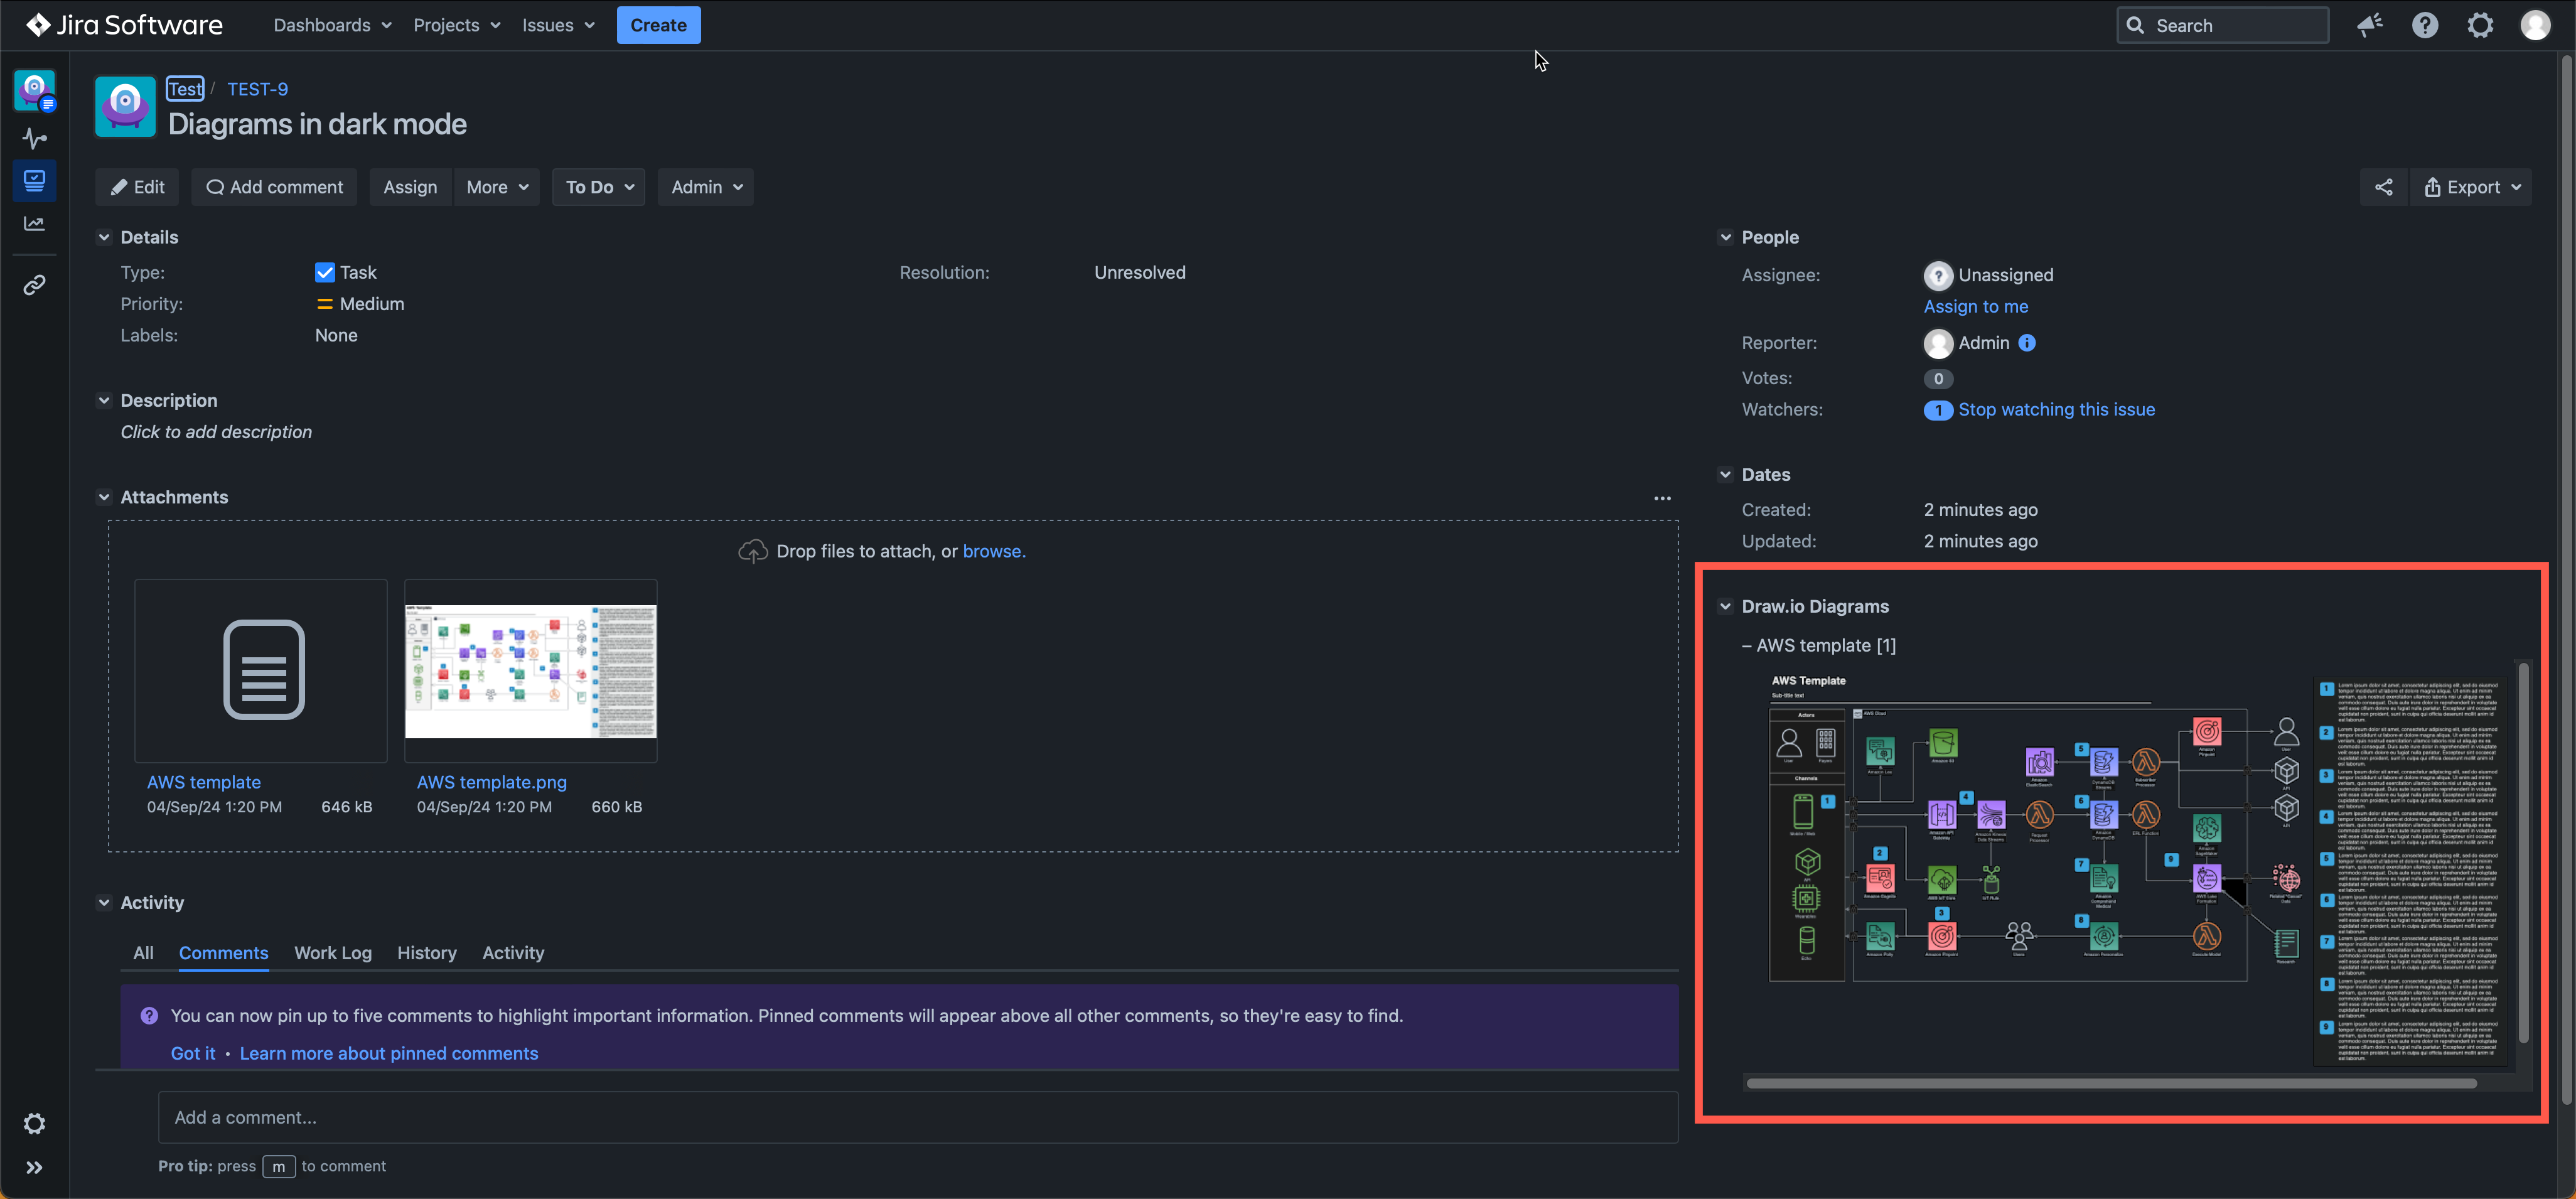
Atlassian has recently released Jira Software 10.0 and Data Center Platform 7, which includes a large collection of security and automation improvements. The draw.io app has been updated to support Jira Software 10.0 and its long awaited dark theme - your diagrams will switch to dark mode automatically to match your Jira user settings.
draw.io diagrams in Jira DC 10.0 will automatically switch to a dark mode palette when you use the new Jira Dark theme

Important

If you are planning to upgrade to Jira 10.0, Atlassian recommends you update all Marketplace apps that support the new version - like draw.io does - beforehand.

Dark theme Jira issues and diagrams

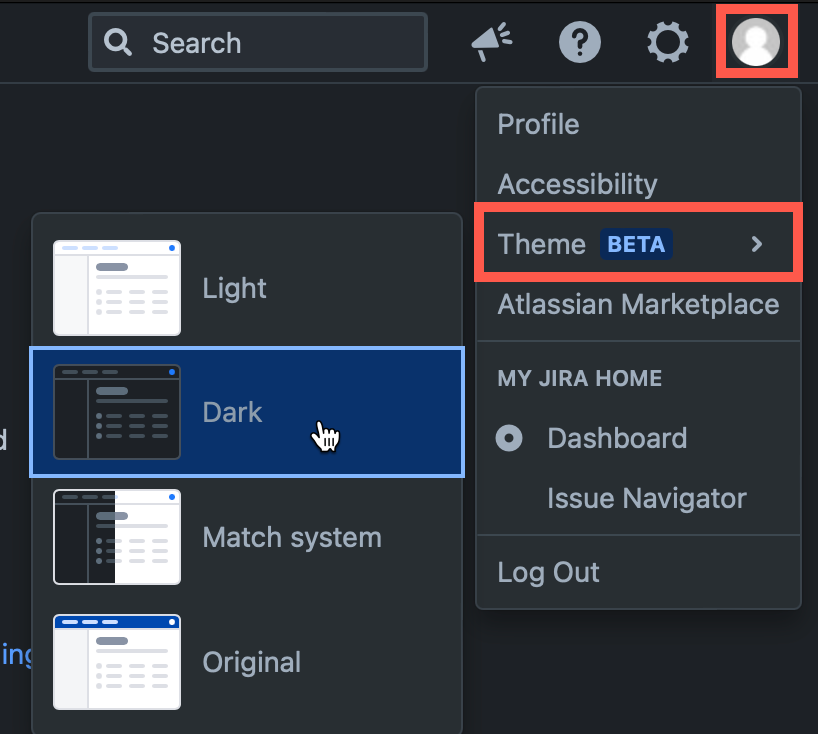
  1. In Jira, click on your user profile image in the top right, then select Theme.
  2. Choose Dark theme, Light theme, or to Match System to match your operating system's theme.
    draw.io diagrams in Jira DC 10.0 will automatically switch to a dark mode palette when you use the new Jira Dark theme

To add a new diagram to a Jira issue, click on More > Add draw.io Diagram to open the draw.io editor.

Once you have saved your diagram to the issue, the Draw.io Diagrams section will be added in the right column.

Diagrams in the Draw.io Diagrams section will be displayed in whichever theme you selected in Jira automatically.

Note: The draw.io diagram in the Attachments section of the Jira issue is saved and shown as if it were light mode. To edit or open a larger version of the diagram, click on the diagram in the Draw.io Diagrams section of the issue.

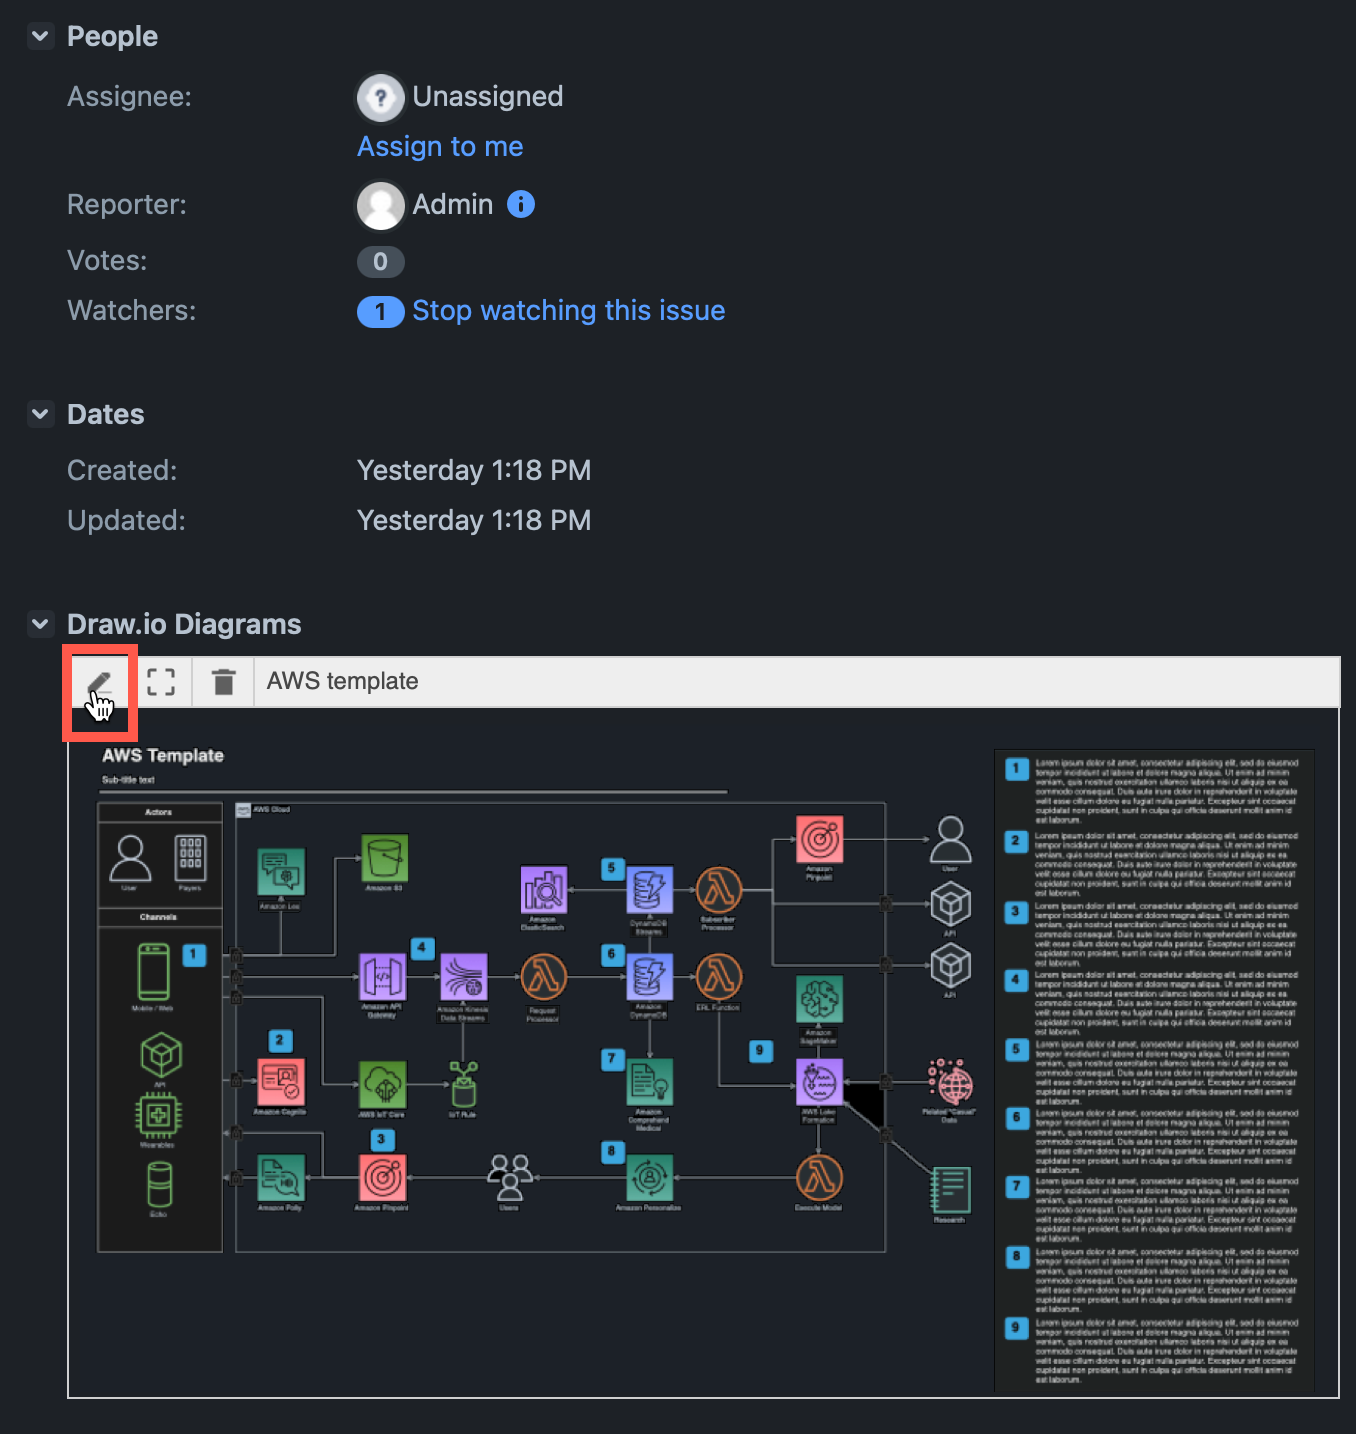
Hover over the diagram and click on the edit pencil to open it in the draw.io editor.
draw.io diagrams in Jira DC 10.0 will automatically switch to a dark mode palette when you use the new Jira Dark theme

Using draw.io in Jira DC

draw.io for Confluence Data Center 9.0

· 4 min read

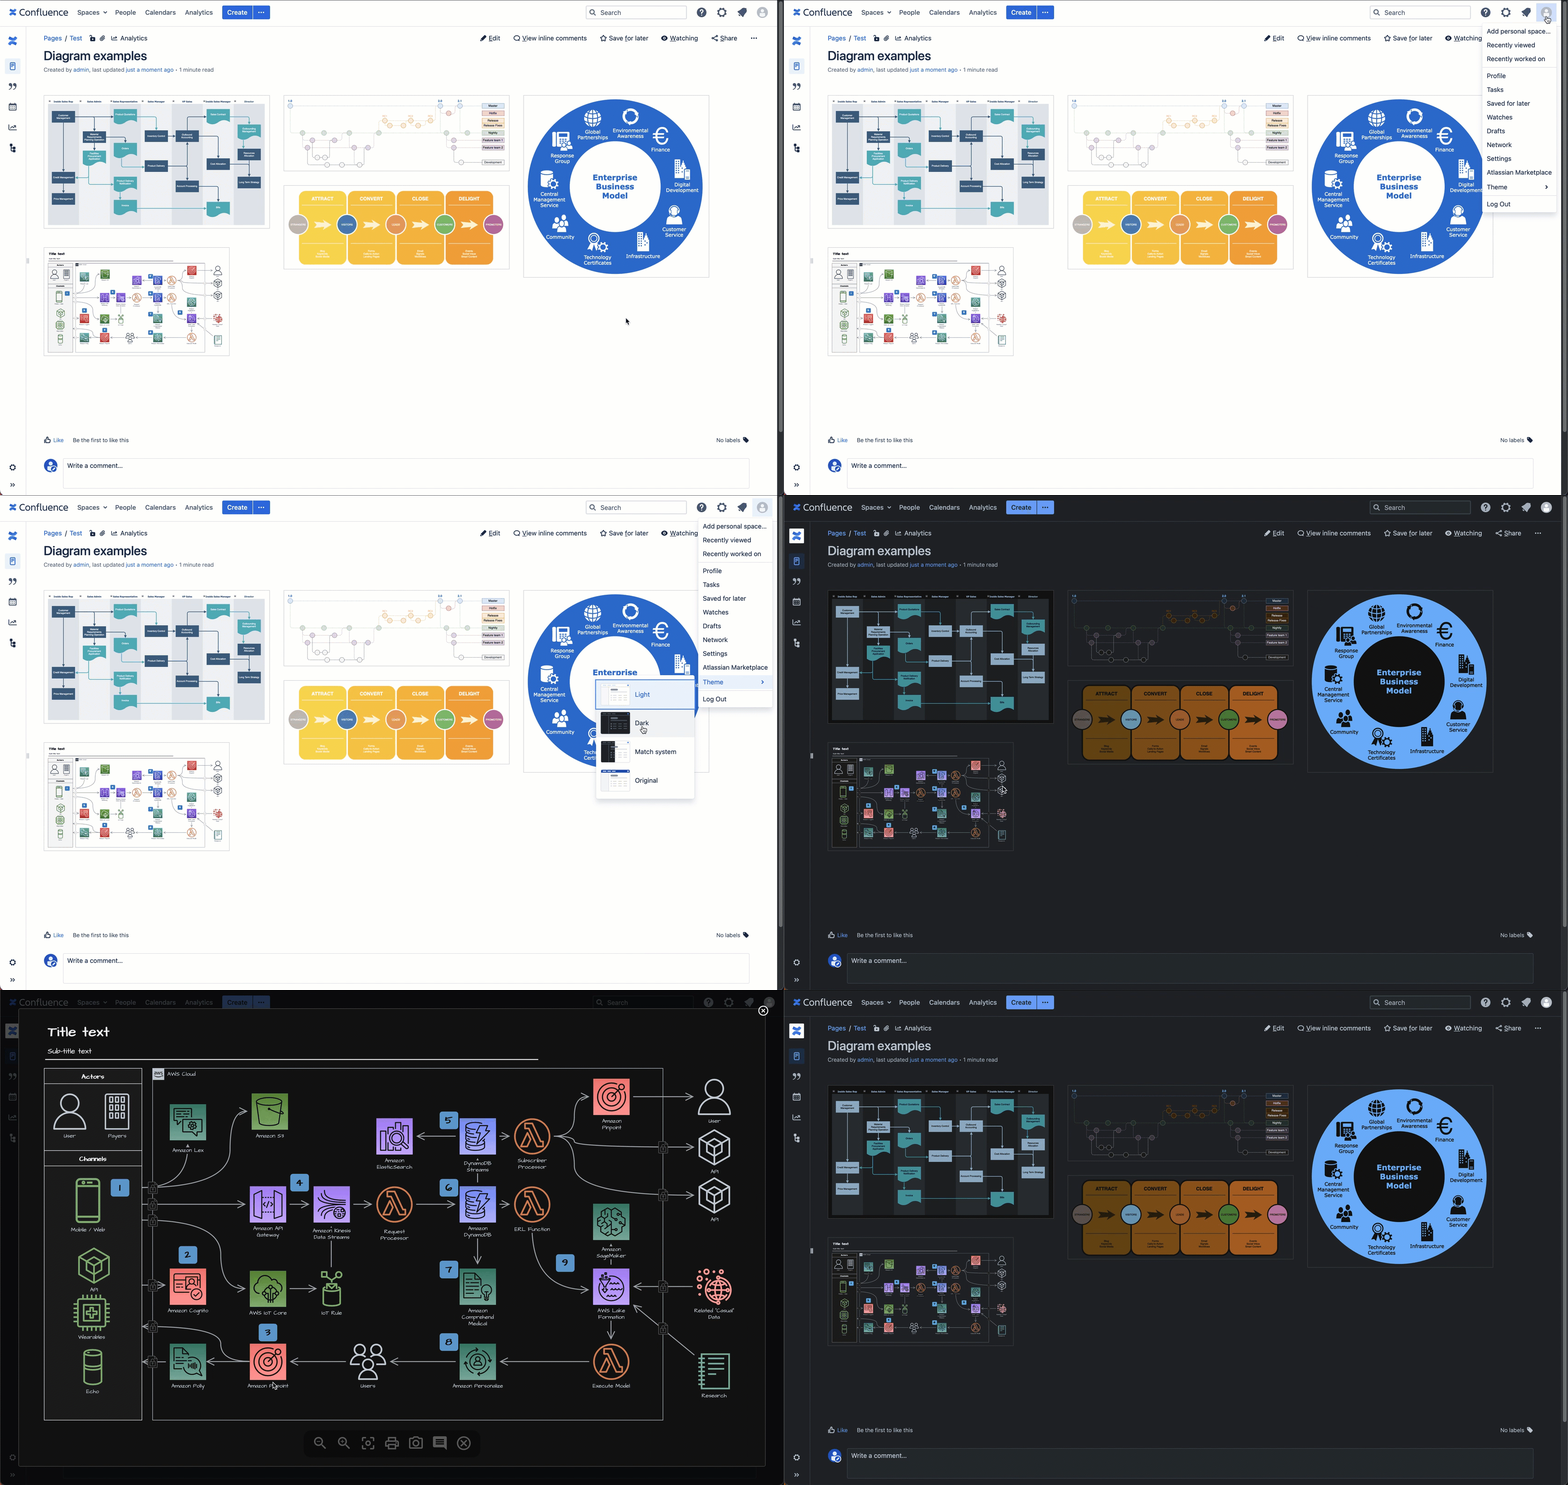
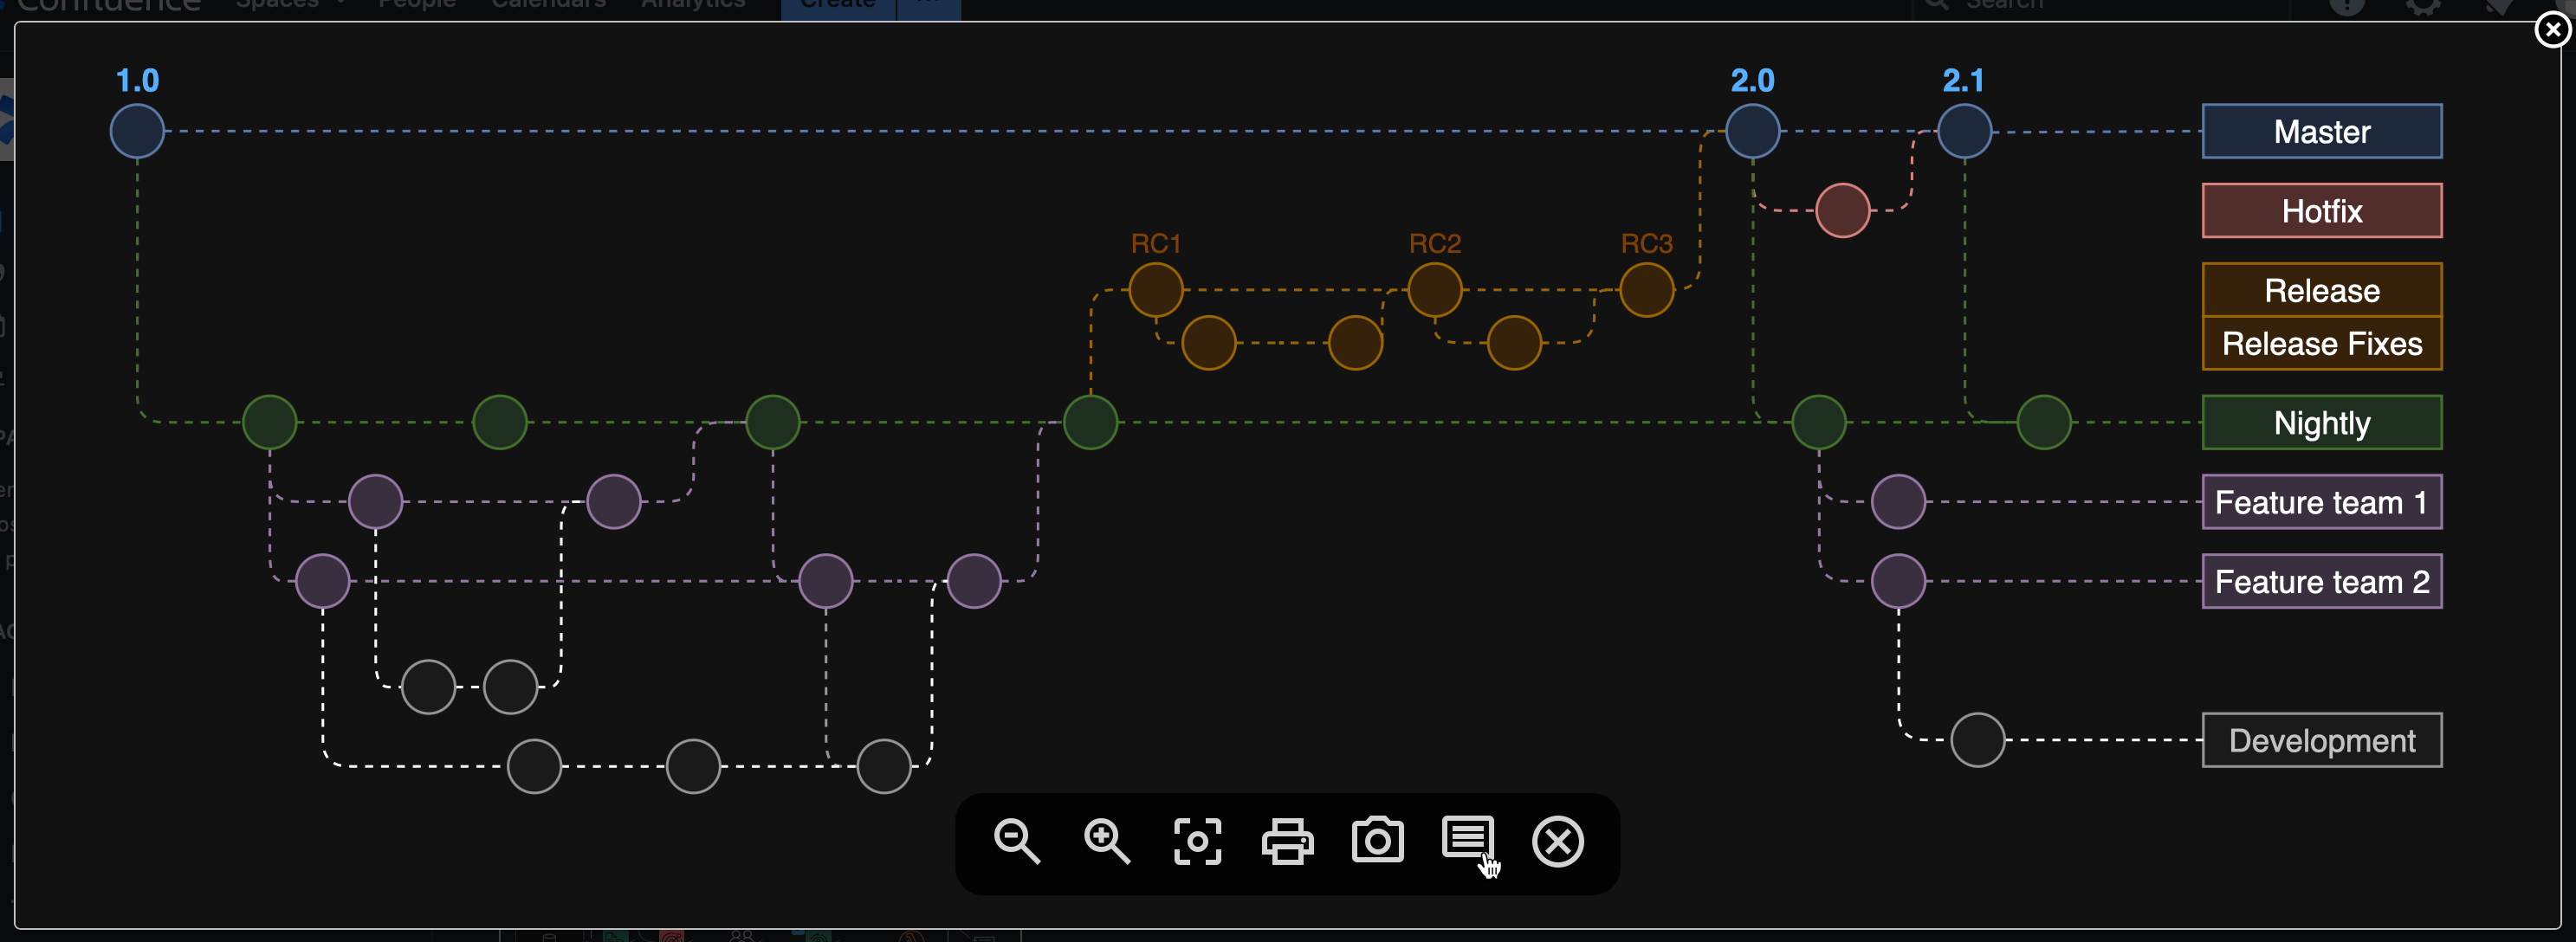
Atlassian has just released Confluence Data Center 9.0, with a wide range of security improvements and user-friendly updates. The draw.io app is fully compatible with Confluence DC 9.0 - when you use the new Dark theme in your Confluence instance, you'll automatically see draw.io diagrams in dark mode.
draw.io diagrams in Confluence DC 9.0 will automatically switch to a dark mode palette when you use the new Confluence Dark theme

Dark mode diagrams in Confluence DC

Just as Confluence has updated their colour palette for accessibility contrast to ensure text page content remains readable on a dark background, draw.io automatically switches to an enhanced dark-mode palette.

Dark mode colours with improved contrast are automatically applied to the diagram previews when you look at any Confluence DC 9.0 page, and also when you click on the diagram to open it in the draw.io lightbox viewer.
When you open a draw.io diagram from a Confluence DC 9.0 page into the lightbox, it will automatically apply your light or dark theme and change the diagram colours to stay readable

Edit draw.io diagrams in dark mode

If you use the Confluence Dark theme, draw.io diagram macros and draw.io board macros will open the draw.io editor automatically in dark mode.

Improved contrast dark mode palette by default

The draw.io dark mode palette in Confluence DC 9.0 uses improved contrast colours by default, ensuring maximum readability of your diagrams when viewed in both dark and light modes.
The dark mode palette in draw.io for Confluence DC 9.0 is designed for the best readability

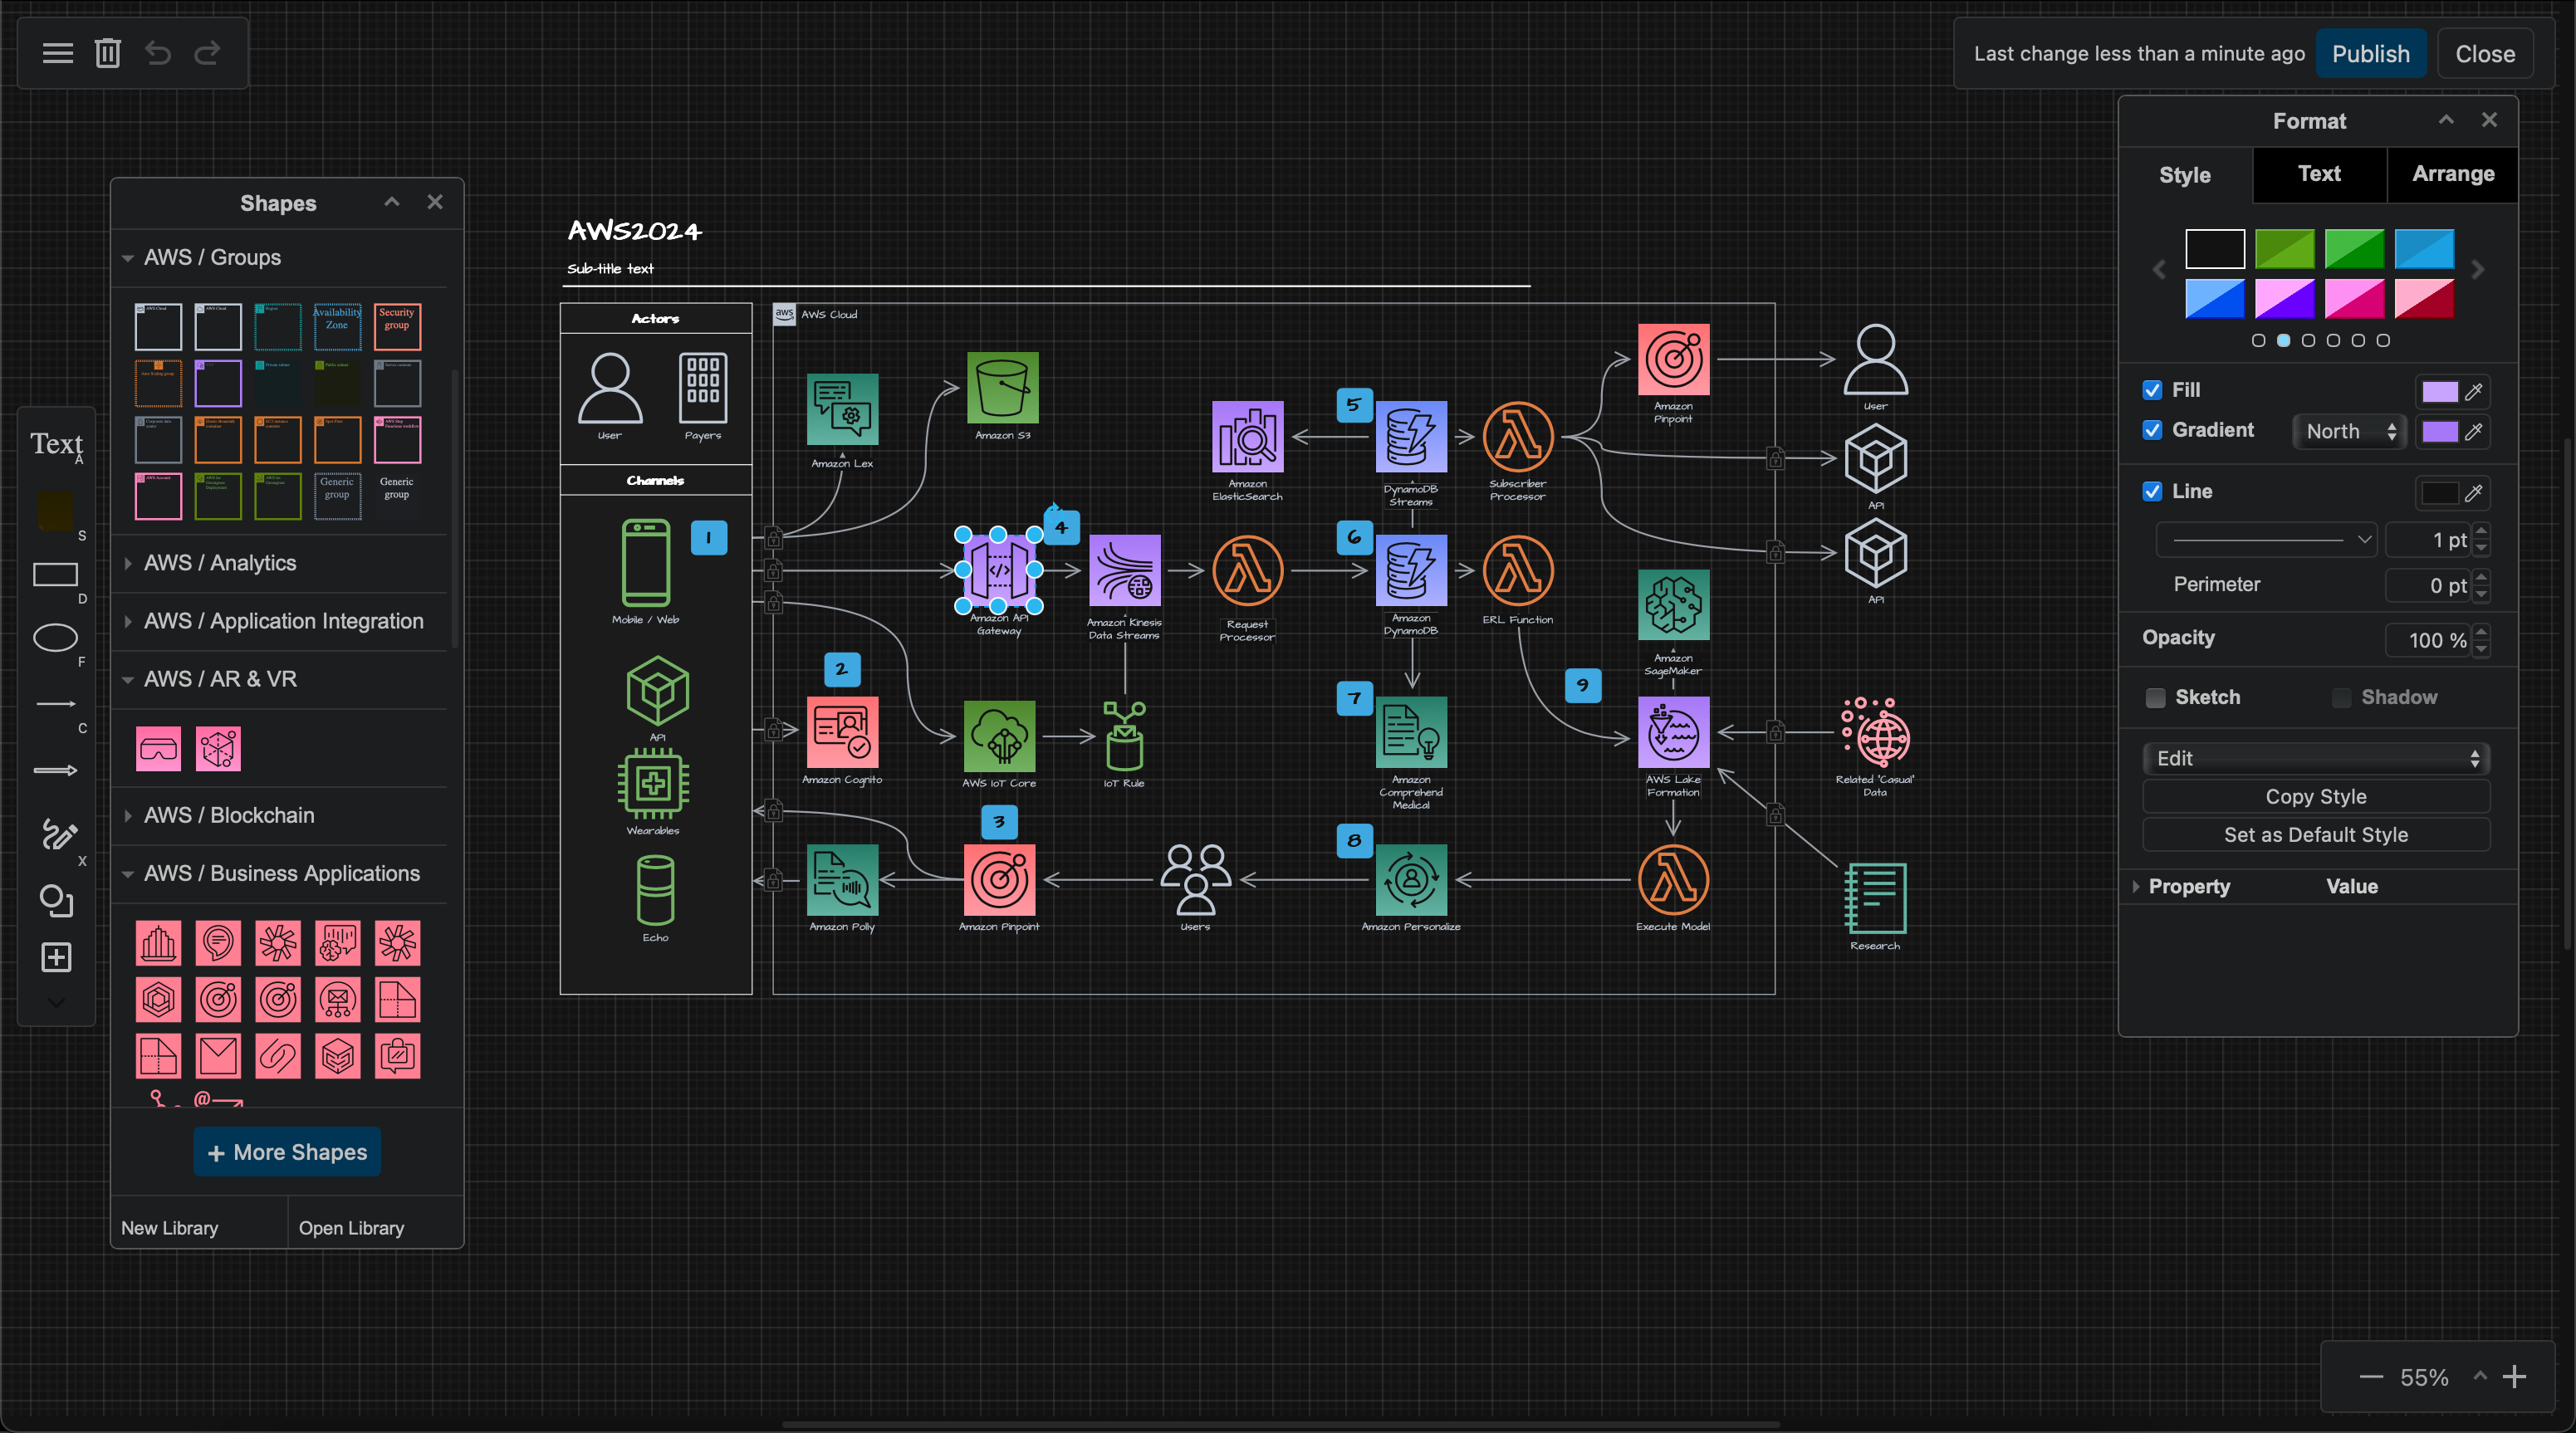
draw.io board macro in dark mode

The whiteboard-like simple interface of the draw.io board macro also uses dark mode automatically when you have enabled Dark theme in Confluence DC 9.0.
Dark mode is used for the draw.io board editor automatically when you use Dark theme inConfluence DC 9.0

Switch to light mode

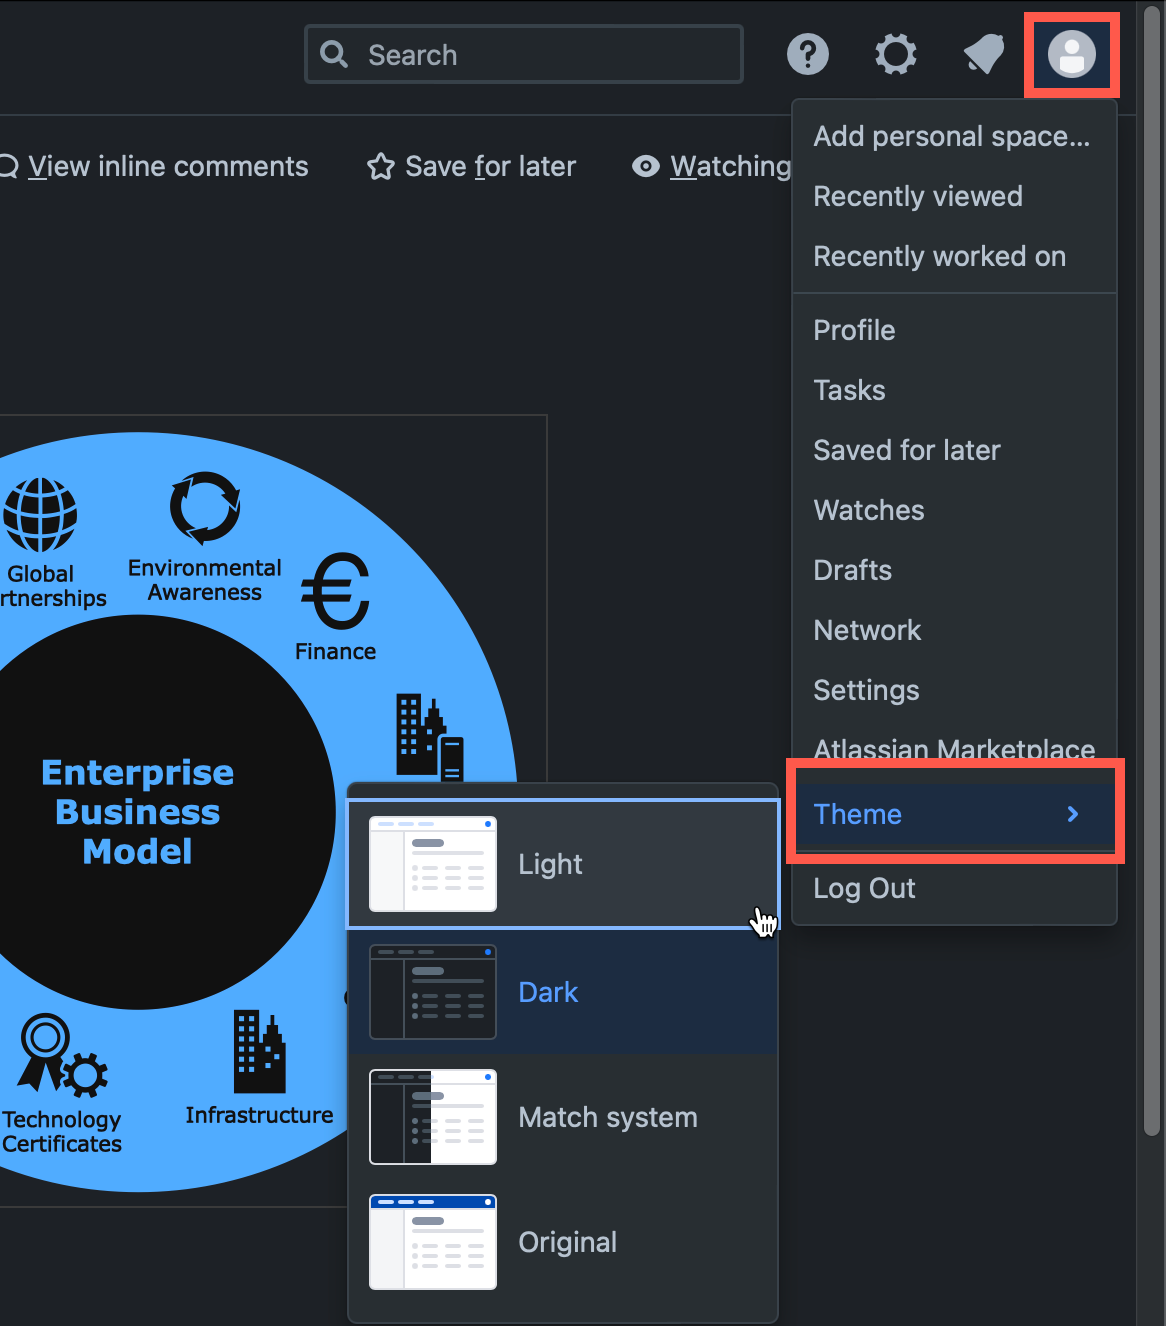
To edit a diagram in light mode, change your Confluence Theme to Light first. Select your user icon in the top right, then select Theme > Light from the menu.
To edit a diagram in light mode, switch your Confluence theme to light mode first.

Search for diagrams with OpenSearch

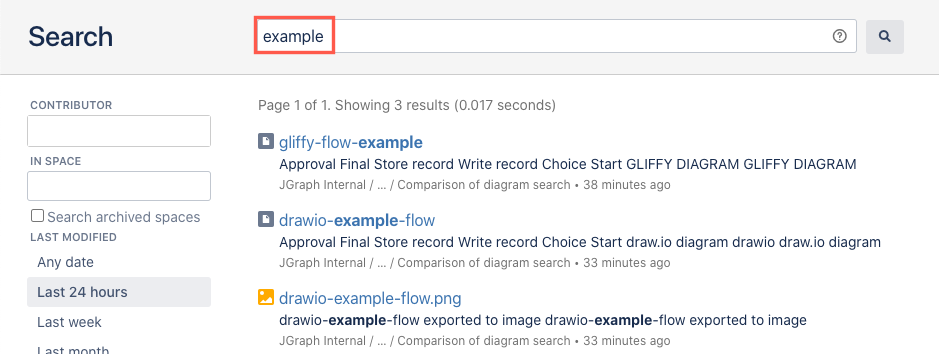
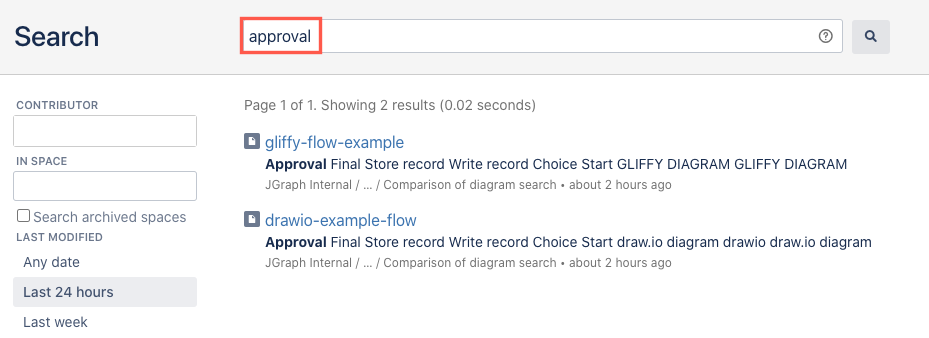
The new integration of OpenSearch will find draw.io diagrams in the same way the built-in Confluence search does - your diagrams are fully searchable via the Confluence search.

draw.io provides the file names and diagram label text to the Confluence search index used by both the built-in basic and advanced search functionality and OpenSearch.

See how searching for diagrams in Confluence Cloud and Data Center works and compare it with other diagramming tools.

FilenameLabel text
Search for a diagram filename in Confluence ServerSearch for label text inside a diagram in Confluence Server

To set up your Confluence DC 9.0 instance to use the new optional search integration, please refer to Atlassian's OpenSearch documentation.

See all the security and usability updates available in Confluence DC 9.0.

Mermaid in draw.io updated to support ELK layout

· 6 min read

Mermaid is a text-based syntax that you can use to describe a diagram, and automatically lay it out neatly on the diagram canvas. Enter your Mermaid diagram description in draw.io via Arrange > Insert > Mermaid in the draw.io menu or + > Mermaid from the toolbar. draw.io has updated to Mermaid version 10.9.1 to support the new ELK automatic layout.
Tell the Mermaid diagram generation tool to use the ELK layout option in your text diagram description

Text to diagram tools in draw.io

There are several text-to-diagram tools built into draw.io:

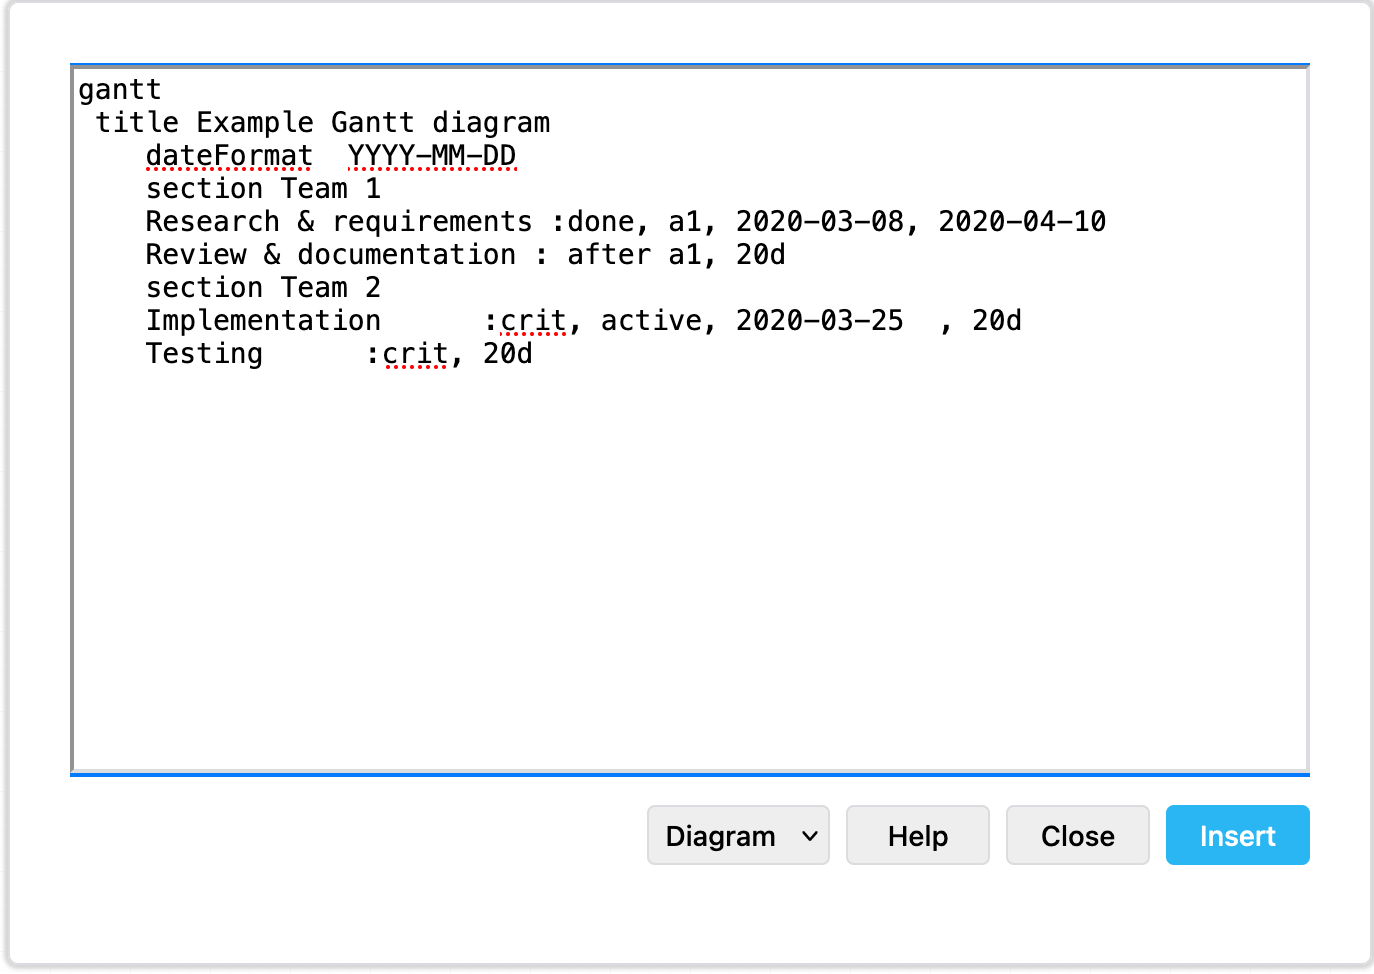
Paste the Mermaid syntax text version of your diagram and Insert it onto the draw.io canvas An example Gantt chart inserted from Mermaid code
Example Gantt chart generated from Mermaid syntax

Some of these text-to-diagram features generate a diagram as an image on the drawing canvas, and some use draw.io shapes to automatically layout your diagram and let you continue styling and dding draw.io shapes and connectors to it.

You can choose your preferred output when you generate a diagram from Mermaid syntax. By default, your Mermaid diagram will be generated and layed out inside a Mermaid container group using draw.io shapes and connectors.

You can style the shapes, connectors and text in this container group, edit the Mermaid source, and the draw.io styles will be reapplied to any elements that continue to exist. However, any geometry changes (resize, reposition, connector arrow ends) will be reset if you edit the Mermaid source.

Insert a Mermaid diagram in draw.io

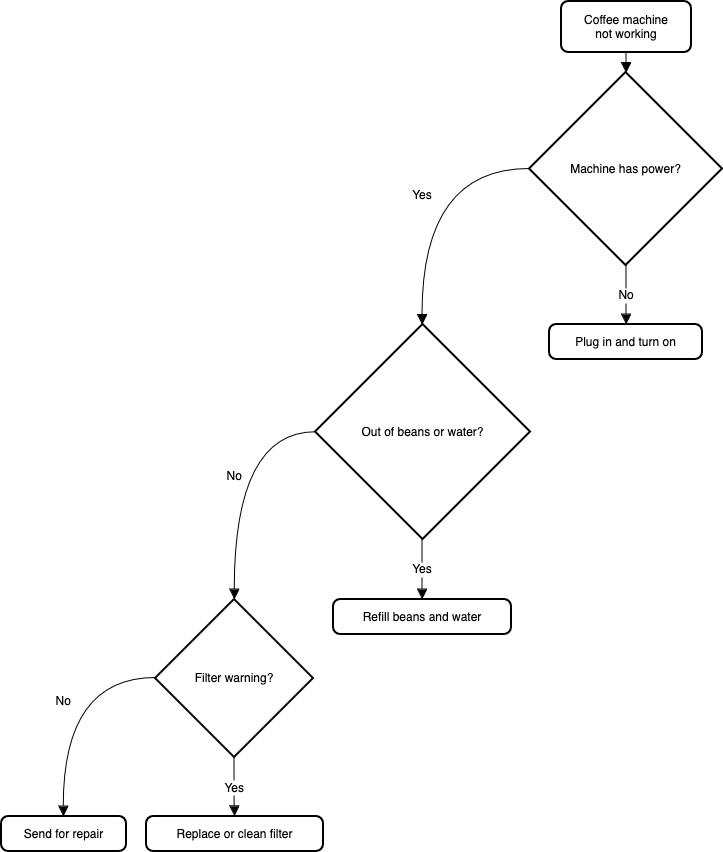
An example coffee machine debugging flow is described in Mermaid syntax below.

flowchart TD
A(Coffee machine <br />not working) --> B{Machine has power?}
B -->|No| H(Plug in and turn on)
B -->|Yes| C{Out of beans or water?} -->|Yes| G(Refill beans and water)
C -->|No| D{Filter warning?} -->|Yes| I(Replace or clean filter)
D -->|No| F(Send for repair)

Add this Mermaid diagram to draw.io.

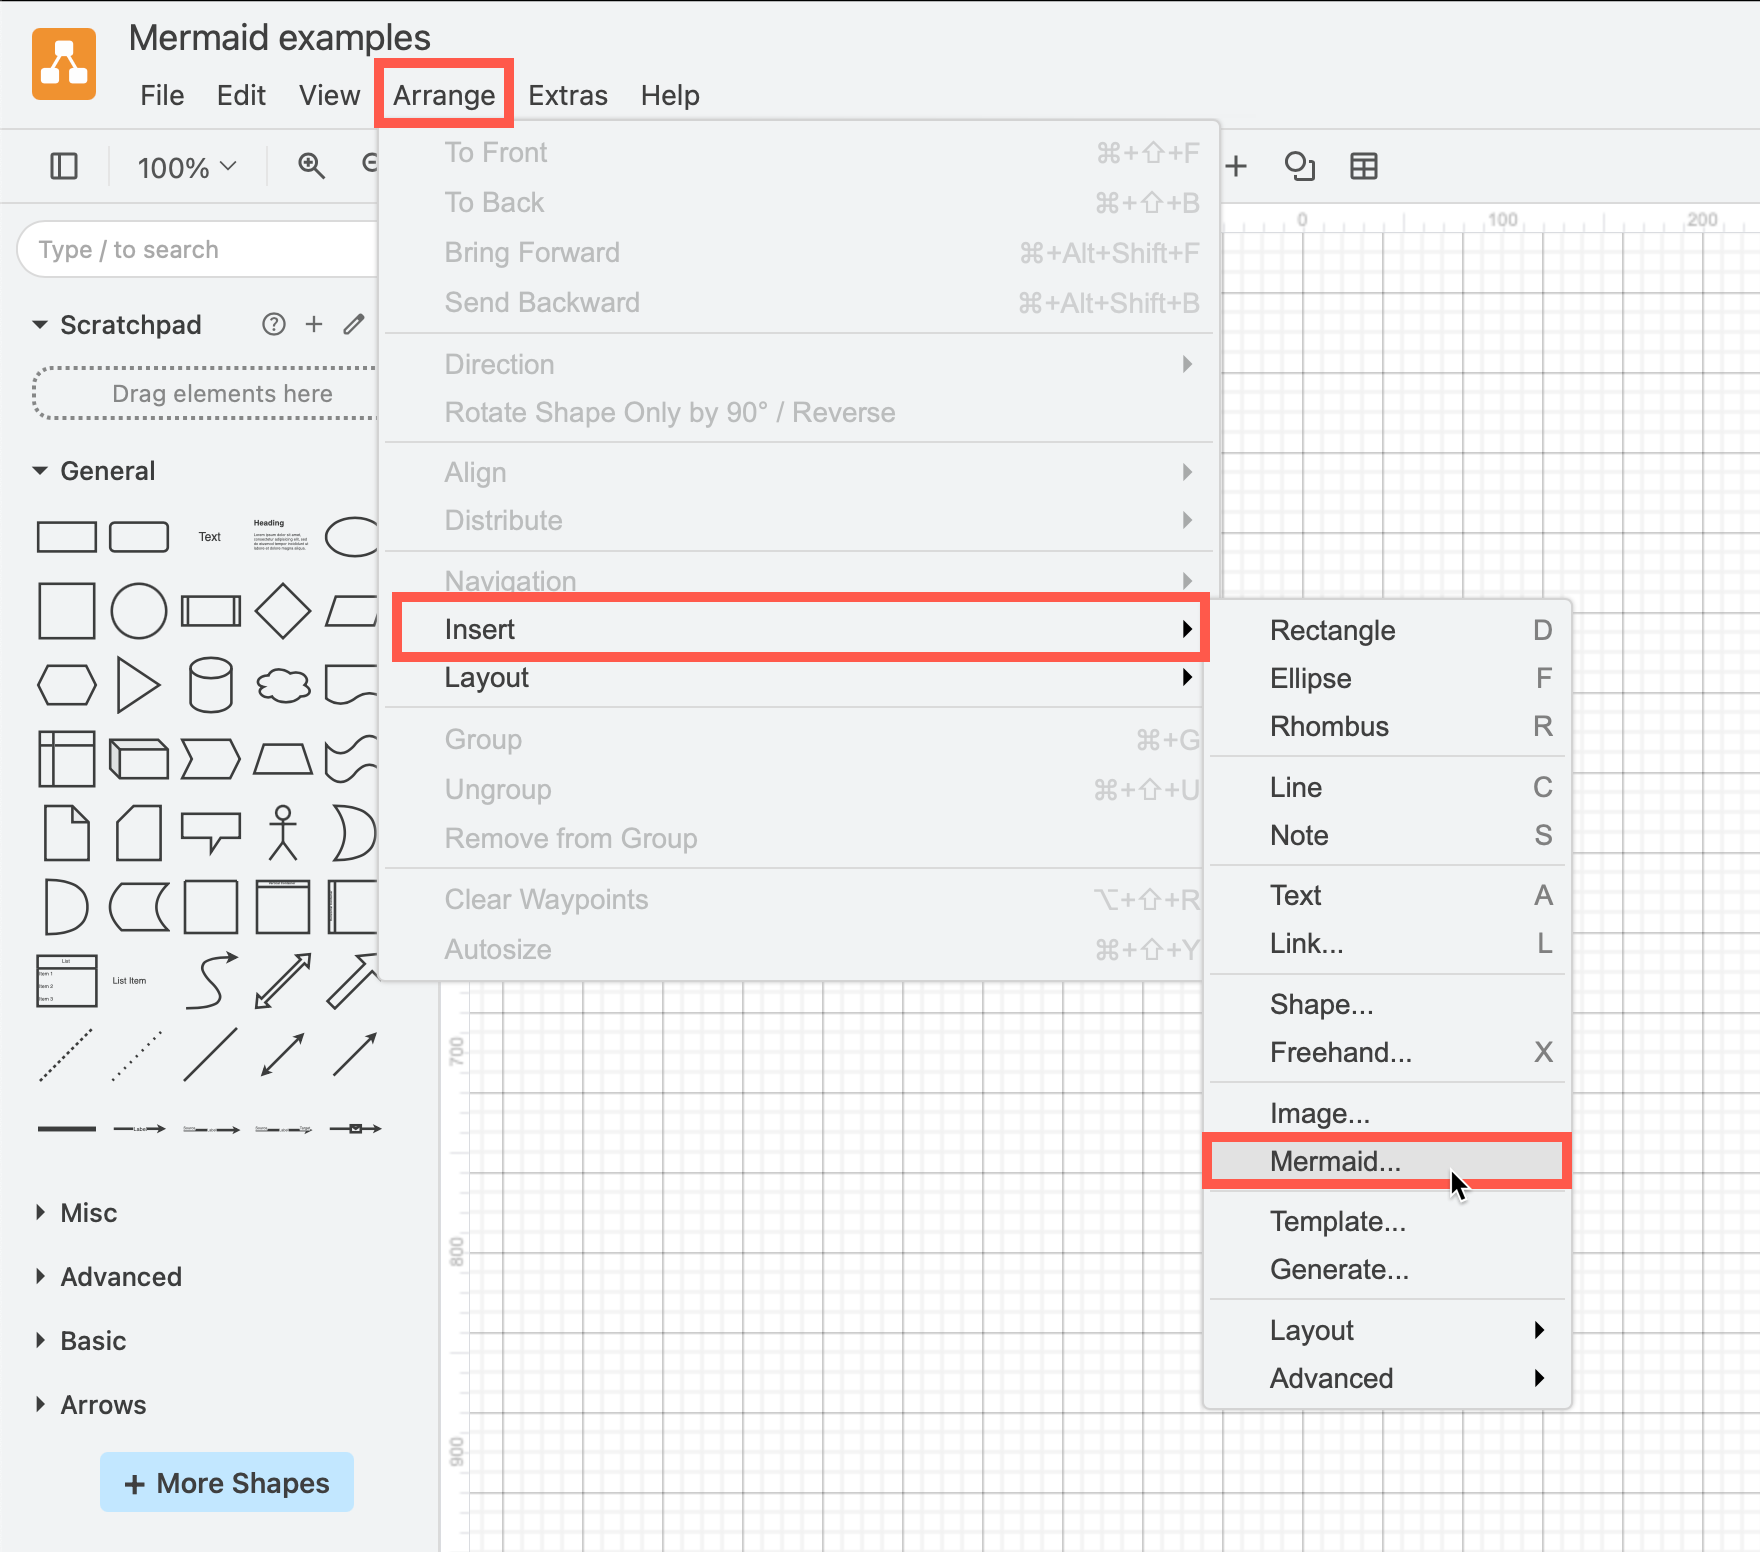
  1. Select Arrange > Insert > Mermaid from the menu or + > Mermaid from the toolbar if you are using the Simple mode or the Sketch editor theme.
    Click Arrange /> Insert > Mermaid to create a diagram from Mermaid Markdown-inspired code
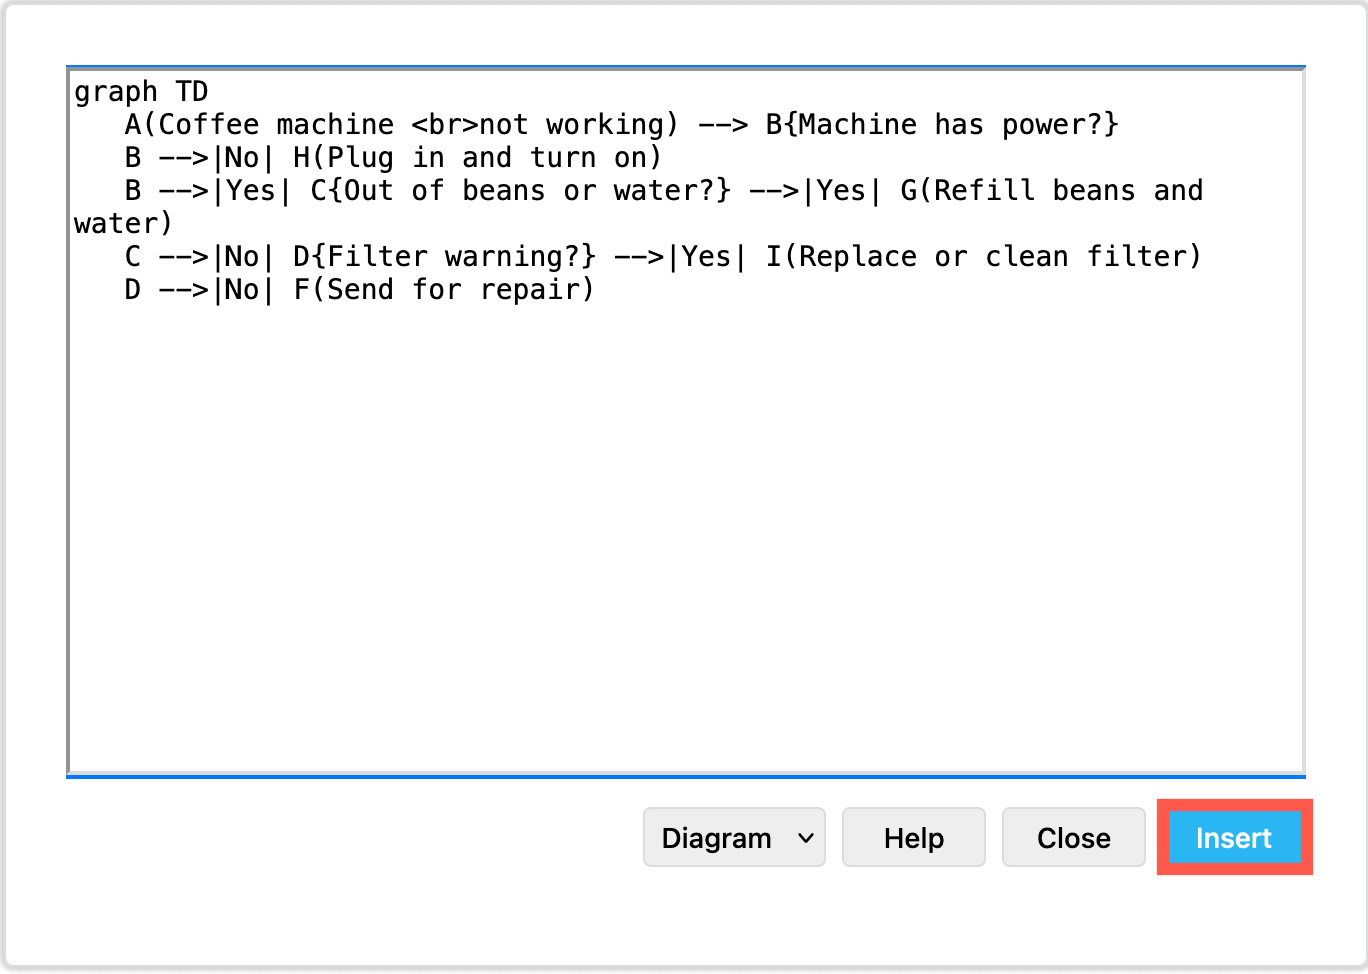
  2. Enter the text description of your diagram using Mermaid syntax in the large text box.
  3. From the drop-down list, select whether you want to insert the diagram with draw.io shapes (Diagram), or as a single SVG image (Image), and click Insert.
    Paste the text in Mermaid syntax, then click Insert

Please refer to the Mermaid documentation for the complete syntax and styling options.

New ELK layouts for large flowcharts

The new ELK layout option, introduced in Mermaid version 9.4, can generate compacter versions of large and complex flowcharts.

Add the following renderer directive to the top your Mermaid diagram text description:

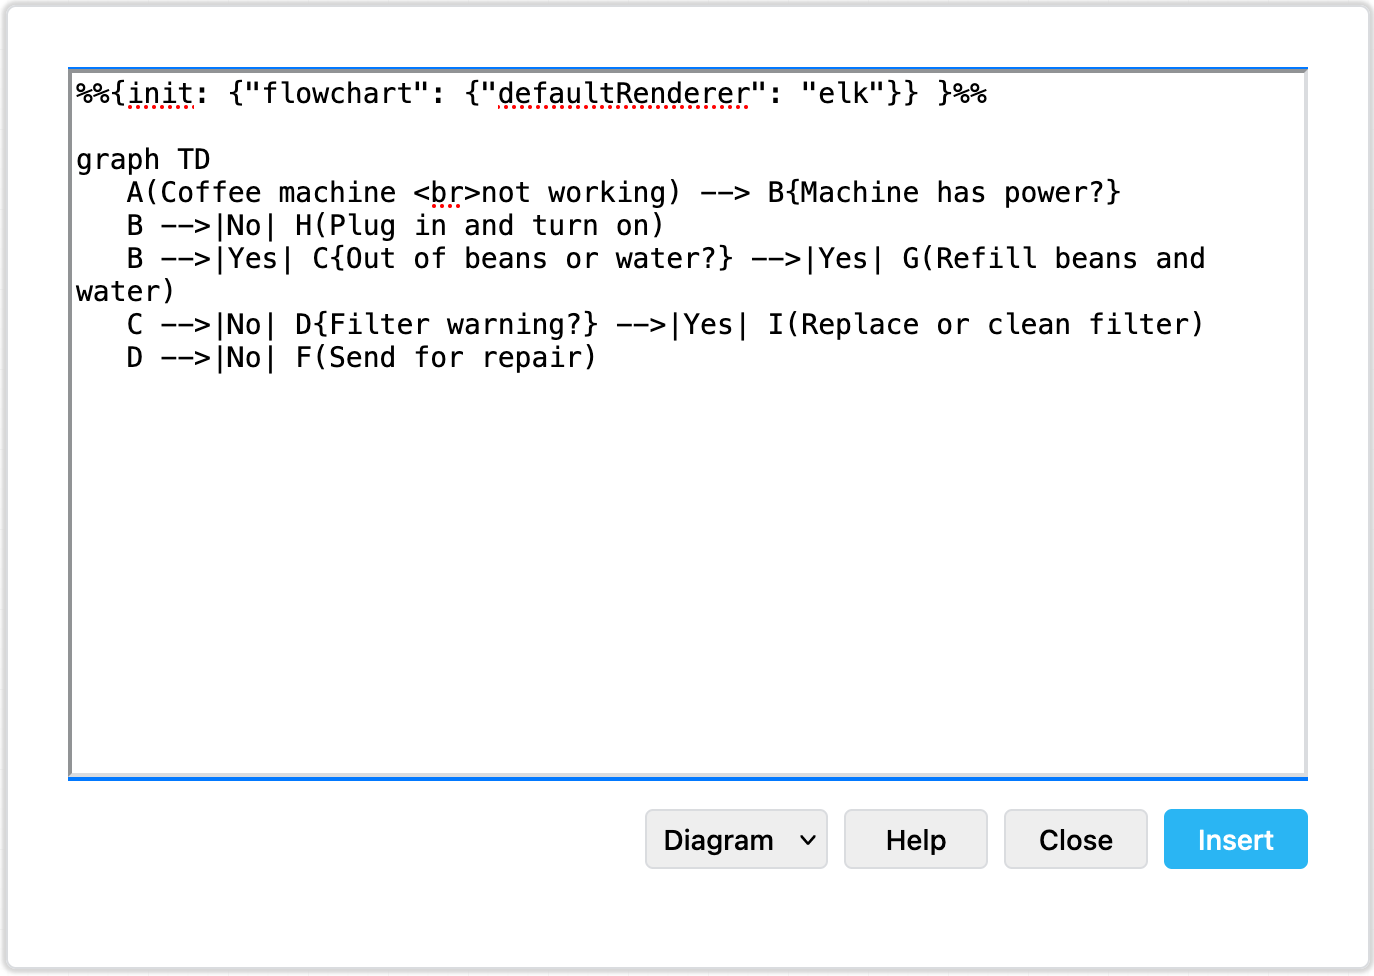
%%{init: {"flowchart": {"defaultRenderer": "elk"}} }%%

For example, to layout the example Mermaid graph shown above with the ELK renderer initialisation command, the insert Mermaid dialog looks as follows.
Tell the Mermaid diagram generation tool to use the ELK layout option in your text diagram description

Click Insert, and the Mermaid diagram will be generated ad drawn with draw.io shapes.
The ELK layout may be more suited for larger and more complex flows

While this example is small and simple, larger flows with complex decisions and many branches may be displayed better using this ELK renderer option.

Note: As this is an experimental feature from the Mermaid developers, it currently only supports the flowchart layout.

See more about configuring the Mermaid layout engine

Large Mermaid flowchart with and without ELK

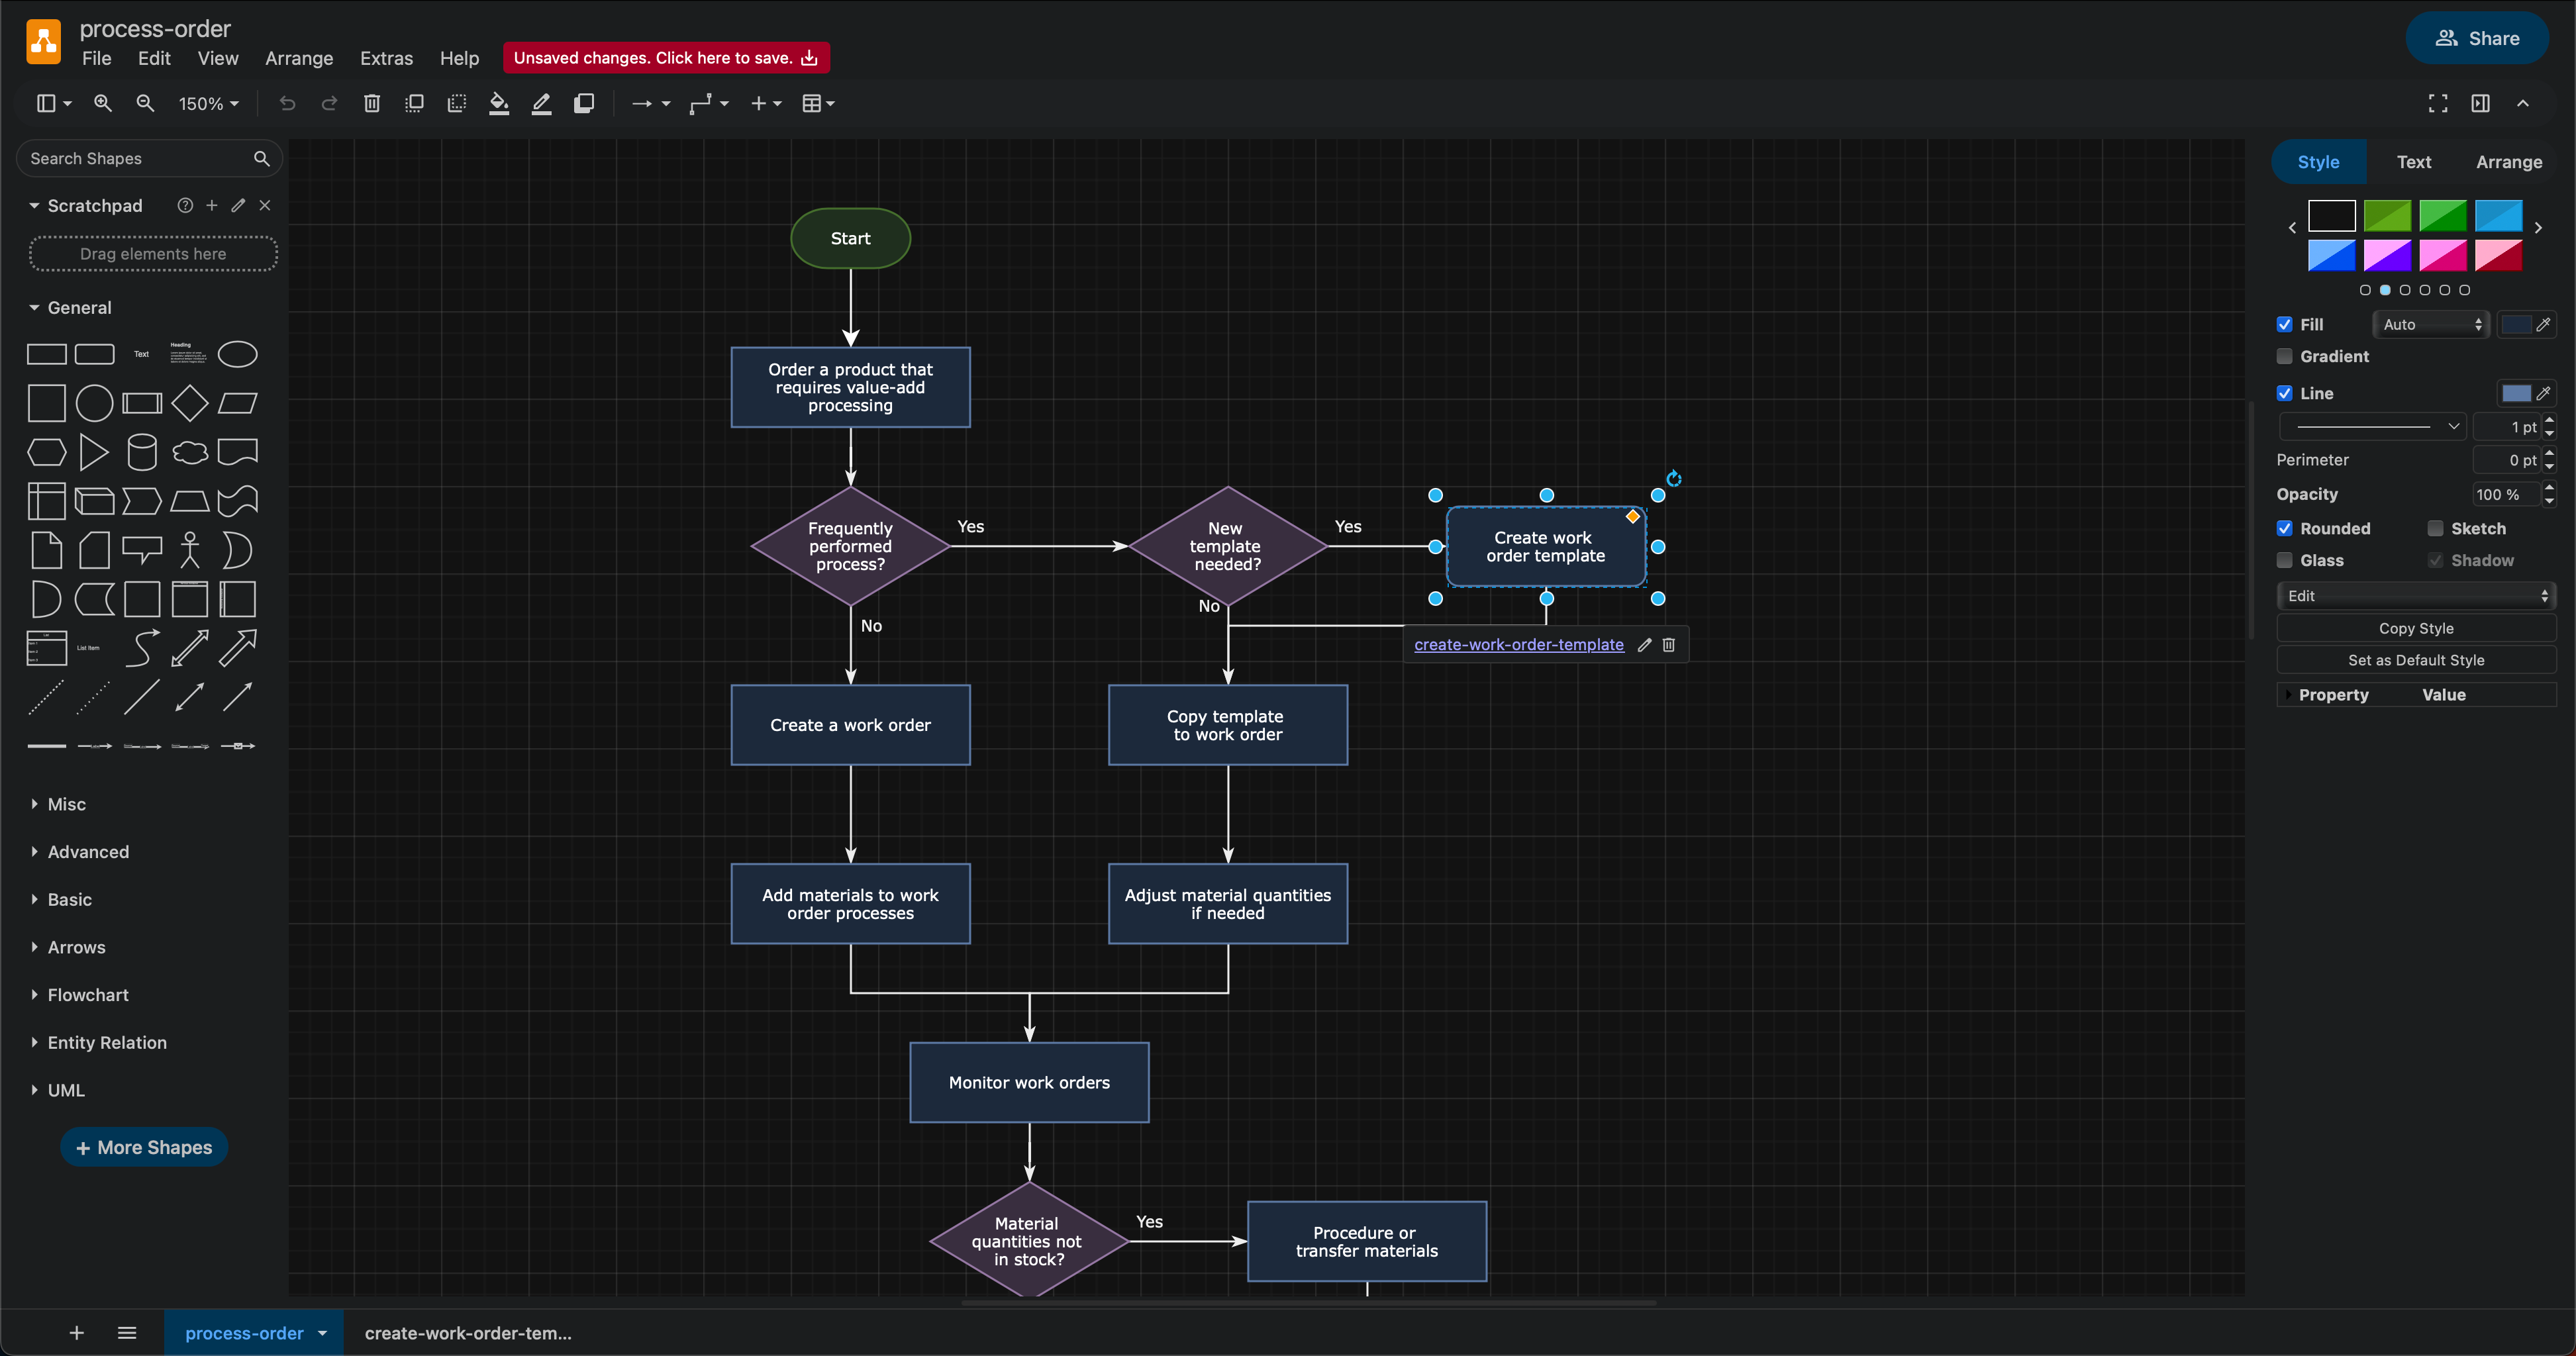
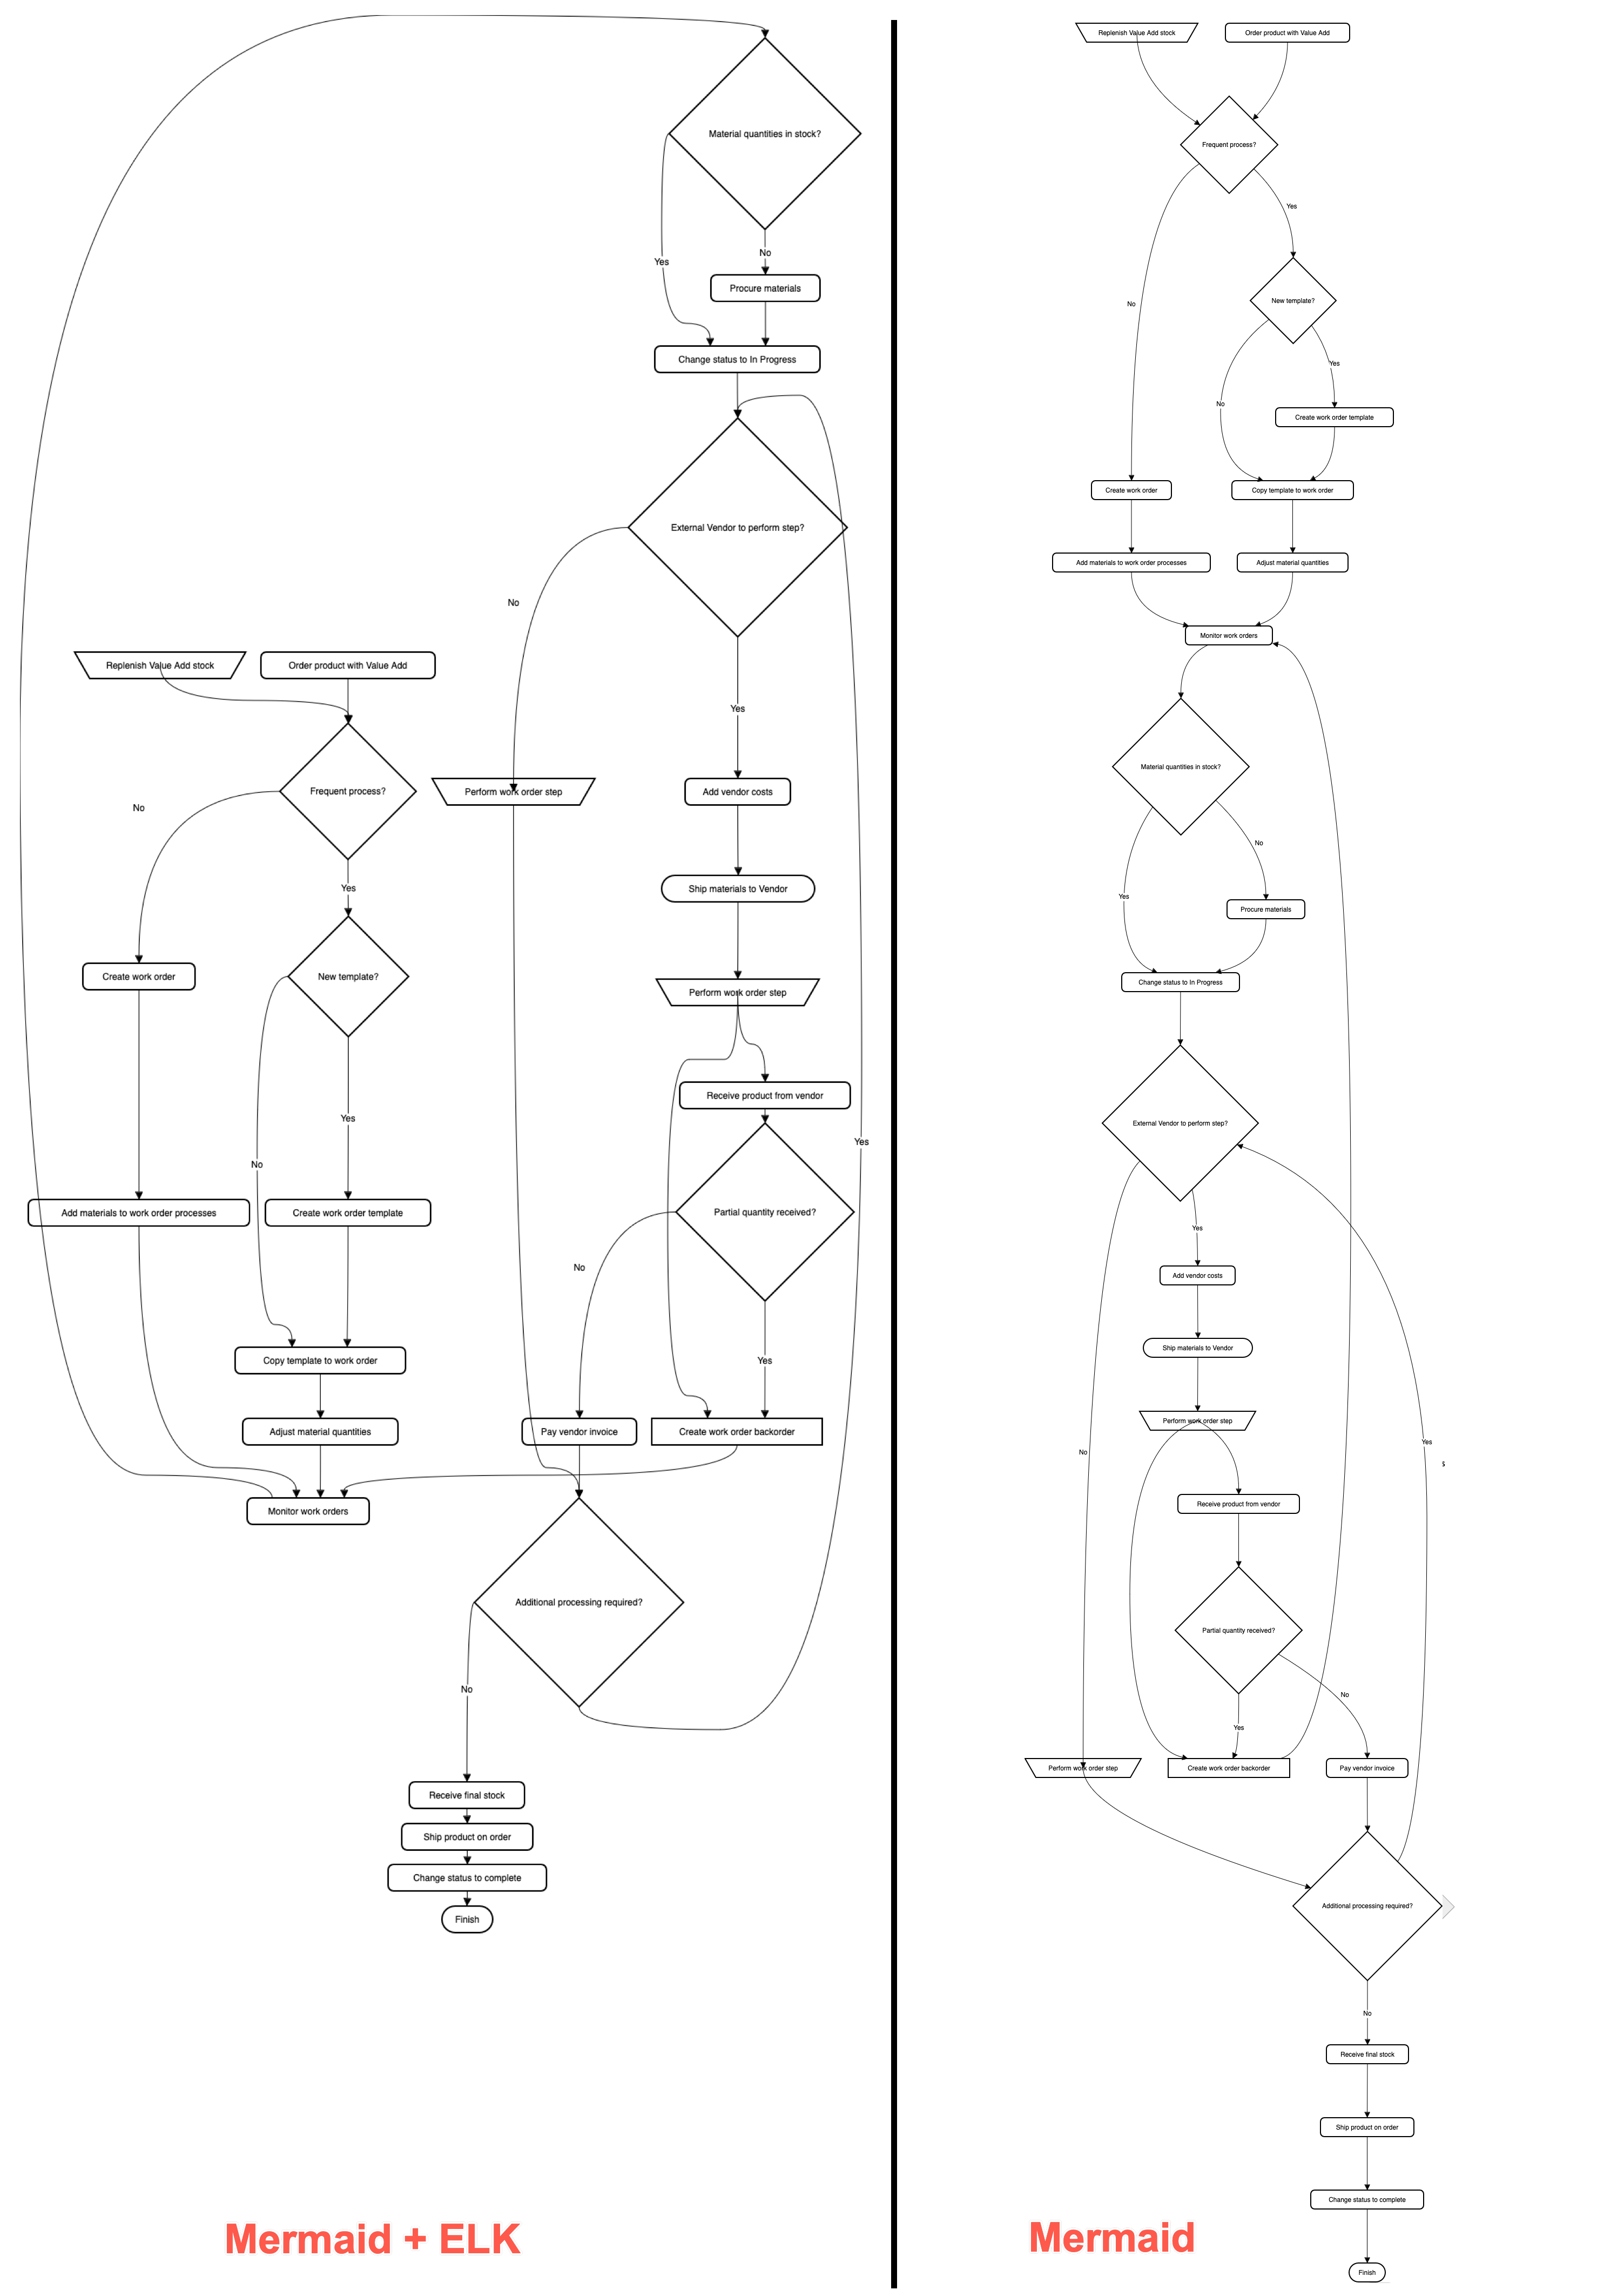
Below, one of the more complex draw.io flowchart templates has described in text using Mermaid syntax and inserted as an image. The more compact version on the left used the new ELK renderer directive, and the one on the right did not.

The ELK layout may be more suited for larger and more complex flows

With the ELK renderer directive, the Mermaid code for this flowchart looks as follows.

%%{init: {"flowchart": {"defaultRenderer": "elk"}} }%%

graph TD
A[\Replenish Value Add stock/] --->C
B(Order product with Value Add) --->C
C{Frequent process?} --->|Yes|D
C --->|No|F
D{New template?} --->|Yes|E
D --->|No|G
E(Create work order template) --->G
F(Create work order) --->H
G(Copy template to work order) --->I
H(Add materials to work order processes) --->J
I(Adjust material quantities) --->J
J(Monitor work orders) --->K
K{Material quantities in stock?} --->|No|L
K --->|Yes|M
L(Procure materials) --->M
M(Change status to In Progress) --->N
N{External Vendor to perform step?} --->|Yes|O
N --->|No|P
O(Add vendor costs) --->Q
P[\Perform work order step/] --->R
Q([Ship materials to Vendor]) --->S --->X
R{Additional processing required?} --->|Yes|N
R--->|No|T
S[\Perform work order step/] --->U
T(Receive final stock) --->V
U(Receive product from vendor) --->W
V(Ship product on order) --->Y
W{Partial quantity received?} --->|Yes|X
W --->|No|Z
X[Create work order backorder] ---> J
Y(Change status to complete) --->AA
Z(Pay vendor invoice) --->R
AA([Finish])

Privacy policy updates

· 3 min read

Data security and privacy are central to our draw.io diagramming tool - using our application platform, your diagram data storage means saving and loading is direct between your browser and whichever location your choose to save your diagram file. We don't allow your diagram data to be stored on our servers.

We take the same privacy and security focused approach to non-diagram data too here at JGraph - we don't use cookies or tracking pixels on our website.

Of course, if you contact us here at JGraph for support via GitHub, Google Groups, or one of our social channels, we will have your contact details - necessary to resolve your query.

In our updated privacy policy, we have now clarified that we will not send you any marketing communication using your details or data. We will also not share your personal data with any third-party company for marketing purposes.

Note: The draw.io app listings in the Atlassian Marketplace for Confluence and Jira are managed by Seibert Group GmbH, and therefore are governed by their privacy policy.

Use draw.io Desktop to diagram offline

Our draw.io desktop app runs fully offline on your local device, and your diagram data stays on your local device. The only external communications from the software are to check for application updates.

draw.io runs on Windows, macOS and Linux - download the draw.io Desktop installer for your operating system.

Configure data transmission lockdown

Set "lockdown": true in the editor configuration. Lockdown options only apply to cloud-based draw.io versions.

This will disable data transmission apart from directly between your browser where you are editing your diagram, and the cloud platform or location you have chosen to store the diagram file.

  1. In the online version of draw.io at app.diagrams.net, select Extras > Configuration in classic mode, ... > Settings > Configuration in Simple mode or the Sketch editor theme to open the configuration.
  2. Enter the "lockdown": true JSON string and click Apply.

In the draw.io app for Confluence Cloud (advanced edition only), go to the administration area, then the draw.io Configuration tab. Add "lockdown": true to the UI Configuration, and click Save changes.
Configure draw.io for Confluence Cloud to lock down your diagram data to match your Atlassian data residency settings

Note: There are few functions that use the draw.io servers to perform operations that browsers are not capable of, including to generate a PDF version of your diagram, and import a diagram file in .gliffy format. These functions won't be available if you lockdown data transmission.

Learn more about configuring the draw.io diagram editor

Collaborative editing in draw.io in Confluence DC

· 4 min read

Collaborative editing has long been possible in draw.io for Confluence Cloud. From the draw.io for Confluence DC release 13.0, you and your team will be able to edit the same diagram and see each other's changes.
Collaborative editing is available in draw.io for Confluence DC (version 8.x)

Collaborative editing works in both the draw.io Diagram macro and the draw.io Board macro in Confluence DC. Note the collaboration isn't real-time, we need to ensure a slower update rate is stable and causes no performance issues in the first release.

Real-time multi-user diagramming

Just like in draw.io for Confluence Cloud, the new collaborative editing feature in draw.io for Confluence DC uses the built-in auto-save feature.

  1. When you make a change to a draw.io diagram - add, style, or delete shapes, text and connectors, the diagram will be automatically saved to the Confluence page attachments.
  2. The draw.io diagram editor regularly polls the Confluence DC instance to see if any changes were made by other users, then loads these changes into your editor.

You don't need to manually save or synchronise the diagrams - changes will automatically appear in the draw.io editor for everyone editing the diagram.

No shared cursors?

As Confluence DC is not a cloud service with web sockets, there is no way to share and synchronise users' cursors as they work inside the diagram editor.

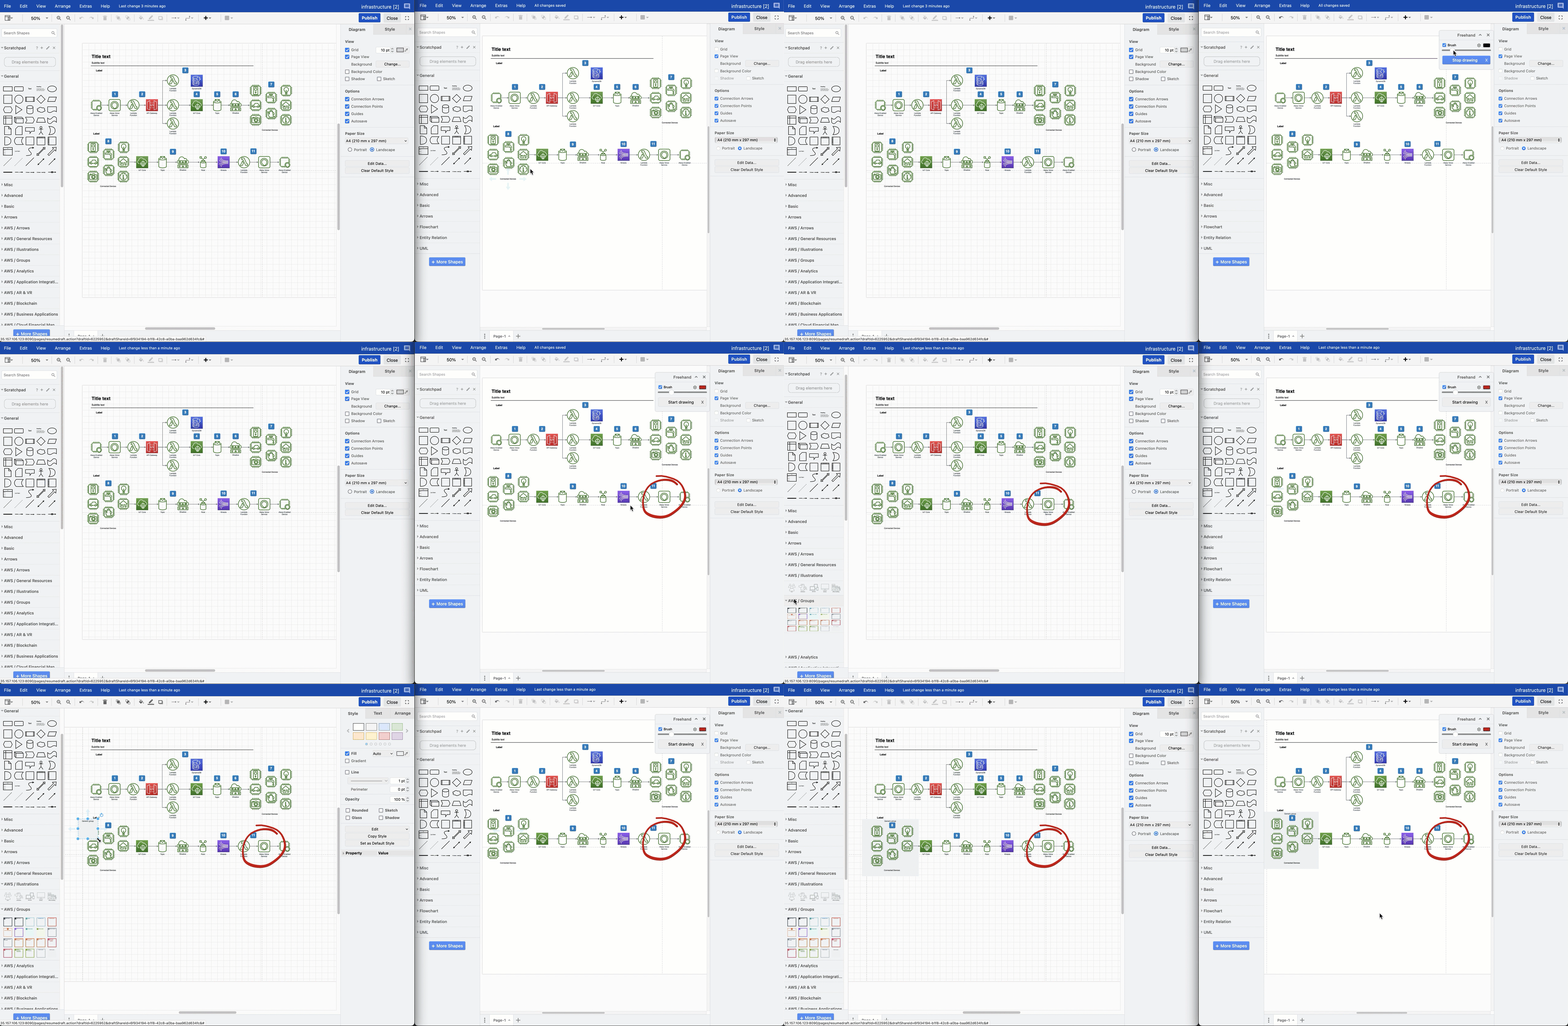
You can still make gestures on the diagram with the freehand brush to discuss a draw.io diagram in online meetings with your team - the freehand shape will appear in the other users' draw.io editor shortly after you draw it.

Collaborative editing is available in draw.io for Confluence DC (version 8.x)

Changes are merged from multiple users

If several users add shapes to the same location on a diagram, draw.io will take all those shapes and simply overlap them.

If one user adds and connects a new shape to an existing shape, but another user deletes the existing shape, both user's changes are saved:

  • The child shape will appear to stand alone as its parent was deleted.
  • The existing parent shape and any connectors from it to new shapes added by other users will be deleted.

This is the same process followed by the collaborative editing function in draw.io for Confluence Cloud.

Because draw.io merges all the changes made to a diagram, and does not overwrite the attachment with the most recent saved state from one user, you won't lose any data when you are editing a diagram as a team.

Change the synchronisation speed and auto-save interval

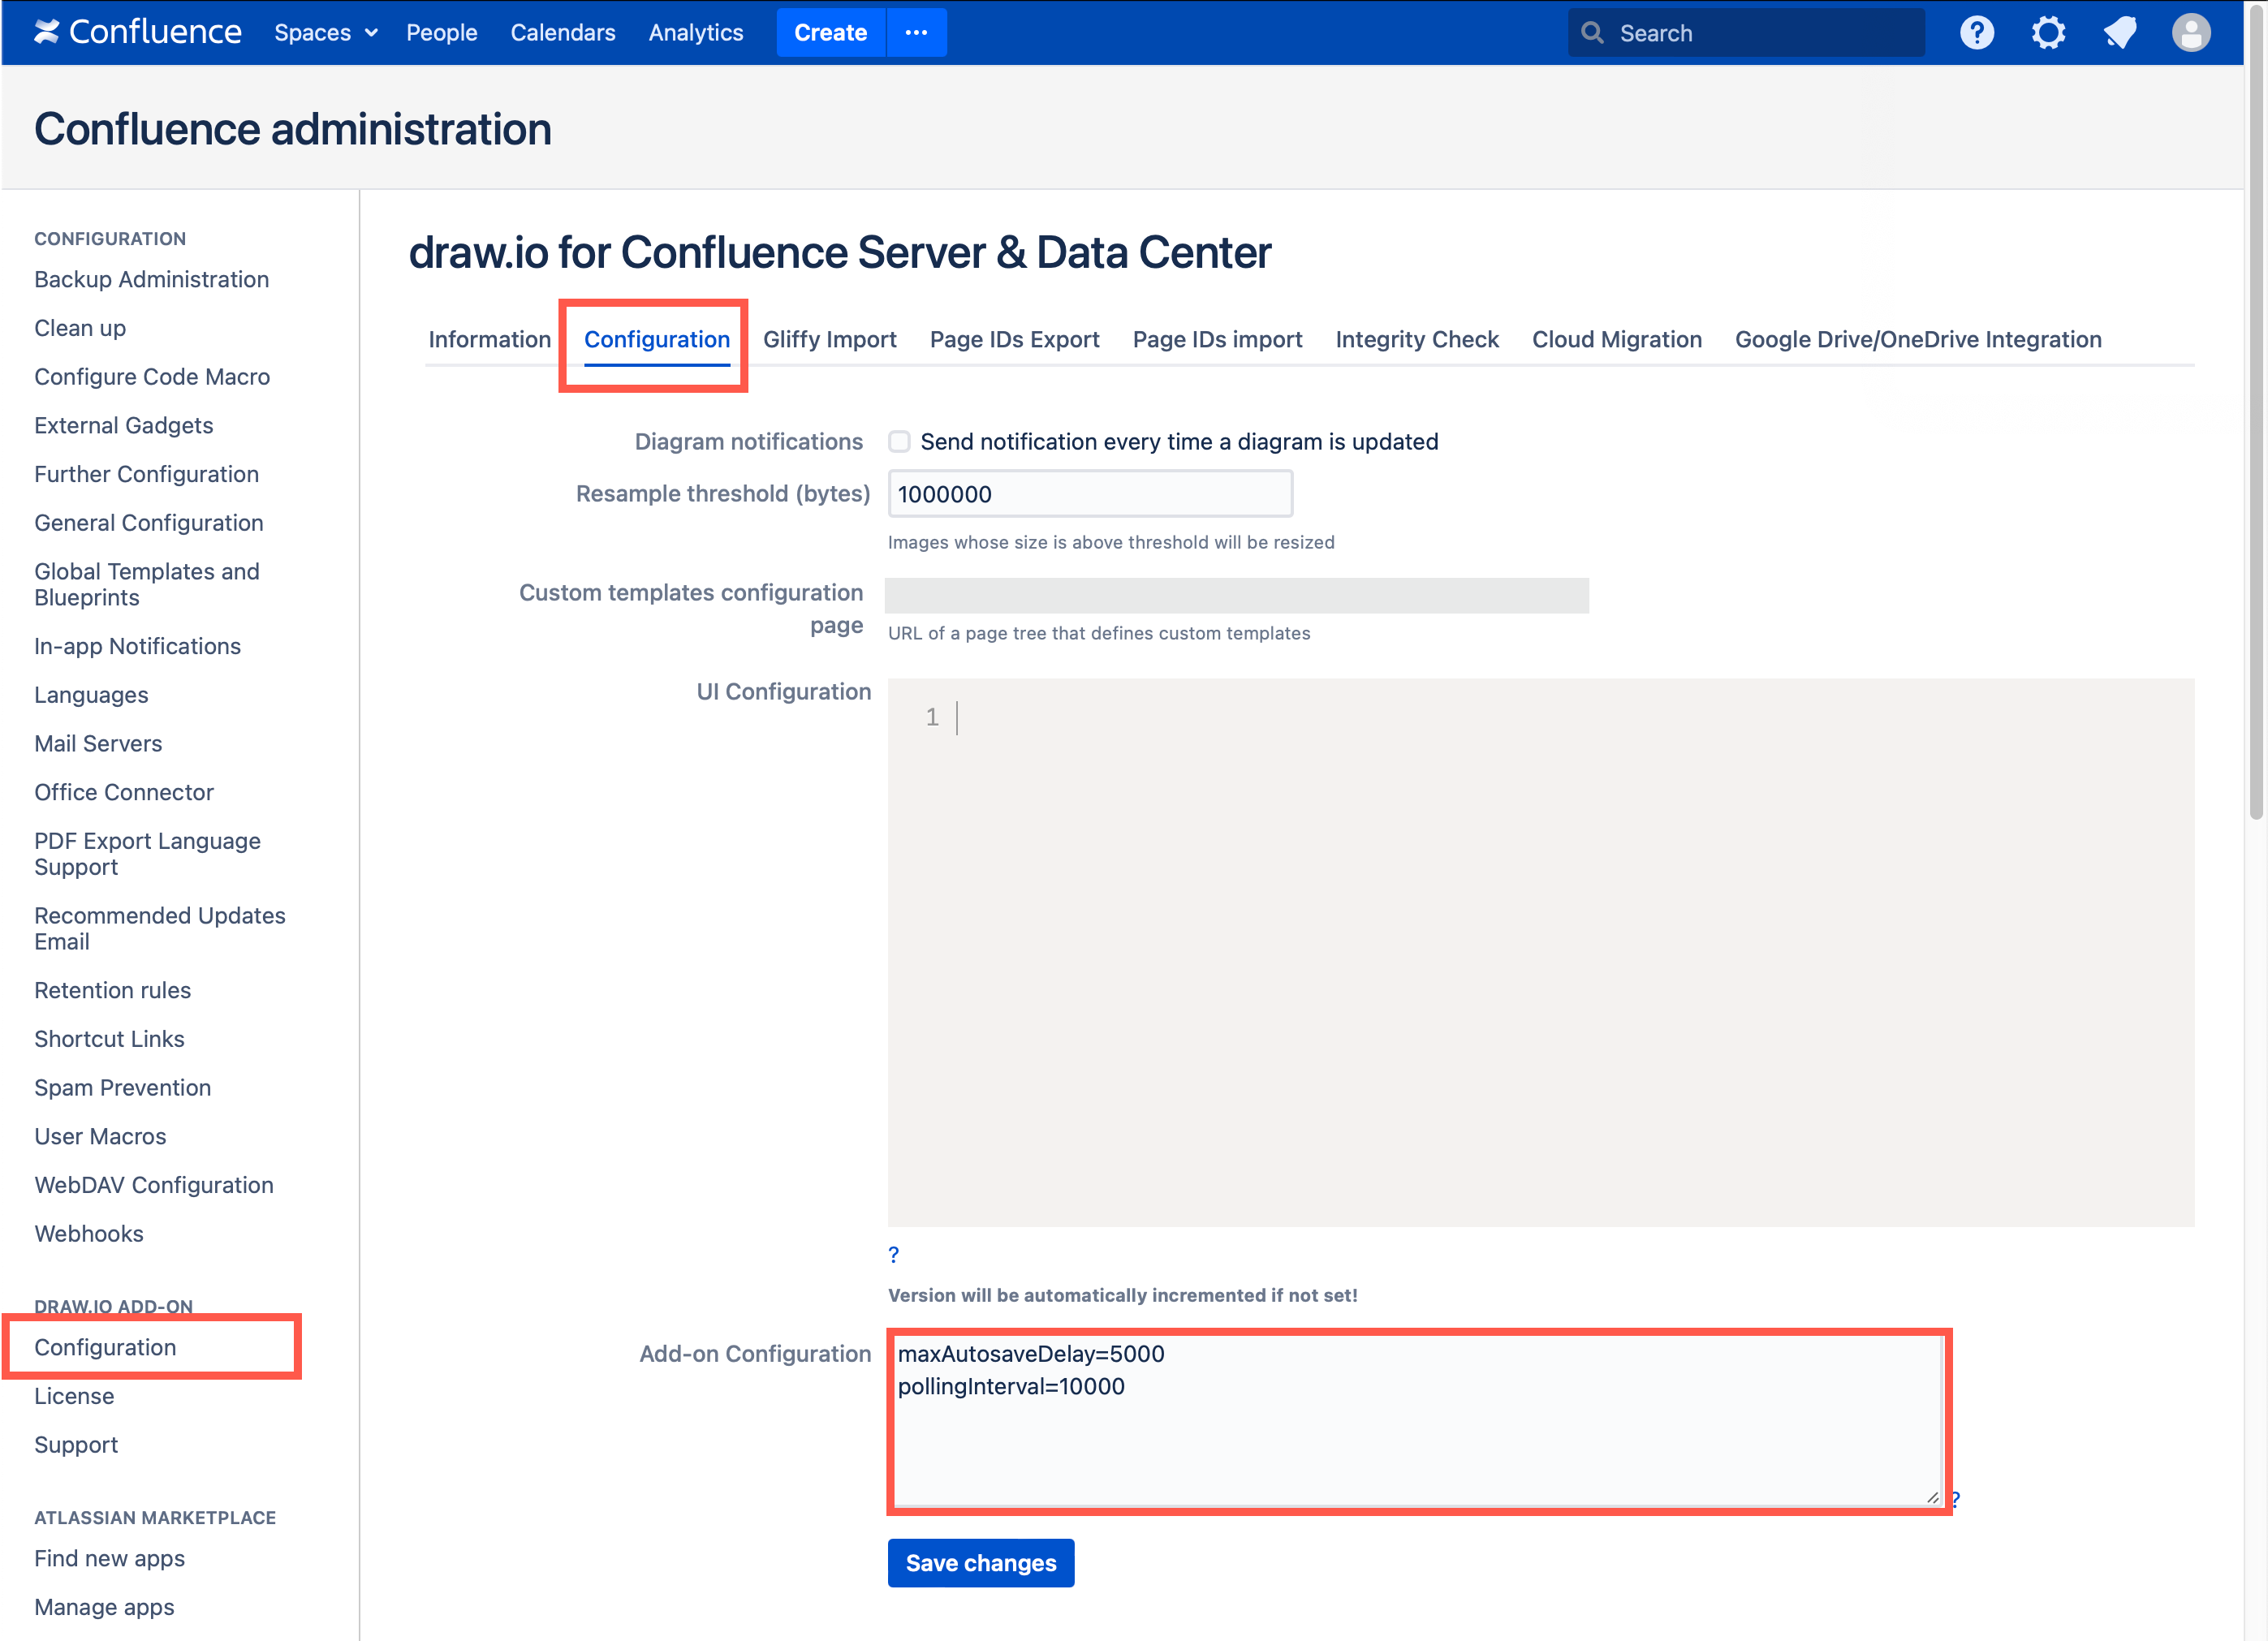
If your Confluence DC users find that changes appear in diagrams they are editing together too slowly, an administrator can increase the polling speed in the draw.io app configuration, by specifying the number of seconds between each poll in the Add-on Configuration field.

Also, you can shorten the time between auto-saving the diagram. A shorter interval will mean more attachment versions of diagrams will be created and added to a Confluence page.

  1. Go to the administration area of your Confluence DC instance.
  2. Go to the Configuration tab in the draw.io Add-on Configuration section.
  3. Add the following lines to the Add-on Configuration text field: pollingInterval=10000 and maxAutosaveDelay=5000
  4. Click Save changes to update the draw.io configuration.
    Set a faster polling interval for collaborative editing in Confluence DC 8.x via the app configuration in your Confluence administration

In the example above, we have set the polling interval to 10 seconds (which is 10,000 milliseconds).

Note: If you collaborate on extremely large and complex diagrams, you may need to set a longer polling interval.

See how to configure the draw.io editor for Confluence DC